R Determination of thermal properties at Äspö HRL. Comparison and evaluation of methods and methodologies for borehole KA 2599 G01
|
|
|
- Alf Henriksson
- för 5 år sedan
- Visningar:
Transkript
1 R Determination of thermal properties at Äspö HRL Comparison and evaluation of methods and methodologies for borehole KA 2599 G01 Jan Sundberg, Geo Innova AB August 2002 Svensk Kärnbränslehantering AB Swedish Nuclear Fuel and Waste Management Co Box 5864 SE Stockholm Sweden Tel Fax
2 ISSN SKB Rapport R Determination of thermal properties at Äspö HRL Comparison and evaluation of methods and methodologies for borehole KA 2599 G01 Jan Sundberg, Geo Innova AB August 2002 This report concerns a study which was conducted for SKB. The conclusions and viewpoints presented in the report are those of the author and do not necessarily coincide with those of the client. A pdf version of this document can be downloaded from
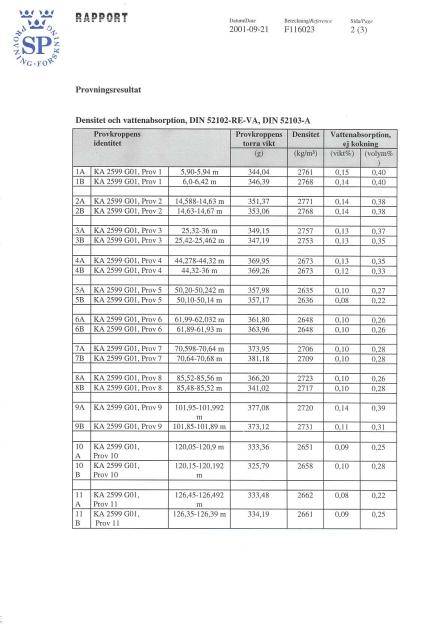
3 Foreword This report presents various results from determinations of thermal properties of the rock mass surrounding borehole KA 2599 G01 at Äspö HRL. The possibility to predict the result of a large scale measurement with other methods has been investigated. The project was conducted by Geo Innova AB, on a commission by the Swedish Nuclear Fuel and Waste Management Co. As a part of this work, samples of the rock were examined with respect to density and water absorption by the Swedish National Testing and Research Institute (SP). Geochemical and mineralogical composition of the rock were examined and evaluated by Terralogica AB. Laboratory measurements of thermal properties were performed by Hot Disk AB. In the field, a thermal response test was performed in a borehole by Luleå University of Technology. 3
4 Abstract Thermal properties of the rock mass surrounding borehole KA 2599 G01 at Äspö HRL have been investigated. A full-scale method, thermal response test, was performed and the result compared to what could be expected based on results from laboratory methods and assumptions regarding the rock type distribution. The thermal conductivity obtained from the thermal response test in borehole KA 2599 G01 has been estimated to 3.55 W/m,K. The predicted thermal conductivity is in the interval W/m,K, depending on different assumptions and methods. The thermal response test thus resulted in a 25% higher value compared to the prediction. The most reliable result is the predicted thermal conductivity based on laboratory measurements and revised rock mapping. The resulting thermal properties, corrected for 14 C, for the borehole are 2.85 W/m,K (thermal conductivity) and 2.02 MJ/m 3,K (volumetric heat capacity), based on 55% Äspö diorite, 25% Ävrö granite and 11% finegrained granite. The influence of the temperature on the thermal conductivity is small for the measured rock types. Reasons for the differences in the results can be related to different sources of errors in the methods or in the rock mapping. The thermal response test is, in this particular case, assumed to overestimate the thermal conductivity. The reasons for this may primarily be a combination of water movements in (parts of) the borehole due to high pressure gradients and thermal expansion of the water. 5
5 Summary The technique for long-term storage of used nuclear fuel is developed at the Äspö Hard Rock Laboratory. The deposit canisters generate heat due to nuclear fission. The temperature field in the repository depends on thermal properties of the rock and generated heat. The layout of the repository is dependent on the temperature field. The design criterion is the maximum temperature allowed on the surface of the canisters. A low thermal conductivity leads to a significantly larger distance between canisters than for a case with high thermal conductivity. Some of the available methods to determine thermal properties of the rock mass have been studied. A large-scale method, thermal response test, has been tested in a borehole at the Äspö Hard Rock Laboratory. To make a prediction of the result of the response test other methods were used. The prediction was made using direct laboratory measurements, calculations based on the mineralogy of the rock and core logging. The thermal conductivity obtained from the thermal response test in borehole KA 2599 G01 has been estimated to 3.55 W/m,K. The predicted thermal conductivity is in the interval W/m,K, depending on different assumptions and methods. The full-scale thermal response test thus resulted in a 25% higher value compared to the prediction based on different assumptions about mapped rock types and methods for determining the thermal conductivity (calculations or laboratory measurements). Reasons for obtained differences in the results can be related to different sources of errors in the methods or in the rock mapping. Thermal response tests measure an apparent thermal conductivity influenced by specific natural conditions in the field and the measurement itself. This influence can be small if the hydraulic conductivity of the rock mass is small. In the present case, large hydraulic pressure gradients exist in combination with a certain hydraulic conductivity, which increase the uncertainty of the measurements. Conditions influencing measurements of samples in the laboratory are more easily controlled and observed. However, the up scaling of the results from small samples to the whole drill core and the representativity of these samples can include uncertainties. The thermal response test is, in this particular case, assumed to overestimate the thermal conductivity. The reasons for this is not clear but may primarily be a combination of water movements in (parts of) the borehole due to high pressure gradients and thermal expansion of the water. The small temperature rise makes the temperature measurements sensitive to different disturbances during the test. The most reliable result is thus the predicted thermal conductivity based on laboratory measurements and revised rock mapping. The resulting thermal properties, corrected for 14 C, for the borehole are 2.85 W/m,K (thermal conductivity) and 2.02 MJ/m 3,K (volumetric heat capacity), based on 55% Äspö diorite, 25% Ävrö granite and 11% finegrained granite. The influence of the temperature on the thermal conductivity is small for the measured rock types. The measured volumetric heat capacity in the laboratory increased with the temperature, in average 17% (15 22%) within the temperature interval C. 7
6 Preliminary it is recommended to use the TPS method at SKB s site investigation program for determination of thermal properties of the rock mass. To eliminate possible systematic errors in the method it is recommended to perform comparisons with other laboratory methods. The thermal response test may be used for large-scale measurements of the rock mass if the uncertainties described above can be measured and held under control. 8
7 Sammanfattning Tekniken att under lång tid förvara använt kärnbränsle utvecklas vid Äspölaboratoriet. De kapslar som innesluter bränslet kommer att avge värme på grund av kärnklyvning. Temperaturfältet i och runt djupförvaret beror av bergmassans termiska egenskaper och den genererade värmens storlek. Utformningen av förvaret styrs av det förväntade temperaturfältet. Avgörande för dimensioneringen är den maximalt tillåtna temperaturen på kapslarnas yta. En låg värmeledningsförmåga medför betydligt större avstånd mellan kapslarna än för ett fall med hög värmeledningsförmåga. En del av de metoder som är tillgängliga för bestämning av termiska egenskaper har studerats. En storskalig metod, utfört i ett borrhål, s k termiskt responstest har provats vid Äspölaboratoriet. Möjligheten att kunna använda resultaten från andra metoder till att förutse resultatet av responstestet undersöktes. Dessa metoder utgjordes av direkt mätning i laboratoriet, beräkningar baserade på bergprovers mineralinnehåll och kartering av borrkärnan. Värmeledningsförmågan från termiskt responstest i borrhål KA 2599 G01 har uppskattats till 3,55 W/m,K. Den förväntade värmeledningsförmågan erhölls i intervallet 2,64 2,96 W/m,K., beroende på olika antaganden och metod. Fullskalemätning med termiskt responstest resulterade således i 25 % högre värde jämfört med vad som kan förväntas utifrån olika antaganden om karterade bergarter och metoder för bestämning av värmeledningsförmågan (beräkningar eller laboratoriemätningar). Orsaker till erhållna skillnader i resultaten kan vara kopplade till felkällor i metoderna eller i bergartskarteringen. Termiskt responstest mäter en värmeledningsförmåga påverkad av specifika naturliga förhållanden i fält och mätningens utförande. Påverkan kan vara liten om bergmassans hydrauliska konduktivitet är liten. I det aktuella fallet förekommer stora hydrauliska tryckgradienter i kombination med en viss hydraulisk konduktivitet i berget, vilket ökar mätosäkerheten. Förhållanden som påverkar mätningar av prover i laboratoriet är lättare att kontrollera och observera. Emellertid, att skala upp resultat från små prover till hela borrkärnan och representerbarheten hos dessa prover kan ge upphov till osäkerheter. För detta särskilda fall antas termiskt responstest överskatta värmeledningsförmågan. Orsakerna till detta är inte tydliga men de kan primärt bero på en kombination av vattenrörelser i (delar av) borrhålet på grund av höga tryckgradienter och termisk utvidgning av vattnet. Den låga temperaturgradienten gör temperaturmätningen känslig för olika störningar under försöket. Det mest tillförlitliga resultatet är den förutsedda värmeledningsförmågan baserad på laboratoriemätning och reviderad bergartskartering. De resulterande termiska egenskaperna för borrhålet, korrigerade för 14 C, uppgår till 2,85 W/m,K (värmeledningsförmåga) och 2,02 MJ/m³,K (värmekapacitet), med fördelningen 55 % Äspö diorit, 25 % Ävrö granit och 11 % finkornig granit. Temperaturens påverkan på värmeledningsförmågan är liten för de uppmätta bergarterna. Den uppmätta värmekapaciteten i laboratoriet ökade med temperaturen, i medeltal 17 % (15 22 %) inom temperaturintervallet C. 9
8 För SKB:s plastundersökningsprogram rekommenderas preliminärt att använda TPS-metoden för bestämning av bergmassans termiska egenskaper. För att eliminera eventuella systematiska fel hos metoden rekommenderas att jämförelser görs mot andra laboratoriemetoder. Termiskt responstest kan användas för storskaliga mätningar om de beskrivna osäkerheterna ovan kan mättas och hållas under uppsikt. 10
9 Contents 1 Introduction Background Objectives 14 2 Laboratory investigations 15 3 Description of methods Thermal response test Method Borehole Test procedure Laboratory analysis of density and porosity Analysis of chemical and mineralogical composition Laboratory measurements of thermal properties Method Test procedure Computer calculations of thermal conductivity 21 4 Characterisation of rock types Mapping of rock types Mineralogical composition Density and water absorption Rock types in drill core 25 5 Result and prediction of thermal properties Results from laboratory measurements Results from calculations Prediction of thermal response test Thermal response test 31 6 Evaluation Comparison between prediction and thermal response test Comparison between laboratory measurements and calculated values Temperature dependence of thermal properties Comparison between measurements at dry and saturated conditions Comparisons with previous studies Possible reasons for differences in the results General Thermal response test Laboratory measurements Theoretical calculations Methodology used for prediction 40 7 Conclusions and recommendations 41 8 References 43 11
10 Appendix 1 Appendix 2 Appendix 3 Appendix 4 Tullborg, E-L, Characterisation of rock types in core KA 2599G01 at the Äspö Hard Rock Laboratory. Terra-logica AB. 45 Porosity and density of core samples. SP Swedish National Testing and Research Institute. (in Swedish) 53 Thermal conductivity measurements with the TPS method. Hot Disk AB. (in Swedish) 57 Gehlin, S, Thermal response test for determination of thermal conductivity in rock, Äspö. Luleå University of Technology. (in Swedish with summary in English) 61 12
11 1 Introduction 1.1 Background As part of the Swedish nuclear waste disposal program a series of site investigations are planned. For each of the studied sites design work will be carried out as a foundation for studies of constructability, environmental impact assessment and safety assessment. The technique for long-term storage of used nuclear fuel is developed at the Äspö Hard Rock Laboratory. The deposit canisters generate heat due to nuclear fission. The temperature field in the repository depends on thermal properties of the rock and generated heat. The layout of the repository is dependent on the temperature field. The design criterion is specified as the maximum temperature allowed on the surface of the canisters. A low thermal conductivity leads to a significantly larger distance between canisters than in the case of a high thermal conductivity. Some of the available methods to determine thermal properties of the rock mass have been studied. A method to determine the thermal properties on a large scale in a borehole, thermal response test, has been tested at the Äspö Hard Rock Laboratory. The borehole, KA 2599 G01, was specially drilled for in-situ measurement of rock stress /Janson and Stigsson, 2002/. The core has a total length of m and is drilled vertically from the gallery in Äspö HRL at chainage 2599 m. Parallel to the response test other methods have been used to determine the thermal properties of the rock mass. Geo Innova AB has been commissioned by the Swedish Nuclear Waste Management Co (SKB) to make a prediction of the result of the thermal response test using a range of different methods and to evaluate the results. The prediction was made using direct laboratory measurement, calculations based on the mineralogy of the rock and core logging. The thermal response test was organised by Golder Associates AB. The test was performed and analysed by Luleå University of Technology. Measurements in the field were made by SKB s service personnel at Äspö HRL. 13
12 1.2 Objectives The objective is: To investigate the possibility to predict the result of large scale measurement with other methods. To investigate the influence on the prediction, of the thermal response test, of the quality of the rock type mapping. To compare the thermal properties of different rock types according to different methods and earlier results. To evaluate the results of the different methods and methodologies and give a recommendation to SKB s site investigation programme. 14
13 2 Laboratory investigations The investigations comprise: Laboratory measurements of thermal properties of rock samples. Detailed geological characterisation of samples of the drill core. Density and water absorption properties of rock samples. Calculations of thermal properties from mineralogical and chemical compositions. A total of 11 samples were selected from the drill core (diameter about 60 mm). Each sample was split into 3 sub samples. The samples were selected with respect to a combination of evenly distributed samples and the ability of the samples to be representative for homogeneous parts of the dominating rock types. Two of the sub samples were used for thermal properties and density measurements. The other sample was used for chemical analyses and examinations of the mineralogical composition. Hot Disk AB performed laboratory measurements of thermal conductivity and thermal diffusivity with the TPS method. All 11 samples were measured at room temperature (25 C) and 4 samples were measured at elevated temperatures, up to 80 C. The Swedish National Testing and Research Institute (SP) performed laboratory measurements of density and water absorption (porosity). Mineralogical and geochemical evaluation of all samples were performed by Terralogica AB (SGAB Analytica performed the geochemical analysis). Table 2-1. Laboratory investigations of rock samples. Sample no Core section (KA 2599 G01) Chemical and mineralogical Thermal properties x x x x x x x x x x x x x x x x x x x x x x x x x x x x x x x x x Density and porosity 15
14 3 Description of methods 3.1 Thermal response test Method The thermal response test method has been described by /Gehlin, 1998/. The method is shortly as follows: A U-pipe is placed in a borehole filled with groundwater. The pipe is filled with a fluid and connected to a heat generator. A constant heat supply of about W/m is supplied to the borehole by circulating heated water in the U-pipe. The time dependent temperature rise of the fluid is measured during a minimum time of 60 hours. The evaluation is based on the assumption that the borehole acts like an infinite line heat source, which is acceptable after a certain time if the borehole is long enough. The measured thermal response is compared with a best fit for the thermal conductivity and the borehole thermal resistance. Primarily, an apparent thermal conductivity of the total rock mass surrounding the borehole is determined with this method. The analysis assumes heat conduction only but the measured actual heat transfer also includes convective heat transport. Thus the evaluated thermal conductivity includes effects of a possible ground water flow and effects of convection Borehole The borehole, KA 2599 G01, was specially drilled for in-situ measurement of rock stress (core drill 96 mm), see /Janson and Stigsson, 2002/. The drilling was performed by Drillcone core AB with equipment from Hagby and started from the access ramp at the m level, see Figure 3-1. An electric and hydraulic core drilling machine, Onram 2000 CCD, was used for the drilling. The borehole has a total length of m and was drilled vertically from the gallery in Äspö HRL at chainage 2599 m (depth below sea level is 343 m). Due to the large depth, high water pressure (24 bar) was observed in the borehole and it was consequently sealed at the top to avoid leakage. Sudden losses in pressure of the drilling water were observed during the drilling of the vertical hole. Normally, the drilling was stopped and a measurement of the inflow to the borehole was made. The total measured inflow to the vertical hole was 36 l/min of which 32 l/min came from depths between 371 m and 374 m. From level 409 m and deeper, there were no further observations of inflow to the hole. A pressure build up test was performed in the vertical borehole. The pressure build up test resulted in a transmissivity of about m 2 /s. The temperature in the borehole was measured at level 400 m, one month after the response test, during one week. The temperature was measured at 13.2 C (closed hole). This measurement was performed after the thermal response test had been evaluated. 17
15 Figure 3-1. View of Äspö HRL from SSW. The borehole top is located at level m Test procedure The thermal response test was performed in borehole KA 2599 G01 at Äspö HRL and has been reported in Appendix 4. A special U-pipe made of aluminium was used due to the high external pressures. The undisturbed ground temperature was measured at 14.1 C, at the time for the measurements of rock stresses (open hole). Test data are given in Table 3-1. Table 3-1. Data for thermal response test in borehole KA 2599 G01 at Äspö HRL. Item Data Measurement period Installation Single U-pipe made of aluminium, D o = 33 mm, D i = 20 mm Undisturbed ground temperature 14.1 C Heat input Specific heat input Measurement time 6.25 kw (incl. pump power) 48 W/m 89 hours 18
16 3.2 Laboratory analysis of density and porosity Selected rock samples were examined in the laboratory with respect to density and water absorption. Water absorption is a measure of the amount of water that can be accumulated in pores. The measured water absorption can be approximated with the porosity of the samples (pore volume in relation to total volume). The density was determined according to standards, DIN RE VA. The water absorption was determined according to standards, DIN A. The precision has been increased compared to the standard in order to make it possible to detect differences between materials with very low water absorption properties. The investigations were performed by the Swedish National Testing and Research Institute (SP). 3.3 Analysis of chemical and mineralogical composition To make an estimate of the distribution of rock types along the borehole, BIPS-images, chemical analysis, and microscopy were used resulting in a refined mapping. The geochemical composition was determined using ICP analyses. Samples were also selected for mineralogical analyses using SEM and EDS techniques. Inductively Coupled Plasma (ICP) is an analytical technique used for the detection of trace metals in environmental samples, such as rocks. The plasma is actually a gas in which atoms are present in an ionised state. ICP in conjunction with mass spectrometry utilises high temperature argon plasma to excite the atoms of the elements present in the introduced solution. By using ICP several elements can be determined simultaneously. Sample preparation includes crushing and grounding of the sample. In scanning electron microscopy (SEM) an electron beam is scanned across a sample s surface. When the electrons strike the sample, a variety of signals are generated, and it is the detection of specific signals that produces an image of the sample s elemental composition. Interactions of the electron beam with atoms in the sample also result in the emission of X-rays. The emitted X-ray has an energy characteristic of the parent element. Detection and measurement of this energy using energy dispersive spectroscopy permits elemental analysis of the sample. Energy dispersive spectroscopy (EDS) can provide quantitative analysis of elemental composition with a sampling depth of 1 2 microns. The emitted X-rays can also be used to show the elemental distribution in the surface of a sample. Investigations and evaluations of geochemical and mineralogical compositions were performed by Terralogica AB. 19
17 3.4 Laboratory measurements of thermal properties Method Measurements of thermal properties in the laboratory were performed using the TPS method /Gustafsson, 1991/. The TPS (transient plane source) method is used for measurements of thermal diffusivity and thermal conductivity of both fluids and solids, from cryogenic temperatures to about 250 C (if the sensor insulation is made of kapton). The thermal conductivity that can be measured ranges from W/m C to 500 W/m C. This method has been used before by SKB /Sundberg and Gabrielsson, 1999/. The method uses a sensor element with an engraved pattern of a thin double spiral. The spiral is made of Ni metal and has specific resistivity properties. The spiral is embedded between two layers of kapton, to give it mechanical strength and electrical insulation whereas measurements may be performed in electrically conductive materials. The total thickness of the sensor is mm and for this specific application the diameter was 20 mm. The probing depth in a transient experiment should be of the same order as the diameter of the hot disk. To achieve this for different materials, sample-sizes and measurement-times, the sensor size can be varied. Measurements are performed by placing the sensor between two samples of the same material. The surfaces of the samples have to be fairly smooth and reasonably flat in order to limit the contact resistance between the sensor and the sample surfaces. During the measurement, the sensor acts both as a heat generator of a heat pulse and as sensor for the temperature response. The temperature vs. time response is measured in 200 data points. The evaluation uses the fact that the resistance for a thin Ni spiral at any time is a function of its initial resistance, the temperature increase and the temperature coefficient of the resistivity. A model of heat propagation trough the sample, assuming a plane source (sensor) and an infinite sample in perfect contact with the sensor surfaces, is stored in the software. By fitting measured temperatures to this model, through a number of iterations, the thermal diffusivity and thermal conductivity are determined. From these, volumetric heat capacity is calculated. The accuracy of the thermal conductivity measurements is better than 5% for the interval W/m C, and the repetitiveness is better than 2% according to the manufacturer Test procedure Rock samples from core drillings have a diameter of about 60 mm. The selected samples were cut in two halves, each with a thickness of about mm. The two intersection surfaces were then carefully polished. Initially, all samples were measured with respect to thermal diffusivity and thermal conductivity at room temperature (approximately 25 C). In order to water saturate the samples, all samples were placed under vacuum in water for 4 12 h, dried in air for >3 h and measured again. A selection of four samples was also measured at assumed dry conditions at elevated temperature (40, 60, 80 C) and finally at room temperature (sample no 3, 4, 8 and 9 in Table 2-1). The laboratory had never performed measurements on rock samples at elevated temperature why the measurements included elements of development. 20
18 For each sample and temperature, five measurements were performed with 30 minutes interval. Thermal properties are presented as a mean value of these measurements. For some samples, one or two measurements were excluded. Measurements at elevated temperatures were performed by placing the sample in an oven. The sensor was not dismounted between the measurements. The total time in the oven was h for each sample except for sample 4. The temperature tolerances in the oven for sample 4 were lower and therefore the time increased to about 36 h. This sample was also left in the oven at 80 C for an additional 24 h and then measured again. The objective was to perform measurements at dry conditions at elevated temperatures but the results showed unstable water conditions for 40 and 60 C. These results were therefore excluded from the evaluation. Measurements of thermal properties in the laboratory were performed by Hot Disk AB. 3.5 Computer calculations of thermal conductivity The thermal conductivity was calculated with the Condrock programme /Sundberg, 1991:2/. Condrock calculates the thermal conductivity of isotropic rock at normal temperature, about 10 C. The thermal conductivity of the rock is calculated using reference values of the thermal conductivity of different minerals together with the volume fractions as input. The numerical solution is based on the self-consistent approximation (SCA) that has previously proved to be in good agreement with measured values /Sundberg, 1988/. The thermal conductivity of plagioclase, as well as olivine and pyroxene, depends on the chemical composition and may therefore vary within certain intervals. 21
19 4 Characterisation of rock types 4.1 Mapping of rock types The drill core was originally mapped as Äspö diorite, Fine-grained granite, and Meta-basite (original mapping). However, during the course of the project a more detailed mapping was performed and it became clear that the term Äspö diorite involved a range of varieties including what has previously been mapped as Ävrö granite in the Äspö area and hybrid rocks (mingled types) between Ävrö granite and Äspö diorite. The core mapping revealed the following rock types (revised mapping); a) Äspö quartz-monzodiorite (Äspö QMD) b) Altered Äspö quartz-monzodiorite (Altered ÄQMD) c) Ävrö granite d) Altered Ävrö granite e) Fine-grained granite f) Meta-basite g) Mingled Ävrö granite/äspö diorite A closer description of the different rock types is given in Appendix 1. Table 4-1 shows sampled core intervals and rock types selected for chemical analyses and thin sections. Table 4-1. Samples from drillcore KA 2599 G01 selected for chemical analyses and thin sections. Sampled core interval Sample no Rock type Äspö diorite Äspö diorite Äspö diorite Ävrö granite Fine-grained granite Fine-grained granite Qz-rich Äspö diorite Oz-rich Äspö diorite Altered Äspö diorite Ävrö granite Ävrö granite 23
20 4.2 Mineralogical composition Mineral composition of the different rock types, based on mean values, is shown in Table 4-2. The mineral composition is based on microscopy and considerations have been taken regarding the chemical composition. The mineral composition varies between the examined rock types and small variations between samples of the same rock type are also common. Table 4-2. Estimated mineralogical composition of rock types (%). Sample Äspö QMD Ävrö granite Fine-grained granite Altered ÄQMD Number of samples Quartz Plagioclase 40 (An* 25 30%) 28 (An 20 30%) 15 (An 20 25%) 25 (An 0 5%) K-feldspar Biotite Chlorite Titanite Amphibole 0.2 Epidote Sericite Opaques *) An = anorthite 4.3 Density and water absorption Density of rock samples is shown in Figure 4-1. Type of rock of each sample is given in Table 4-1. The figure shows that samples with Äspö diorite have higher densities (1, 2, 3, 7, 8, 9) than Ävrö granite and fine-grained granite. 24
21 Density Kg/m Sample no Figure 4-1. Density of selected rock samples. The porosity of the rock was approximated with the ability to absorb water. Measured porosity of the samples varies from 0.22% to 0.4%, see Appendix 2. These values correspond to a porosity, which does not include isolated pores. 4.4 Rock types in drill core The distribution of different rock types in drill core KA 2599 G01 has been estimated in Appendix 1. The mapping was performed by using the characteristics given in Table 4-2 and performing a re-visitation of the BIPS. The distribution is shown in Table 4-3. Äspö quartz-monzodiorite dominates before Ävrö granite and fine-grained granite. Compared to the rock type distribution in the prototype repository at Äspö HRL, the amount of Äspö diorite is smaller in the drill core. The Äspö diorite is also less altered in the drill core. According to the original mapping, the distribution was dominated by Äspö diorite (85%) followed by fine-grained granite (10%) and metabasite (5%), see Table
22 Table 4-3. Rock type distribution along drill core KA 2599 G01 according to revised mapping. Rock type Percentage of core Core section (m) Äspö QMD 54.6% ; ; ; ; ; ; ; Ävrö granite 25.1% ; ; ; ; ; Fine-grained granite 11% ; ; ; ; ; Meta-basite 4.3% ; ; Mingled Ävrö granite/ Äspö diorite 3.7% Altered ÄQMD 1% Altered Ävrö granite 0.2% Table 4-4. Rock type distribution along drill core KA 2599 G01 according to original mapping. Rock type Percentage of core Core section (m) Äspö diorite 85% 4 46, Fine-grained granite 10% , 56 59, Meta-basite 5% ,
23 5 Result and prediction of thermal properties 5.1 Results from laboratory measurements The results from measurements with the TPS method at room temperature are shown in Figure 5-1 (thermal conductivity) and Figure 5-2 (volumetric heat capacity). The samples were water saturated. A key to the sample numbers is found in Table 4-1 and Table 5-1. Complete results from the measurements of thermal properties are compiled in Appendix 3. Thermal Conductivity 4 3,5 W/(m*K) 3 2,5 2 1, Sample no Figure 5-1. Measured thermal conductivity at room temperature. Volumetric Heat Capacity MJ/(m 3 *K) 2,6 2,4 2,2 2 1,8 1,6 1,4 1, Sample no Figure 5-2. Measured heat capacity at room temperature. 27
24 Measured thermal conductivity at room temperature for different rock types are shown in Table 5-1. Table 5-1. Results from measurements on thermal conductivity at room temperature subdivided on rock type. Sample no Äspö Diorite Altered Äspö Diorite Ävrö granite Geom. mean: Fine-grained granite Results from measurements with the TPS method at different temperatures are shown in Table 5-2 (thermal conductivity) and Table 5-3 (volumetric heat capacity). The samples were dry, which means that only the relative changes in the values are of interest and not the absolute values. The influence of the temperature is small for the thermal conductivity and rather high for the heat capacity. The other measurements at 40 and 60 C were neglected due to unstable water contents during the measurements. Table 5-2. Thermal conductivity (W/m,K) of dry samples at 25 and 80ºC. Temperature Sample 3 Äspö Diorite 4 Ävrö Granite 8 Qz-rich Äspö Diorite 9 Alt. Äspö Diorite 80ºC ºC ºC 0.99% 0.88% 0.85% 4.09% Per 100ºC 1.80% 1.61% 1.55% 7.44% Table 5-3. Volumetric heat capacity (MJ/m³,K) of dry samples at 25 and 80ºC. Temperature Sample 3 Äspö Diorite 4 Ävrö Granite 8 Qz-rich Äspö Diorite 9 Alt. Äspö Diorite 80ºC ºC ºC 17.64% 15.17% 15.57% 21.93% Per 100ºC 32.08% 27.58% 28.31% 39.87% 28
25 5.2 Results from calculations Calculations of the thermal conductivity have been made with the Self Consistent Approximation /Sundberg, 1988/. The calculations are based on the mineral content for different rock types in Table 4-2 and available data on thermal properties for different minerals. The result from the calculations is summarised in Table 5-4. The densities of different rock types were calculated as mean values, from measurements on several samples, see also Figure 4-1 and Table 4-1. Table 5-4. Calculated thermal conductivity (W/m,K), volumetric heat capacity (MJ/m³,K) and measured density (kg/m³) for different rock types. Äspö Diorite Altered Äspö Ävrö granite Fine-grained Diorite granite Thermal conductivity Heat capacity Density Prediction of thermal response test The thermal conductivity for the entire borehole has been predicted by using different assumptions and methods. 1. The 11 laboratory measurements are representative for equal parts of the drill core (irrespective of actual rock type distribution). 2. The measured thermal properties of each rock type are representative for all parts of the drill core where the particular rock type has been mapped according to the original mapping. 3. The measured thermal properties of each rock type are representative for all parts of the drill core where the particular rock type has been mapped according to the revised mapping. 4. The calculated thermal properties of each rock type are representative for all parts of the drill core where the particular rock type has been mapped according to the revised mapping. Parts of the drill core consist of rock types that have not been measured or calculated (meta-basites and mingled Äspö diorite/ävrö granite). Thermal properties of metabasites have been obtained from /Sundberg, 1991/ (calculated values). Thermal properties of mingled Äspö diorite/ävrö granite have been approximated with mean values of the two rock types. The results are shown in Table 5-5 and Table 5-6. It is interesting to observe that quite different assumptions regarding representation of the measured values give rather small differences in thermal conductivity (assumptions 1 3). For the measured values assumption No. 3 is judged to be the most accurate and is therefore used in a comparison with the thermal response test. This value is also corrected for the temperature difference in the laboratory (25ºC) compared to the field (14ºC), based on results in Table 5-2 and Table
26 Table 5-5. Prediction of thermal response test (thermal conductivity for the entire rock mass in the borehole) with different assumptions and methods, see text. Values corrected for temperature a difference (25ºC 14ºC) are in brackets. Assumpt. method Distribution of rock types / thermal conductivity (W/m,K) Äspö Diorite Altered Äspö Diorite Ävrö Granite Fine-grained granite 1 Distribution irrelevant 2.96 Mingled Meta-basite 2 85% 10% 5% % 1% 25% 11% 3.7% 4.8% (2.85) % 1% 25% 11% 3.7% 4.8% Table 5-6. Prediction of volumetric heat capacity for the rock mass surrounding the borehole, with different assumptions and methods. Values corrected for temperature a difference (25ºC 14ºC) are in brackets. Assumpt. method Distribution of rock types / heat capacity (MJ/m³,K) Äspö Diorite Altered Äspö Diorite Ävrö Granite Fine-grained granite 1 Distribution irrelevant 2.10 Mingled Meta-basite 2 85% 10% 5% % 1% 25% 11% 3.7% 4.8% (2.02) % 1% 25% 11% 3.7% 4.8% The thermal conductivity varies between 2.64 and 2.96 W/m,K depending on assumed rock type distribution and method. The corresponding heat capacity varies within a smaller interval ( MJ/m³,K). 30
27 5.4 Thermal response test The effective thermal conductivity from the thermal response test was evaluated at 3.55 W/m,K. Heat transfer was assumed mainly to take place through heat conduction and with negligible contribution from ground water movements. In Appendix 4, some possible sources of errors and uncertainties are presented. Temperature versus time from the thermal response test is shown in Figure 5-3. The temperature is a measured average between in and out flow temperatures of the fluid. temperature, C Time, s Figure 5-3. Time vs. temperature from thermal response test. Data from Appendix
28 6 Evaluation 6.1 Comparison between prediction and thermal response test The thermal conductivity obtained from the thermal response test in borehole KA 2599 G01 has been estimated at 3.55 W/m,K (see Appendix 4). The predicted thermal conductivity is in the interval W/m,K, depending on different assumptions and methods, see Table 5-5. In Table 6-1 a comparison is made between the thermal response test and the most reliable assumptions of rock type representation, for laboratory measurements and theoretical calculations. The correction for a temperature difference between laboratory and field determinations is very small and it is therefore ignored. The thermal response test resulted in 25% higher values than laboratory measurements with a rock type distribution based on the revised core mapping. Table 6-1. Comparisons between results from thermal response test and predictions using laboratory measurements and calculations with an assumed rock type distribution. Method/Assumption Thermal conductivity, W/m,K Difference, % Laboratory measurements with revised core mapping Theoretical calculations with revised core mapping 2.84 Base Thermal response test Comparison between laboratory measurements and calculated values Table 6-2 shows results of thermal properties from laboratory measurements and theoretical calculations. The calculated thermal conductivity is about 5 8% lower than the measured value except for altered Äspö diorite where the calculated value is 9% higher. The calculated heat capacity is about 5 10% lower than the measured values for altered Äspö diorite and Ävrö granite and about equal to the measured values for Äspö diorite and fine-grained granite. 33
29 Table 6-2. Comparison between laboratory measurements and calculated values for different rock types (SCA = self-consistent approximation). Method Äspö Diorite λ W/m,K C MJ/m 3,K Altered Äspö Diorite λ C W/m,K MJ/m 3,K Ävrö granite λ W/m,K C MJ/m 3,K Fine-grained granite λ W/m,K C MJ/m 3,K Calculated (SCA) Measured (TPS method) Diff, % (SCA-TPS)/TPS 8.2% +1.0% +8.7% 10.0% 7.1% 5.6% 5.0% 1.0% 6.3 Temperature dependence of thermal properties Laboratory measurements of thermal conductivity show in general no obvious trends with respect to temperature for different rock types. This is in agreement with a previous study on the prototype repository /Sundberg and Gabrielsson, 1999/. The exception is altered Äspö diorite (sample 9), where there is a trend towards decreasing thermal conductivity values with the temperature (Table 5-2). Studies of the temperature dependence of the thermal conductivity of common rocks presented in literature have shown a decrease in thermal conductivity with the temperature. The decrease may be in the order of 5 15% per 100 C /Sibbit et al, 1979/. The measured volumetric heat capacity in the laboratory increased with the temperature, in average 17% (15 22%) within the temperature interval C (Table 5-3). The result is in the same magnitude as a previous study on the prototype repository /Sundberg and Gabrielsson, 1999/. An increase of the heat capacity with the temperature has also been reported in the literature. For example in a study by /Berman and Brown, 1985/ the heat capacity of common minerals increased by about 5% between 25 and 50 C and by about 10% between 100 and 200 C (quartz: 15%). 6.4 Comparison between measurements at dry and saturated conditions Measurements at assumed dry and water-saturated conditions indicate a difference in thermal conductivity of 0 5% in spite of small differences in porosity, see Table 6-3. For 2 or 3 of the samples the difference is too large to be explained by pores shaped like spheres. Instead the porosity can be in the form of micro fissures, which can act like a barrier for the heat flow. For that type of porosity Hashin and Shtrikman s lower bound has been suggested to be relevant to estimate the difference in thermal conductivity between dry and water saturated conditions. Applying this to the data of Table 6-3 results in a difference of about 10%, which is too high a value. This indicates that the porosity appears both like spheres and micro fissures. The smallest difference (0%) is for alternated Äspö diorite. 34
30 Table 6-3. Thermal conductivity (λ) for rock samples under assumed dry and water saturated conditions. Sample 3 Äspö Diorite 4 Ävrö Granite 8 Qz-rich Äspö Diorite Porosity 0.36% 0.34% 0.27% 0.35% λ, Wet (W/m,K) λ, Dry (W/m,K) Difference (dry=base) 2% 5% 4% 0% 9 Alt. Äspö Diorite Table 6-4. Volumetric heat capacity (C) for rock samples under assumed dry and water saturated conditions. Sample 3 Äspö Diorite 4 Ävrö Granite 8 Qz-rich Äspö Diorite Porosity 0.36% 0.34% 0.27% 0.35% C, Wet (MJ/m³,K) C, Dry (MJ/m³,K) Difference (dry=base) 4% 2% 0% 7% 9 Alt. Äspö Diorite The difference in volumetric heat capacity is about 0 7%, Table Comparisons with previous studies Thermal properties of different rock types at Äspö have previous been calculated based on modal analyses of samples from the rock surface and from boreholes /Sundberg, 1991:1/, see Table 6-5. Furthermore, measurements and calculations for samples from the prototype repository have been made in another study /Sundberg and Gabrielsson, 1999/. For the calculations, estimated values of the thermal conductivity of plagioclase and pyroxene were used based on estimations of the chemical composition of these minerals. The results from the present study and the two previous studies are presented in Table 6-6. The difference in the results in calculated values for different investigations is probably due to real differences in mineral content and different assumptions with respect to the mineral composition. For example in /Sundberg and Gabrielsson, 1999/, it is shown that a chlorite content in the Äspö diorite significantly affects the thermal conductivity. 35
31 Table 6-5. Mean values of thermal conductivity, from calculations based on estimations of mineral composition of different rock types at Äspö /Sundberg, 1991:1/. Rock type Thermal conductivity [W/m C] 1. Meta basite Dioritoids Quartz monzodiorite-granodiorite Granodiorite-granite Granite All samples Heat capacity [J/kg C] Table 6-6. Calculated and measured thermal conductivity (W/m,K) of different rock types from the Äspö area, from different studies. /Sundberg, 1991/ /Sundberg and Gabrielsson, 1999/ Present study 2001 Rock type Calculated, SCA Calculated, SCA Measured, TPS Calculated, SCA Measured, TPS (Fresh) Äspö diorite Altered Äspö diorite group Ävrö granite Fine-grained granite 3.48 group Xenolith 2.58 group Refers to Table 6-5. Furthermore, the thermal conductivity in /Sundberg, 1991/ was calculated for a thermal conductivity of 1.8 W/m,K for the plagioclase, which corresponds to an anorthite content of 15%. In the present study and in /Sundberg and Gabrielsson, 1999/, the anorthite content in plagioclase is estimated at approx. 25% for the fresh Äspö diorite and the corresponding thermal conductivity becomes 1.6 W/m,K. The difference in thermal conductivity for fresh Äspö diorite is small between the studies in 1999 and 2001 and may be connected to differences in the mineral composition. Field values measured on Äspö diorite /Sundberg and Gabrielsson, 1999/ show somewhat higher values compared with laboratory measurements (2.83 W/m,K). 36
32 6.6 Possible reasons for differences in the results General Reasons for obtained differences in the results in Table 6-1 and Table 6-2 can be related to errors in the different methods or in the rock mapping. These potential sources of errors are: 1. Differences in properties of rock samples compared with the actual rock in the field. 2. Influence of conditions in the field. 3. Performance of the tests and applied test procedures. 4. Errors in the method and limitations of background theories. 5. Insufficient representativity and scale factors. The possible reasons for the discrepancy are discussed under each method below Thermal response test The result of the thermal response test show an approximately 25% higher value of the thermal conductivity compared to laboratory tests on rock samples from the drill core. A number of reasons can influence the measurements in the field. They can be sorted in the following groups and will be discussed below: Convection in the borehole or in the rock mass. Errors in heat generation and temperature. Unstable temperature in the rock mass. Boundary effects. The borehole has its top at level 343 m below sea level and it is 130 m deep. Some hydraulic investigations have been performed in the borehole but it has not been fully hydraulically characterised. The borehole has been tested by packer tests in different sections, in the lower part and for the whole borehole. The lower parts of the borehole have a low hydraulic conductivity. Observations during drilling and measurements of the total transmissivity for the borehole indicate a somewhat higher hydraulic conductivity in the upper parts. The hydraulic situation is rather complicated and disturbed. Water is pumped from the whole tunnel system. These circumstances mean that there are large hydraulic gradients for water movements. The borehole is situated close to the tunnel system, see Figure 3-1. Water movements will most likely have an influence on the measurement. Water movements along (upper parts) of the borehole are possible and may have influenced the temperature and the generated heat to the rock. However, measurements that can indicate vertical water flow were not performed during the response test. Water movements in the rock mass may also have some minor influence on the measurements. 37
33 Movements due to expansion of the water with increasing temperature, during the test, may also occur. Water in the borehole can drain, possibly at the upper part of the borehole. Colder water from the surroundings can then sift through fissures at lower parts of the borehole. This phenomenon is referred to as thermal siphon effect /Gehlin, 1998/. The thermal effect on the measurements is similar to the above described flow due to hydraulic gradient. The heat generated to the borehole consists of measured heat input from the generator plus electric energy transferred to heat in the circulation pump minus heat losses from the aggregate. If the generated heat is overestimated the evaluated thermal conductivity is also overestimated and vice versa. The heat input and the electric energy to the pump can be measured carefully. The heat losses from the aggregate have been estimated in Appendix 4 to be small, but these losses may be somewhat underestimated. The temperature rise is calculated as a mean value of the inflow and outflow temperatures. If the relative temperature rise is small in the time interval used for evaluation, the temperature will be sensitive to different disturbances. The measured temperature rise is C/h in the time interval h, which means that quite small disturbances could cause significant errors. Such disturbance could be caused by small temperature changes in the rock mass due to temperature changes in the tunnel system or water movements. The temperature stability in the borehole at level 400 was measured a month after the response test and indicates that a temperature drift is less likely. The temperature rise using a logarithmic time scale is shown in Figure 6-1. The curve indicates some kind of disturbance on the temperature rise. During pseudo steady state conditions (after about 100,000 s), the thermal conductivity normally can be evaluated from the slope of the asymptote. In this case quite different thermal conductivities can be evaluated depending on the selected part of the curve, which indicates disturbances on the measurements Temperature, C Time, s Figure 6-1. Thermal response test. Temperature vs. time (logarithmic time scale). Data from Appendix 4. 38
34 The measured temperature of the fluid is a mean value of the temperature of the fluid in the U-pipe along the borehole. This means that the temperature rise is lowered by the lower temperatures at the ends of the borehole, caused by 3-dimensional effects. Due to heat conduction this phenomenon should not have had a large influence on the temperature. However, this was not investigated, for example by separate temperature gauges at different depths Laboratory measurements It is not likely that there are errors in the theory, calculations or instrumentation for the TPS method. The theory has been published numerous times in scientific papers and is internationally accepted. The method was used in the Äspö prototype repository by /Sundberg and Gabrielsson, 1999/ and compared with a field method. The results differed by 10% (field values higher), which is lower than the difference in the present investigation. No obvious reason for the difference but it is possible that unobserved small water movements influenced the field measurements. Influence from possible thermal short cuts and non-conductive heat transport is not likely and should have an opposite influence on the measurement results. In earlier investigation on the Äspö diorite /Sundberg and Gabrielsson, 1999/, some core samples contained large grains ( 150 mm) embedded in a fine-grained mass. Laboratory measurements of thermal properties of these and other samples with a similar structure produced similar results. It may be assumed that the variations in grain size of the investigated samples did not influence the results. However, comparisons between different methods are rather rare why it is possible that some kind of systematic errors exist. The porosity is small but has in some cases significant influence on the results, depending on if the porosity is saturated with water or air. Table 6-3 shows the thermal conductivity of 4 samples that were measured at assumed dry and saturated conditions. The differences are about 0 5% at about an average porosity of 0.3%. At porosities less than 1%, a difference of 25% in thermal conductivity has been reported. This shows the importance of the water saturation procedure of the samples before thermal measurements. It is known that core drilling can cause rock stress release and also damages to the core surface during the drilling. This may increase the porosity and thereby result in lower thermal conductivity values in the laboratory compared with the field. In this case, however, the porosity is low and porosity differences cannot explain the differences between the results of different methods. No obvious foliation has been observed for the different samples and it is therefore assumed to have a minor influence on the results. The temperature influence on the estimated thermal conductivity is in general small why the difference in temperature in the field and in the laboratory has a very small influence on the results Theoretical calculations The estimated mineral content of different rock types has been calculated by using point counting in microscopy and chemical analyses. The Äspö diorite is rather coarsegrained which makes the point counting more difficult and it has to be corrected for the geochemical composition. The number of samples examined for each rock type is limited and varies between 1 5, and in addition, within each rock type there are 39
35 different varieties. For example, in earlier studies an altered variety of Äspö diorite has been distinguished with biotite replaced by chlorite, with a higher thermal conductivity as result. Transitional varieties between different rock types are also common. For the evaluation of the thermal conductivity measurements, it is desirable to make comparisons with corresponding mineralogical composition of each sample. This is, however, not always possible due to factors such as the difficulty in point counting of coarse and inhomogeneous rock types. Instead, mineralogical compositions were given for the main rock types. The above mentioned circumstances imply that there are uncertainties in the determined mineral content. However, a comparison between the results based on original and revised rock mapping shows that the difference in thermal conductivity is small. It is also possible that there are errors in the reference values of the thermal conductivity for the different minerals, which were used in the calculations. This is discussed in /Sundberg, 1988/, and is supported by the fact that reference values from different sources sometimes show significant differences. Different samples were used for different types of investigations. Differences between individual samples are thus a source to uncertainties when comparing and evaluating the results. From the above discussion, it is most likely that the mineral content of different samples used in the laboratory and in the calculations, and of the actual rock in the field, account for some of the discrepancies Methodology used for prediction Eleven samples from a 130 m long borehole have been used for both mineralogical determinations and measurements of thermal properties. The samples have been correlated to the drill core by a revised mapping and a predicted thermal conductivity for the whole drill core has been evaluated. This procedure is connected with a number of uncertainties, especially regarding the up scaling of the results from small samples to the whole drill core and the representativity of these samples. However, the results for the different prediction methods are in a narrow interval, see Table 5-5. Furthermore, all of the samples have a thermal conductivity, which is significantly lower than that of the thermal response test. It is also possible, but not likely, that the rock type in the drill core has large differences from the rock mass influenced by the thermal response test. If there is a larger body (than obtained from rock mapping) of, for example, fine-grained granite close to the borehole, the thermal response test would be influenced and generate a somewhat higher thermal conductivity value. 40
36 7 Conclusions and recommendations A large difference in evaluated thermal conductivity exists between different methods, for the rock mass in borehole KA 2599 G01. The full-scale thermal response test resulted in a 25% higher value compared to the prediction, based on different assumptions about rock type distribution and methods to determine the thermal conductivity (calculations or laboratory measurements). Thermal response tests measure an apparent thermal conductivity influenced by specific natural conditions in the field and the measurement itself. In the present case, large hydraulic pressure gradients exist in combination with a certain hydraulic conductivity, which increase the uncertainty of the measurements. For such cases the hydraulic situation should be thoroughly known. Conditions influencing measurements of samples in the laboratory are more easily controlled and observed. However, the up scaling of the results from small samples to the whole drill core and the representativity of these samples can include uncertainties. The most reliable result, due to the discussion above, is the predicted thermal conductivity based on laboratory measurements and revised rock mapping. The resulting thermal properties, corrected to 14 C, for the borehole are 2.85 W/m,K (thermal conductivity) and 2.02 MJ/m 3,K (volumetric heat capacity), based on 55% Äspö diorite, 25% Ävrö granite and 11% fine-grained granite. The influence of the temperature on the thermal conductivity is small for the measured rock types. The measured volumetric heat capacity in the laboratory increased with the temperature, in average 17% (15 22%) within the temperature interval C. There is a clear relation between density and thermal conductivity for the investigated rock types. Higher thermal conductivity was measured in rock types with lower density and vice versa. A comparison between thermal conductivity of the rock mass based on original and revised rock mapping shows that the difference is small (less than 2%). If the rock mass is assumed to consist of unknown rock types and each measurement represents equal parts of the borehole, the difference in thermal conductivity compared with revised mapping is about 4%. This shows that, for the current case, variations in the quality of the rock mapping only have a small influence on the thermal conductivity value. The thermal response test is, in this particular case, assumed to overestimate the thermal conductivity. The reasons may primarily be a combination of water movements in (parts of) the borehole due to high pressure gradients and thermal expansion of the water. The small temperature rise makes the temperature measurements sensitive to different disturbances. The thermal response test gives a large-scale value of the thermal conductivity. For some purposes (design of the repository etc) it is more interesting to know the distribution of conductivities for blocks in the scale of 1 10 m. 41
37 At SKB s site investigations, a program for determination of thermal properties of the rock mass is planned. Preliminary it is recommended to use the TPS method in these investigations. To eliminate possible systematic errors in this method it is recommended to perform comparisons with other laboratory methods. The thermal response test may be used for large-scale measurements of the rock mass if the uncertainties described above can be measured and held under control. 42
38 8 References Berman R G and Brown H, Heat capacity of minerals in the system Na 2 O-K 2 O- CaO-MgO-FeO-Fe 2 O 3 -Al 2 O 3 -SiO 2 -TiO 2 -H 2 O-CO 2 : representation, estimation, and high temperature extrapolation. Contrib. Mineral Petrol., 89, p Gehlin S, Thermal response test. In-situ measurements of thermal properties in hard rock. Luleå University of Technology, 1998:37. Licentiate thesis. Gustafsson S, Transient plane source techniques for thermal conductivity and thermal diffusivity measurements of solid materials. Rev. Sci. Instrum. 62, p American Institute of Physics, USA. Janson, T and Stigsson, M, Test with three different stress measurement methods in two orthogonal boreholes. SKB Technical report R Stockholm, Sweden. Sibbit W L, Dodson J G and Tester J W, Thermal conductivity of crystalline rocks associated with energy extraction from hot dry rock geothermal systems. J. Geophys. Res., 71, p 12. Sundberg J and Gabrielsson A, Laboratory and field measurements of thermal properties of the rocks in the prototype repository at Äspö HRL. SKB HRL, International Progress Report IPR Stockholm, Sweden. Sundberg J, Thermal properties of soils and rocks, Publ. A 57 Dissertation. Department of Geology, Chalmers University of Technology and University of Göteborg, Sweden. Sundberg J, 1991:1. Thermal properties of the rocks on Äspö island. Thermal conductivity, heat capacity, geothermal gradient and heat flow. SKB HRL, Progress Report Stockholm, Sweden. Sundberg J, 1991:2. Thermal properties in soils and rocks, Information 12. (In Swedish). Swedish Geotechnical Institute, Linköping, Sweden. 43
39 Appendix 1 Characterisation of rock types in core KA 2599G01 at the Äspö Hard Rock Laboratory Eva-Lena Tullborg, Terralogica AB, October 2001 Background Drill core KA 2599 G01 from the Äspö Hard Rock Laboratory (ÄHRL) was sampled in order to distinguish rock types present and their mineral content. The core has a total length of m and is drilled vertically from the gallery in ÄHRL at chainage 2599 m. All together eleven samples were selected along the drill core to be representative for the dominating rock types (Table 1). These rock types were earlier mapped and distinguished as Äspö diorite, Fine-grained granite, and Meta-basite. However, during the sampling it was obvious that the term Äspö diorite involved a range of varieties including what has been mapped as Ävrö granite in the Äspö area and hybride rocks (mingled types) between Ävrö granite and Äspö diorite. For the purpose of making an estimate of the distribution of rock types along the bore hole, BIPS-images, chemical analysis, and microscopy were used resulting in a refined mapping as shown in Table 3 below. In order to distinguish the rock types not only by their modal mineral contents but also by their chemistry, the same samples were selected for chemical analysis. This was done in order to check results from point-counting analyses since coarse-grained varieties may result in overestimates of the coarser minerals due to the small area considered in a thin-section. (The chemical analyses were carried out on samples of 6-cm long pieces of the core.) In addition multiple discs (A&B) were cut from the drill cores just close to the samples collected for chemical analyses in order to be used for determination of heat conductivity (the divided-bar method ) and for density and connected porosity measurements. Results from chemical and mineralogical analyses The eleven samples were analysed on major and some trace elements by ICP-AES and SEM-EDS. In addition optically investigations were made using microscope with polarised light. The ICP-AES analyses were carried out at SGAB Analytica in Luleå and the SEM/EDS analyses were carried out at Earth Science Centre, Göteborg University, by Claes Ohlsson who also made the point counting. Results are shown in Appendix 1 and 2. A comparison between point-counting analyses and chemical analyses shows that the point-counting partly yields figures that are not representative to the rocks involved mainly due to large grain sizes compared with the size of the thin sections. In order to overcome this problem an evaluation based on microscopy and chemical analyses were made (Table 2). The samples used for divided-bar measurements were analysed concerning density and water absorption. 45
40 Rock types distinguished Figure 1 (below) shows a plot of SiO 2 versus major elements. There is a clear separation in SiO2 contents among the samples selected. As shown below this separation also characterises the rock types. As expected Fe and Mg (and Ca) rich rocks also show low SiO2 content while K rich rocks show relatively high SiO 2 contents. A good correlation is shown when SiO 2 is plotted versus density as illustrated in Figure 2. The drill core mapping revealed following rock types; a) Äspö quartz-monzodiorite, b) Altered Äspö quartz-monzodiorite, c) Ävrö granite, d) Altered Ävrö granite, e) Fine-grained granite, f) Meta-basite, g) Mingled Ävrö/Äspö. Table 1. Samples from drill core KA 2599 G01 selected for chemical analyses and thin sections. Sampled core interval Rock type 5,9 6,0 A Äspö diorite 14,63 14,73 B Äspö diorite 25,32 25,42 C Äspö diorite 44,36 44,42 D Ävrö granite 50,10 50,20 E Fine-grained granite 61,89 61,99 F Fine-grained granite 70,64 70,74 G Qz-rich Äspö diorite 85,52 85,62 H Oz-rich Äspö diorite 101,85 101,95 I Altered Äspö diorite 120,05 120,15 J Ävrö granite 126,35 126,45 K Ävrö granite Äspö quartz-monzodiorite (ÄQMD): The ÄQMD samples are typically K-feldspar porphyric, reddish-grey to grey quartzmonzodiorites. They have low SiO 2 contents (~58 60%) while those samples showing a SiO 2 content of ~64% were distinguished as quartz rich varieties of ÄQMD. The ÄQMD samples also show a common density of >2.7 g/cm 3 and water absorption of 0.35 to 0.40 vol.-%, which is higher than other rock types analysed. The K-feldspar content recorded in ÄQMD by point-counting is too high if comparison to the potassium content yielded by chemical analyses. This is explained by difficulties in point-counting rocks with porhyric texture (e.g. ÄQMD. Thus, the coarse-grained K-feldspar has been overestimated. An underestimation of plagioclase is also likely for these samples, since what has been calculated as sericite and K-feldspar should partly be referred to plagioclase. 46
41 Altered samples are similar in texture but more reddish in colour, and have a higher content of chlorite and sericite than the unaltered ÄQMD. However, their distribution is subordinate in the investigated drill-core as shown below CaO Fe2O3 K2O LOI MgO MnO2 Na2O P2O5 TiO SiO 2 (weight%) Figure 1. SiO 2 content versus major elements. The contents of Fe 2 O 3, CaO, Na 2 O, MgO, TiO 2 and P 2 O 5 is highest in ÄQMD and decreases over the quartz rich ÄQMD and Ävrö granite to Fine-grained granite, which is lowest in these elements. The opposite is valid for K 2 O and SiO 2. Ävrö granite: The samples distinguished as Äspö granite are typically granitic and aphyric. In Appendix 1, they are represented by three samples and are characterised by a SiO 2 content of 68 71%, a density of g/cm 3 and a relatively low water absorption of vol.-%. Altered samples of this type are very uncommon in the drill-core. Meta-basite: This rock type is subordinate and has not been analysed. Mingled Ävrö/Äspö: This rock type has not been analysed. It is likely that the mineral content and chemistry is roughly a mean of what has been yielded for ÄQMD + Ävrö granite. 47
42 Density kg/m Si0 2 weight% Figure 2. ÄQMD samples show the highest density of all samples and the lowest SiO 2 -content (~58 60%) while quartz-rich varieties of ÄQMD (~64% SiO 2 ) show somewhat lower density. Ävrö granite is lighter and more SiO 2 -rich (~68 71%). The most silica-rich rock type is the Fine-grained granite, which has the highest SiO 2 -content (~71 74%) and the lowest density. Fine-grained granite: These samples are typically reddish and fine-grained. The fine-grained granite shows the highest quartz content of all samples analysed and a high content of K-feldspar. They show a SiO 2 content of ca % and a density of ca g/cm 3. Modal mineral content in rock types distinguished Estimated mineral contents for the different rock types have been calculated using microscopy and considerations taken concerning chemical composition (Table 2). However it must be noted that the mineral composition varies for the specific rock types distinguished and transitional varieties between the rock types are common. 48
43 Table 2. Estimated mineralogical composition and plagioclase composition of rock types. Sample Äspö QMD Ävrö granite Fine-grained granite Altered ÄQMD Number of samples Quartz Plagioclase 40 (An 25 30%) 28 (An 20 30%) 15 (An 20 25%) 25 (An 0 5%) K-feldspar Biotite Chlorite Titanite Amphibole 0.2 Epidote Sericite Opaques Distribution of different rock types in drill core KA 2599 G01 The distribution of the different rock types in drill core KA 2599 G01 has been estimated using the depicted characteristics (Table 3) and re-visitation of the BIPS. This means that the ÄQMD dominates (~54.6 vol.-%) followed by Ävrö granite (~25.1 vol.-%). There are also parts of the core showing mingling between these types (~3.7 vol.%) The Fine-grained granite constitutes 11.0 vol.%, the Meta-basite ~4.3 vol.% and altered ÄQMD ~1 vol.%. A very small portion of altered Ävrö granite constitutes ~0.2 vol.%. 49
44 Table 3. Rocktype distribution along the drill core KA 2599 G01. Rock type/ Percentage of core (%) Äspö QMD (Incl. Quartz-rich varieties) 54.6% Ävrö granite 25.1% Core length (m) ; ; ; ; ; ; ; ; ; ; ; Fine-grained granite 11% ; ; ; ; ; Meta-basite 4.3% ; ; Mingled Äspö/Ävrö 3.7% Altered ÄQMD 1% Altered Ävrö granite 0.2%
45 51 51
46 52
47 Appendix 2 Porosity and density of core samples 53
48 54
Sammanfattning hydraulik
 Sammanfattning hydraulik Bernoullis ekvation Rörelsemängdsekvationen Energiekvation applikationer Rörströmning Friktionskoefficient, Moody s diagram Pumpsystem BERNOULLI S EQUATION 2 p V z H const. Quantity
Viktig information för transmittrar med option /A1 Gold-Plated Diaphragm
 Viktig information för transmittrar med option /A1 Gold-Plated Diaphragm Guldplätering kan aldrig helt stoppa genomträngningen av vätgas, men den får processen att gå långsammare. En tjock guldplätering
Grafisk teknik IMCDP IMCDP IMCDP. IMCDP(filter) Sasan Gooran (HT 2006) Assumptions:
 Sasan Gooran (HT 2006) Assumptions:") IMCDP Grafisk teknik The impact of the placed dot is fed back to the original image by a filter Original Image Binary Image Sasan Gooran (HT 2006) The next dot is placed where the modified image has its
IMCDP Grafisk teknik The impact of the placed dot is fed back to the original image by a filter Original Image Binary Image Sasan Gooran (HT 2006) The next dot is placed where the modified image has its
P Äspö Hard Rock Laboratory. Ground magnetic survey at site for planned facility for calibration of borehole orientation equipment at Äspö
 P-12-10 Äspö Hard Rock Laboratory Ground magnetic survey at site for planned facility for calibration of borehole orientation equipment at Äspö Håkan Mattsson, GeoVista AB January 2012 Svensk Kärnbränslehantering
A study of the performance
 A study of the performance and utilization of the Swedish railway network Anders Lindfeldt Royal Institute of Technology 2011-02-03 Introduction The load on the railway network increases steadily, and
Module 6: Integrals and applications
 Department of Mathematics SF65 Calculus Year 5/6 Module 6: Integrals and applications Sections 6. and 6.5 and Chapter 7 in Calculus by Adams and Essex. Three lectures, two tutorials and one seminar. Important
Grafisk teknik IMCDP. Sasan Gooran (HT 2006) Assumptions:
 Assumptions:") Grafisk teknik Sasan Gooran (HT 2006) Iterative Method Controlling Dot Placement (IMCDP) Assumptions: The original continuous-tone image is scaled between 0 and 1 0 and 1 represent white and black respectively
Grafisk teknik Sasan Gooran (HT 2006) Iterative Method Controlling Dot Placement (IMCDP) Assumptions: The original continuous-tone image is scaled between 0 and 1 0 and 1 represent white and black respectively
Isometries of the plane
 Isometries of the plane Mikael Forsberg August 23, 2011 Abstract Här följer del av ett dokument om Tesselering som jag skrivit för en annan kurs. Denna del handlar om isometrier och innehåller bevis för
Rastercell. Digital Rastrering. AM & FM Raster. Rastercell. AM & FM Raster. Sasan Gooran (VT 2007) Rastrering. Rastercell. Konventionellt, AM
 Rastrering. Rastercell. Konventionellt, AM") Rastercell Digital Rastrering Hybridraster, Rastervinkel, Rotation av digitala bilder, AM/FM rastrering Sasan Gooran (VT 2007) Önskat mått * 2* rastertätheten = inläsningsupplösning originalets mått 2
Rastercell Digital Rastrering Hybridraster, Rastervinkel, Rotation av digitala bilder, AM/FM rastrering Sasan Gooran (VT 2007) Önskat mått * 2* rastertätheten = inläsningsupplösning originalets mått 2
12.6 Heat equation, Wave equation
 12.6 Heat equation, 12.2-3 Wave equation Eugenia Malinnikova, NTNU September 26, 2017 1 Heat equation in higher dimensions The heat equation in higher dimensions (two or three) is u t ( = c 2 2 ) u x 2
Stiftelsen Allmänna Barnhuset KARLSTADS UNIVERSITET
 Stiftelsen Allmänna Barnhuset KARLSTADS UNIVERSITET National Swedish parental studies using the same methodology have been performed in 1980, 2000, 2006 and 2011 (current study). In 1980 and 2000 the studies
Isolda Purchase - EDI
 Isolda Purchase - EDI Document v 1.0 1 Table of Contents Table of Contents... 2 1 Introduction... 3 1.1 What is EDI?... 4 1.2 Sending and receiving documents... 4 1.3 File format... 4 1.3.1 XML (language
Styrteknik: Binära tal, talsystem och koder D3:1
 Styrteknik: Binära tal, talsystem och koder D3:1 Digitala kursmoment D1 Boolesk algebra D2 Grundläggande logiska funktioner D3 Binära tal, talsystem och koder Styrteknik :Binära tal, talsystem och koder
Grafisk teknik. Sasan Gooran (HT 2006)
") Grafisk teknik Sasan Gooran (HT 2006) Iterative Method Controlling Dot Placement (IMCDP) Assumptions: The original continuous-tone image is scaled between 0 and 1 0 and 1 represent white and black respectively
Grafisk teknik Sasan Gooran (HT 2006) Iterative Method Controlling Dot Placement (IMCDP) Assumptions: The original continuous-tone image is scaled between 0 and 1 0 and 1 represent white and black respectively
Why Steam Engine again??
 Småskalig ångteknik för värmeåtervinning inom Stålindustrin med modern ångmotor 1 Why Steam Engine again?? Rankine power cycles is more fuel flexible than any other power cycles but in the small scale
Dokumentnamn Order and safety regulations for Hässleholms Kretsloppscenter. Godkänd/ansvarig Gunilla Holmberg. Kretsloppscenter
 1(5) The speed through the entire area is 30 km/h, unless otherwise indicated. Beware of crossing vehicles! Traffic signs, guardrails and exclusions shall be observed and followed. Smoking is prohibited
A QUEST FOR MISSING PULSARS
 LOFAR A QUEST FOR MISSING PULSARS Samayra Straal Joeri v. Leeuwen WHAT ARE MISSING ~ half of PWN are associated with a pulsar (32/56) PULSARS? less than 25% of all SNRs are associated with a pulsar (60/294)
Beijer Electronics AB 2000, MA00336A, 2000-12
 Demonstration driver English Svenska Beijer Electronics AB 2000, MA00336A, 2000-12 Beijer Electronics AB reserves the right to change information in this manual without prior notice. All examples in this
MÄTNING AV VÄGT REDUKTIONSTAL MEASUREMENT OF THE WEIGHTED SOUND TRANSMISSION LOSS
 Beställare: Roca Industry AB Kontaktperson: Alexander Grinde MÄTIG AV VÄGT REDUKTIOSTAL MEASUREMET OF THE WEIGHTED SOUD TRASMISSIO LOSS Objekt: Glasdörr mm Mätningens utförande och omfattning: Tid för
CHANGE WITH THE BRAIN IN MIND. Frukostseminarium 11 oktober 2018
 CHANGE WITH THE BRAIN IN MIND Frukostseminarium 11 oktober 2018 EGNA FÖRÄNDRINGAR ü Fundera på ett par förändringar du drivit eller varit del av ü De som gått bra och det som gått dåligt. Vi pratar om
SWESIAQ Swedish Chapter of International Society of Indoor Air Quality and Climate
 Swedish Chapter of International Society of Indoor Air Quality and Climate Aneta Wierzbicka Swedish Chapter of International Society of Indoor Air Quality and Climate Independent and non-profit Swedish
Aborter i Sverige 2008 januari juni
 HÄLSA OCH SJUKDOMAR 2008:9 Aborter i Sverige 2008 januari juni Preliminär sammanställning SVERIGES OFFICIELLA STATISTIK Statistik Hälsa och Sjukdomar Aborter i Sverige 2008 januari juni Preliminär sammanställning
The Arctic boundary layer
 The Arctic boundary layer Interactions with the surface, and clouds, as learned from observations (and some modeling) Michael Tjernström Department of Meteorology & the Bert Bolin Center for Climate Research,
Gradientbaserad Optimering,
 Gradientbaserad Optimering, Produktfamiljer och Trinitas Hur att sätta upp ett optimeringsproblem? Vad är lämpliga designvariabler x? Tjockleksvariabler (sizing) Tvärsnittsarean hos stänger Längdmått hos
Parking garage, Gamletull. MDM-piles, pre-installation testing RÄTT FRÅN GRUNDEN!
 Parking garage, Gamletull MDM-piles, pre-installation testing Gamletull, MDM-pålar 1 CPT tests Gamletull, MDM-pålar 2 CPT test results Cone resistance Undrained shear strength Gamletull, MDM-pålar 3 Interpretation
CompactAIR Center Ventilation - Filtrering - Uppvärmning CompactAIR Center Ventilation - Filtration - Heating
 CompactAIR / CompactAIR CompactAIR Center Ventilation - Filtrering - Uppvärmning CompactAIR Center Ventilation - Filtration - Heating Typenschlüssel / Type Code Beteckning / Type code Compact AIR / CompactAIR
SVENSK STANDARD SS-ISO 8779:2010/Amd 1:2014
 SVENSK STANDARD SS-ISO 8779:2010/Amd 1:2014 Fastställd/Approved: 2014-07-04 Publicerad/Published: 2014-07-07 Utgåva/Edition: 1 Språk/Language: engelska/english ICS: 23.040.20; 65.060.35; 83.140.30 Plaströrssystem
Vågkraft. Verification of Numerical Field Model for Permanent Magnet Two Pole Motor. Centrum för förnybar elenergiomvandling
 Vågkraft Verification of Numerical Field Model for Permanent Magnet Two Pole Motor. Avd. För 751 05 Uppsala, Sweden Introduction PhD-student Uppsala University Avd. För Field of Research: Electromagnetic
The Finite Element Method, FHL064
 The Finite Element Method, FHL064 Division of Solid Mechanics Course program, vt2, 20 Course description The finite element method (FEM) is a numerical method able to solve differential equations, i.e.
3 rd October 2017
 3 rd October 2017 Failures of Scaffold False work Failures Form work Bursting Trench Support Failure Hoarding Failures Can be expensive and result in fatalities and serious injuries Cardiff
Adding active and blended learning to an introductory mechanics course
 Adding active and blended learning to an introductory mechanics course Ulf Gran Chalmers, Physics Background Mechanics 1 for Engineering Physics and Engineering Mathematics (SP2/3, 7.5 hp) 200+ students
Measuring void content with GPR Current test with PaveScan and a comparison with traditional GPR systems. Martin Wiström, Ramboll RST
 Measuring void content with GPR Current test with PaveScan and a comparison with traditional GPR systems Martin Wiström, Ramboll RST Hålrum med GPR SBUF-projekt pågår för att utvärdera möjligheterna att
This exam consists of four problems. The maximum sum of points is 20. The marks 3, 4 and 5 require a minimum
 Examiner Linus Carlsson 016-01-07 3 hours In English Exam (TEN) Probability theory and statistical inference MAA137 Aids: Collection of Formulas, Concepts and Tables Pocket calculator This exam consists
NORDIC GRID DISTURBANCE STATISTICS 2012
 NORDIC GRID DISTURBANCE STATISTICS 2012 Utdrag ur rapport utarbetad av DISTAC-gruppen under RGN inom ENTSO-E Sture Holmström 2 Korta bakgrundsfakta > 1999-2000 utarbetades Riktlinjer för klassificering
GERDA Cryostat Rn emanation
 GERDA Cryostat Rn emanation K.T. Knöpfle, B. Schwingenheuer, H. Simgen, G. Zuzel MPI für Kernphysik, Heidelberg General remarks Tolerable rate: ~8 (14) mbq 10-4 cts/(kg kev y) assuming homogenous Rn distribution
Documentation SN 3102
 This document has been created by AHDS History and is based on information supplied by the depositor /////////////////////////////////////////////////////////// THE EUROPEAN STATE FINANCE DATABASE (Director:
Hur fattar samhället beslut när forskarna är oeniga?
 Hur fattar samhället beslut när forskarna är oeniga? Martin Peterson m.peterson@tue.nl www.martinpeterson.org Oenighet om vad? 1.Hårda vetenskapliga fakta? ( X observerades vid tid t ) 1.Den vetenskapliga
Measuring child participation in immunization registries: two national surveys, 2001
 Measuring child participation in immunization registries: two national surveys, 2001 Diana Bartlett Immunization Registry Support Branch National Immunization Program Objectives Describe the progress of
P Oskarshamn site investigation. Formation factor logging in situ by electrical methods in KLX07A, KLX08, KLX10 and KLX12A
 P-6-288 Oskarshamn site investigation Formation factor logging in situ by electrical methods in KLX7A, KLX8, KLX1 and KLX12A Martin Löfgren, Kemakta Konsult AB August 27 Svensk Kärnbränslehantering AB
Utfärdad av Compiled by Tjst Dept. Telefon Telephone Datum Date Utg nr Edition No. Dokumentnummer Document No.
 Utfärdad av Compiled by Tjst Dept. Telefon Telephone David Andersson BUM 733 684 Stämpel/Etikett Security stamp/label ÅTDRAGNINGSMOMENT TIGHTENING TORQUE Granskad av Reviewed by Göran Magnusson Tjst Dept.
SVENSK STANDARD SS-EN ISO 19108:2005/AC:2015
 SVENSK STANDARD SS-EN ISO 19108:2005/AC:2015 Fastställd/Approved: 2015-07-23 Publicerad/Published: 2016-05-24 Utgåva/Edition: 1 Språk/Language: engelska/english ICS: 35.240.70 Geografisk information Modell
STANDARD. UTM Ingegerd Annergren UTMS Lina Orbéus. UTMD Anders Johansson UTMS Jan Sandberg
 1(7) Distribution: Scania, Supplier Presskruvar med rundat huvud - Metrisk gänga med grov delning Innehåll Sida Orientering... 1 Ändringar från föregående utgåva... 1 1 Material och hållfasthet... 1 2
Det idrottsfysiologiska laboratoriet
 Det idrottsfysiologiska laboratoriet en del av RF:s Elitidrottsavdelning Test av prestationsförmåga Träningsråd och FoU Lennart Gullstrand, Med. Dr. Elitidrottskonferensen dec, 2013 Vår personal Vårt uppdrag
Kundfokus Kunden och kundens behov är centrala i alla våra projekt
 D-Miljö AB bidrar till en renare miljö genom projekt där vi hjälper våra kunder att undersöka och sanera förorenad mark och förorenat grundvatten. Vi bistår dig som kund från projektets start till dess
Collaborative Product Development:
 Collaborative Product Development: a Purchasing Strategy for Small Industrialized House-building Companies Opponent: Erik Sandberg, LiU Institutionen för ekonomisk och industriell utveckling Vad är egentligen
Information technology Open Document Format for Office Applications (OpenDocument) v1.0 (ISO/IEC 26300:2006, IDT) SWEDISH STANDARDS INSTITUTE
 v1.0 (ISO/IEC 26300:2006, IDT) SWEDISH STANDARDS INSTITUTE") SVENSK STANDARD SS-ISO/IEC 26300:2008 Fastställd/Approved: 2008-06-17 Publicerad/Published: 2008-08-04 Utgåva/Edition: 1 Språk/Language: engelska/english ICS: 35.240.30 Information technology Open Document
SVENSK STANDARD SS-ISO/IEC 26300:2008 Fastställd/Approved: 2008-06-17 Publicerad/Published: 2008-08-04 Utgåva/Edition: 1 Språk/Language: engelska/english ICS: 35.240.30 Information technology Open Document
Kurskod: TAIU06 MATEMATISK STATISTIK Provkod: TENA 15 August 2016, 8:00-12:00. English Version
 Kurskod: TAIU06 MATEMATISK STATISTIK Provkod: TENA 15 August 2016, 8:00-12:00 Examiner: Xiangfeng Yang (Tel: 070 0896661). Please answer in ENGLISH if you can. a. Allowed to use: a calculator, Formelsamling
Kurskod: TAIU06 MATEMATISK STATISTIK Provkod: TENA 31 May 2016, 8:00-12:00. English Version
 Kurskod: TAIU06 MATEMATISK STATISTIK Provkod: TENA 31 May 2016, 8:00-12:00 Examiner: Xiangfeng Yang (Tel: 070 0896661). Please answer in ENGLISH if you can. a. Allowed to use: a calculator, Formelsamling
Signatursida följer/signature page follows
 Styrelsens i Flexenclosure AB (publ) redogörelse enligt 13 kap. 6 och 14 kap. 8 aktiebolagslagen över förslaget till beslut om ökning av aktiekapitalet genom emission av aktier och emission av teckningsoptioner
Bernoullis ekvation Rörelsemängdsekvationen Energiekvation applikationer Rörströmning Friktionskoefficient, Moody s diagram Pumpsystem.
 010-04-6 Sammanfattning Bernoullis ekvation Rörelsemängdsekvationen Energiekvation applikationer Rörströmning Friktionskoefficient, Moody s diagram Pumpsystem BERNOULLI S EQUATION p V z H const. g Quantity
Resultat av den utökade första planeringsövningen inför RRC september 2005
 Resultat av den utökade första planeringsövningen inför RRC-06 23 september 2005 Resultat av utökad första planeringsövning - Tillägg av ytterligare administrativa deklarationer - Variant (av case 4) med
EASA Standardiseringsrapport 2014
 EASA Standardiseringsrapport 2014 Inför EASA Standardiseringsinspektion hösten 2016 Presentatör Johan Brunnberg, Flygteknisk Inspektör & Del-M Koordinator Sjö- och luftfartsavdelningen Enheten för operatörer,
FORSKNINGSKOMMUNIKATION OCH PUBLICERINGS- MÖNSTER INOM UTBILDNINGSVETENSKAP
 FORSKNINGSKOMMUNIKATION OCH PUBLICERINGS- MÖNSTER INOM UTBILDNINGSVETENSKAP En studie av svensk utbildningsvetenskaplig forskning vid tre lärosäten VETENSKAPSRÅDETS RAPPORTSERIE 10:2010 Forskningskommunikation
Manhour analys EASA STI #17214
 Manhour analys EASA STI #17214 Presentatör Johan Brunnberg, Flygteknisk Inspektör & Del-M Koordinator Sjö- och luftfartsavdelningen Operatörsenheten Sektionen för teknisk operation 1 Innehåll Anmärkningen
Profilinformation Flygteknink 2019, Ingo Staack
 Profilinformation 2019 Flygteknik Roland Gårdhagen Ingo Staack Aeronautical Engineering Masterprofil Flygteknik Profilinformation Flygteknink 2019, Ingo Staack 1 2019-03-14 3 Från koncept till prototyp
Har Du frågor angående uppgifterna: kontakta någon av lärarna, vid lektionerna, via e-post eller på deras rum:
 PROJEKTTENTAMEN I FASTA TILLSTÅNDETS FYSIK FYP330, HT2009 Inlämningsuppgifterna ersätter tentamen. Du skall lösa uppgifterna för Ditt ämne. Nödvändig information hämtar Du i bibliotekets samlingar (böcker
SVENSK STANDARD SS-ISO :2010/Amd 1:2010
 SVENSK STANDARD SS-ISO 14839-1:2010/Amd 1:2010 Fastställd/Approved: 2010-11-08 Publicerad/Published: 2010-11-30 Utgåva/Edition: 1 Språk/Language: engelska/english ICS: 01.040.17; 17.160 Vibration och stöt
1. Compute the following matrix: (2 p) 2. Compute the determinant of the following matrix: (2 p)
 2. Compute the determinant of the following matrix: (2 p)") UMEÅ UNIVERSITY Department of Mathematics and Mathematical Statistics Pre-exam in mathematics Linear algebra 2012-02-07 1. Compute the following matrix: (2 p 3 1 2 3 2 2 7 ( 4 3 5 2 2. Compute the determinant
UMEÅ UNIVERSITY Department of Mathematics and Mathematical Statistics Pre-exam in mathematics Linear algebra 2012-02-07 1. Compute the following matrix: (2 p 3 1 2 3 2 2 7 ( 4 3 5 2 2. Compute the determinant
Swedish adaptation of ISO TC 211 Quality principles. Erik Stenborg
 Swedish adaptation of ISO TC 211 Quality principles The subject How to use international standards Linguistic differences Cultural differences Historical differences Conditions ISO 19100 series will become
Country report: Sweden
 Country report: Sweden Anneli Petersson, PhD. Swedish Gas Centre Sweden Statistics for 2006 1.2 TWh produced per year 223 plants 138 municipal sewage treatment plants 60 landfills 3 Industrial wastewater
Hållbar utveckling i kurser lå 16-17
 Hållbar utveckling i kurser lå 16-17 : Jag tillhör akademin / My position is in the School of Jag tillhör akademin / My position is in the School of Humaniora och medier / Humanities and Media Studies
Module 1: Functions, Limits, Continuity
 Department of mathematics SF1625 Calculus 1 Year 2015/2016 Module 1: Functions, Limits, Continuity This module includes Chapter P and 1 from Calculus by Adams and Essex and is taught in three lectures,
KTH MMK JH TENTAMEN I HYDRAULIK OCH PNEUMATIK allmän kurs 2006-12-18 kl 09.00 13.00
 KTH MMK JH TENTAMEN I HYDRAULIK OCH PNEUMATIK allmän kurs 2006-12-18 kl 09.00 13.00 Svaren skall vara läsligt skrivna och så uppställda att lösningen går att följa. När du börjar på en ny uppgift - tag
SVENSK STANDARD SS-ISO 965/2 Första giltighetsdag Utgåva Sida Registrering
 SIS - Standardiseringskommissionen i Sverige Standarden utarbetad av SMS, SVERIGES MEKANSTANDARDISERING SVENSK STANDARD SS-ISO 965/2 Första giltighetsdag Utgåva Sida Registrering 1984-05-20 1 1 (7) SMS
Uttagning för D21E och H21E
 Uttagning för D21E och H21E Anmälan till seniorelitklasserna vid O-Ringen i Kolmården 2019 är öppen fram till och med fredag 19 juli klockan 12.00. 80 deltagare per klass tas ut. En rangordningslista med
Bridging the gap - state-of-the-art testing research, Explanea, and why you should care
 Bridging the gap - state-of-the-art testing research, Explanea, and why you should care Robert Feldt Blekinge Institute of Technology & Chalmers All animations have been excluded in this pdf version! onsdag
Klassificering av brister från internaudit
 Klassificering av brister från internaudit Del-21G seminarium 2015 Jukka Salo Slou Klassificering av brister från internaudit Vid VK har det visat sig att Procedurer för klassificering av brister finns,
x 2 2(x + 2), f(x) = by utilizing the guidance given by asymptotes and stationary points. γ : 8xy x 2 y 3 = 12 x + 3
, f(x) = by utilizing the guidance given by asymptotes and stationary points. γ : 8xy x 2 y 3 = 12 x + 3") MÄLARDALEN UNIVERSITY School of Education, Culture and Communication Department of Applied Mathematics Examiner: Lars-Göran Larsson EXAMINATION IN MATHEMATICS MAA151 Single Variable Calculus, TEN2 Date:
MÄLARDALEN UNIVERSITY School of Education, Culture and Communication Department of Applied Mathematics Examiner: Lars-Göran Larsson EXAMINATION IN MATHEMATICS MAA151 Single Variable Calculus, TEN2 Date:
Tunga metaller / Heavy metals ICH Q3d & Farmakope. Rolf Arndt Cambrex Karlskoga
 Tunga metaller / Heavy metals ICH Q3d & Farmakope Rolf Arndt Cambrex Karlskoga Tunga metaller / Heavy metals Rolf Arndt -Quality Assurance Cambrex Karlskoga - Svenska Farmakopekommitten / Working Party
P Forsmark site investigation
 P-05-21 Forsmark site investigation Comparison of measured EC in selected fractures in boreholes KFM02A, KFM03A and KFM04A from difference flow logging and hydro-geochemical characterization Analysis of
TN LR TT mg/l N b) 2,6-Dimethylphenole
 2,6-Dimethylphenole") TN LR TT 0.5-14 mg/l N b) 2,6-Dimethylphenole 283 Instrument specific information The test can be performed on the following devices. In addition, the required cuvette and the absorption range of the photometer
TN LR TT 0.5-14 mg/l N b) 2,6-Dimethylphenole 283 Instrument specific information The test can be performed on the following devices. In addition, the required cuvette and the absorption range of the photometer
Fatigue Properties in Additive manufactured Titanium & Inconell
 Fatigue Properties in Additive manufactured Titanium & Inconell UTMIS, Jönköping, 6/2-2018 PÄR JOHANNESSON, TORSTEN SJÖGREN Research Institutes of Sweden RISE Safety and Transport Mechanics Research 2015
EBBA2 European Breeding Bird Atlas
 Methodology Sergi Herrando, Verena Keller, Petr Voříšek et al. objectives 1. To document breeding evidence for all bird species at a resolution of 50x50 km 2. To estimate abundance for all bird species
Metodprov för kontroll av svetsmutterförband Kontrollbestämmelse Method test for inspection of joints of weld nut Inspection specification
 Stämpel/Etikett Security stamp/lable Metodprov för kontroll av svetsmutterförband Kontrollbestämmelse Method test for inspection of joints of weld nut Inspection specification Granskad av Reviewed by Göran
Protected areas in Sweden - a Barents perspective
 Protected areas in Sweden - a Barents perspective Olle Höjer Swedish Environmental Protection Agency Naturvårdsverket Swedish Environmental Protection Agency 2013-04-03 1 The fundamental framework for
Image quality Technical/physical aspects
 (Member of IUPESM) Image quality Technical/physical aspects Nationella kvalitetsdokument för digital radiologi AG1 Michael Sandborg och Jalil Bahar Radiofysikavdelningen Linköping 2007-05-10 Requirements
Klimatpåverkan och de stora osäkerheterna - I Pathways bör CO2-reduktion/mål hanteras inom ett osäkerhetsintervall
 Klimatpåverkan och de stora osäkerheterna - I Pathways bör CO2-reduktion/mål hanteras inom ett osäkerhetsintervall Vi måste förstå att: Vårt klimat är ett mycket komplext system Många (av människan påverkade)
Kursplan. EN1088 Engelsk språkdidaktik. 7,5 högskolepoäng, Grundnivå 1. English Language Learning and Teaching
 Kursplan EN1088 Engelsk språkdidaktik 7,5 högskolepoäng, Grundnivå 1 English Language Learning and Teaching 7.5 Higher Education Credits *), First Cycle Level 1 Mål Efter genomgången kurs ska studenten
Högskolan i Skövde (SK, JS) Svensk version Tentamen i matematik
 Svensk version Tentamen i matematik") Högskolan i Skövde (SK, JS) Svensk version Tentamen i matematik Kurs: MA152G Matematisk Analys MA123G Matematisk analys för ingenjörer Tentamensdag: 2012-03-24 kl 14.30-19.30 Hjälpmedel : Inga hjälpmedel
Högskolan i Skövde (SK, JS) Svensk version Tentamen i matematik Kurs: MA152G Matematisk Analys MA123G Matematisk analys för ingenjörer Tentamensdag: 2012-03-24 kl 14.30-19.30 Hjälpmedel : Inga hjälpmedel
Kvalitetskontroller inom immunhematologi Vad är good enough? Erfarenheter från Sverige
 Kvalitetskontroller inom immunhematologi Vad är good enough? Erfarenheter från Sverige Agneta Wikman, överläkare Klinisk immunologi och transfusionsmedicin Karolinska Universitetssjukhuset Stockholm Referenser
IPR Äspö Hard Rock Laboratory. International Progress Report. Äspö Pillar Stability Experiment
 International Progress Report IPR-3-3 Äspö Hard Rock Laboratory Äspö Pillar Stability Experiment Design of heaters and preliminary results from coupled 2D thermo-mechanical modelling Anders Fredriksson
The present situation on the application of ICT in precision agriculture in Sweden
 The present situation on the application of ICT in precision agriculture in Sweden Anna Rydberg & Johanna Olsson JTI Swedish Institute for Agricultural and Environmental Engineering Objective To investigate
INDUKTIV SLINGDETEKTOR INDUCTIVE LOOP DETECTOR
 INDUKTIV SLINGDETEKTOR INDUCTIVE LOOP DETECTOR Slingdetektorn används som ett alternativ till mekaniska gränslägen, momentbrytare eller annat gränsläge i gödselrännor. Detektorn är kopplad till en trådslinga
Pharmacovigilance lagstiftning - PSUR
 Pharmacovigilance lagstiftning - PSUR Karl Mikael Kälkner Tf enhetschef ES1 EUROPAPARLAMENTETS OCH RÅDETS DIREKTIV 2010/84/EU av den 15 december om ändring, när det gäller säkerhetsövervakning av läkemedel,
Om oss DET PERFEKTA KOMPLEMENTET THE PERFECT COMPLETION 04 EN BINZ ÄR PRECIS SÅ BRA SOM DU FÖRVÄNTAR DIG A BINZ IS JUST AS GOOD AS YOU THINK 05
 Om oss Vi på Binz är glada att du är intresserad av vårt support-system för begravningsbilar. Sedan mer än 75 år tillverkar vi specialfordon i Lorch för de flesta olika användningsändamål, och detta enligt
S 1 11, S 2 9 and S 1 + 2S 2 32 E S 1 11, S 2 9 and 33 S 1 + 2S 2 41 D S 1 11, S 2 9 and 42 S 1 + 2S 2 51 C 52 S 1 + 2S 2 60 B 61 S 1 + 2S 2 A
 MÄLARDALEN UNIVERSITY School of Education, Culture and Communication Department of Applied Mathematics Examiner: Lars-Göran Larsson EXAMINATION IN MATHEMATICS MAA151 Single Variable Calculus, TEN Date:
Installation Instructions
 Installation Instructions (Cat. No. 1794-IE8 Series B) This module mounts on a 1794 terminal base unit. 1. Rotate keyswitch (1) on terminal base unit (2) clockwise to position 3 as required for this type
The test can be performed on the following devices. In addition, the required cuvette and the absorption range of the photometer are indicated.
 TN HR TT b) i) 5-140 mg/l N 2,6-Dimethylphenole 284 Instrument specific information The test can be performed on the following devices. In addition, the required cuvette and the absorption range of the
Retention of metals and metalloids in Atleverket treatment wetland Sylvia Waara & Tatsiana Bandaruk
 Retention of metals and metalloids in Atleverket treatment wetland 2003-2012 Sylvia Waara & Tatsiana Bandaruk Landfill leachate is different from effluents discharged from STPs In methanogenic stage Very
Geoenergi REGEOCITIES i Karlstad. Jessica Benson & Oskar Räftegård Karlstad 2014-09-30
 Geoenergi REGEOCITIES i Karlstad Jessica Benson & Oskar Räftegård SP Karlstad 2014-09-30 Grundläggande om geoenergi Byggnadens värmebehov Fastighetsgräns KÖPT ENERGI Användning Återvinning Behov Energiförlust
SVENSK STANDARD SS-ISO 8734
 SIS - Standardiseringskommissionen i Sverige Handläggande organ SMS, SVERIGES MEKANSTANDARDISERING SVENSK STANDARD SS-ISO 8734 Fastställd Utgåva Sida Registering 1992-11-16 1 1 (1+8) SMS reg 27.1128 SIS
Klicka här för att ändra format
 på 1 på Marianne Andrén General Manager marianne.andren@sandviken.se Sandbacka Park Högbovägen 45 SE 811 32 Sandviken Telephone: +46 26 24 21 33 Mobile: +46 70 230 67 41 www.isea.se 2 From the Off e project
Bilaga 5 till rapport 1 (5)
") Bilaga 5 till rapport 1 (5) EEG som stöd för diagnosen total hjärninfarkt hos barn yngre än två år en systematisk litteraturöversikt, rapport 290 (2018) Bilaga 5 Granskningsmallar Instruktion för granskning
Bilaga 5 till rapport 1 (5) EEG som stöd för diagnosen total hjärninfarkt hos barn yngre än två år en systematisk litteraturöversikt, rapport 290 (2018) Bilaga 5 Granskningsmallar Instruktion för granskning
2.1 Installation of driver using Internet Installation of driver from disk... 3
 &RQWHQW,QQHKnOO 0DQXDOÃ(QJOLVKÃ'HPRGULYHU )RUHZRUG Ã,QWURGXFWLRQ Ã,QVWDOOÃDQGÃXSGDWHÃGULYHU 2.1 Installation of driver using Internet... 3 2.2 Installation of driver from disk... 3 Ã&RQQHFWLQJÃWKHÃWHUPLQDOÃWRÃWKHÃ3/&ÃV\VWHP
Vägytans tillstånd, historik och framtid. Johan Lang
 Vägytans tillstånd, historik och framtid Vägytans tillstånd, historik och framtid Johan Lang Vägytemätningar visar tillståndet som trafikanten möter Effekt på trafikant och fordon Vägytans tillstånd Gränsytan
8 < x 1 + x 2 x 3 = 1, x 1 +2x 2 + x 4 = 0, x 1 +2x 3 + x 4 = 2. x 1 2x 12 1A är inverterbar, och bestäm i så fall dess invers.
 MÄLARDALENS HÖGSKOLA Akademin för utbildning, kultur och kommunikation Avdelningen för tillämpad matematik Examinator: Erik Darpö TENTAMEN I MATEMATIK MAA150 Vektoralgebra TEN1 Datum: 9januari2015 Skrivtid:
PFC and EMI filtering
 PFC and EMI filtering Alex Snijder Field Application Engineer Wurth Elektronik Nederland B.V. November 2017 EMC Standards Power Factor Correction Conducted emissions Radiated emissions 2 Overview of standard
P Forsmark site investigation. Hydraulic interference test with borehole HFM33 used as pumping borehole, November of 2007
 P-07-229 Forsmark site investigation Hydraulic interference test with borehole HFM33 used as pumping borehole, November of 2007 Kristoffer Gokall-Norman, Jan-Erik Ludvigson, Geosigma AB May 2008 Svensk
Schenker Privpak AB Telefon VAT Nr. SE Schenker ABs ansvarsbestämmelser, identiska med Box 905 Faxnr Säte: Borås
 Schenker Privpak AB Interface documentation for web service packageservices.asmx 2012-09-01 Version: 1.0.0 Doc. no.: I04304b Sida 2 av 7 Revision history Datum Version Sign. Kommentar 2012-09-01 1.0.0
HYDRAULIK Rörströmning IV
 HYDRAULIK Rörströmning IV Rolf Larsson, Tekn Vattenresurslära För VVR145, 31mars, 2014 NASA/ Astronaut Photography of Earth - Quick View 24 mar VVR015 Hydraulik/ Rörströmning IV 31 mar 2014 / 2 Innehåll