Improved structure for uncertainty analysis in the Swedish Greenhouse Gas Emission Inventory
|
|
|
- Sebastian Hedlund
- för 9 år sedan
- Visningar:
Transkript
1 SMED Report No Improved structure for uncertainty analysis in the Swedish Greenhouse Gas Inventory Tomas Gustafsson, Statistics Sweden Commissioned by the Swedish Environmental Protection Agency

2 Published at: Publisher: Swedish Meteorological and Hydrological Institute Address: SE Norrköping, Sweden Start year: 006 ISSN: SMED is short for Swedish Environmental s Data, which is a collaboration between IVL Swedish Environmental Research Institute, SCB Statistics Sweden, SLU Swedish University of Agricultural Sciences, and SMHI Swedish Meteorological and Hydrological Institute. The work cooperation within SMED commenced during 001 with the long-term aim of acquiring and developing expertise within emission statistics. Through a long-term contract for the Swedish Environmental Protection Agency extending until 014, SMED is heavily involved in all work related to Sweden's inter reporting obligations on to air and water, waste and hazardous substances. A central objective of the SMED collaboration is to develop and operate emission databases and offer related services to clients such as, regional and local governmental authorities, air and water quality management districts, as well as industry. For more information visit SMED's website

3 Summary Uncertainty estimates in greenhouse gas emission inventories is an important element when prioritizing future improvements of the inventory accuracy. IPCC Good Practice Guidance recommends two methods for estimating the uncertainties, Tier 1 and Tier. Sweden has conducted uncertainty estimates for the inventories of submission 004 and 005 according to Tier 1. The emission inventory staff has however identified weaknesses in the background structure as well as lack of transparency in estimated uncertainties. This study aims at improving the quality of the uncertainty estimates in the Swedish inventory by creating a more robust structure of input data and a clear documentation on methods and applied uncertainties. This facilitates easier replication and updating of results as well as internal and external peer reviews of uncertainty estimates. Furthermore, based on the results of the study, tables for uncertainty estimates of 1990 and 004 for presentation in Sweden s National Inventory 006 have been produced. The uncertainty estimates for all source categories together with their rational are documented in Swedish in about thirty Expert Protocols. Most uncertainty estimates are based on expert judgements and IPCC recommendations. Very few measurement data have been available. The IPCC Good Practice Guidance Tier 1 method is used for calculating the uncertainty estimates for the base year 1990 and 004, and the trend for direct greenhouse gases, e.g. CO, CH 4, N O and F-gases. The analysis is done for the sectors Energy, Industrial Processes, Solvent and Other Product Use, Agriculture and Waste. In order to make the analysis of uncertainties easier, the variance contribution is expressed for each source category for activity data, emission factors and emission data, respectively. In the underlying work, source categories have been specified on the level where independency is assumed to exist. When reporting the results in the NIR, however, uncertainties are as far as possible presented on the same aggregation level as the Key Source analysis. The results of the Tier 1 analysis show that the overall inventory uncertainty is estimated to be ±5.8%. The uncertainty in N O from agricultural soils (CRF 4) alone accounts for about 67% of the variance in the inventory. Other major uncertainty contributors are of CH 4 from solid waste (CRF 6A) and of CO from chemicals (CRF 1Ac), accounting for 8.7% and 4.8% respectively of the variance.

4 Content 1 Introduction Aim Scope... 7 Method Tier Uncertainties in trend Expert protocols Estimating uncertainties for each source CRF 1. Stationary combustion CRF 1. Mobile combustion CRF. Industrial processes, CO CRF. Industrial processes, F-gases CRF. Industrial processes, CH 4 and N O CRF 3. Solvent use CRF 4. Agriculture CRF 6. Waste Updating uncertainties for each sector Combining and aggregating uncertainties for all sources and sectors Aggregating uncertainty contribution from AD and EF in stationary and mobile combustion Quality assurance and quality control (QA/QC) procedures Results Uncertainties and variances per CRF sector CRF 1. Stationary combustion CRF 1. Mobile combustion CRF. Industrial processes CRF 3. Solvent and other product use CRF 4. Agriculture CRF 6. Waste Summary of all sectors Uncertainty and variance contribution from different greenhouse gases Uncertainties in trend Analysis and discussion... 35
 procedures... 0 3 Results... 3.1 Uncertainties and variances per CRF sector... 3.1.1 CRF 1. Stationary combustion... 3.1. CRF 1. Mobile combustion.")
5 5 Possible future improvements References... 39

6 6 1 Introduction Increased anthropogenic contribution of greenhouse gases in the atmosphere has affected significant climate change since the beginning of the industrialization. According to the United Nations Framework Convention on Climate Change (UNFCCC) considerable mitigation of greenhouse gases is needed to stabilize the situation (UNFCCC, 199). In order to obtain good overview of the contribution of from human activities, UNFCCC requires the industrialized (Annex 1) countries to submit annual reports on greenhouse gas emission inventories. Countries are required to prepare the inventories pursuant to the IPCC Guidelines 1 (IPCC, 1997) and the IPCC Good Practice Guidance (IPCC, 000). According to the IPCC Good Practice Guidance, inventories should be transparent, consistent, comparable, complete, and accurate and show good confidence in estimates. As a part of the work to prioritize efforts to improve the accuracy of inventories in the future, and guide decisions on methodological choices, the IPCC Good Practice Guidance identifies uncertainty estimates associated with the to be of essential importance. It is therefore important to communicate uncertainty estimates of the overall inventory as well as detailed information by greenhouse gas and source category, in a practical and scientifically defensible way, that enables the results to be interpreted for various applications. Sweden annually reports estimated of greenhouse gases to the UNFCCC. Uncertainty estimates in the Swedish inventory was first introduced in submission 004 (for the reference year 00), where the IPCC Good Practice Guidance Tier 1 methodology was applied. The basis of the uncertainty estimates was to a large extent expert judgements relying on a study from 003 (SMED, 003). During the study it was discovered that appropriate uncertainties on disaggregated source category level were difficult to estimate due to that background data was not naturally organized according to the sector allocation used by the UNFCCC (i.e. Common Format for Reporting - CRF). As a result, vast aggregations of emission uncertainties, especially in the Energy sector, had to be made. That led to difficulties in updating the results when changes in underlying data occurred. The emission inventory staff has furthermore assessed that a more robust structure of input data and clear documentation on methods and uncertainty estimates, would improve the quality and transparency of the Swedish inventory uncertainty estimates, facilitating easier replication and updating of results, as well as enabling internal and external peer reviews of uncertainty estimates. 1.1 Aim The aim of this study is to improve the transparency and quality in the present uncertainty estimates in the Swedish National Greenhouse Gas Inventory, by making documentation and background structures of estimates more consistent and traceable. 1 Revised 1996 IPCC Guidelines for National Greenhouse Gas Inventories IPCC Good Practice Guidance and Uncertainty Management in National Greenhouse Gas Inventories
 and the IPCC Good Practice Guidance (IPCC, 000).")
7 7 Furthermore, based on the results of the study, tables for uncertainty estimates of 1990 and 004 for presentation in Sweden s National Inventory 006 are produced. 1. Scope The uncertainty estimates are performed for the base year 1990 and 004 for direct greenhouse gases, e.g. CO, CH 4, N O and HFCs, PFCs and SF6 (F-gases). The study does not include improvements of single uncertainties, for instance by contacting external experts for better information on uncertainties on different sources. The uncertainty estimates are based on the figures for submission 006. Data for 003 (submission of 005) were used in a preliminary version, since data for 004 were not completed at the time of the construction of the new structure. The uncertainties were then updated with estimates for 004 when those were available. The LULUCF sector, CRF 5, is not included in the study.

8 8 Method IPCC Good Practice Guidance describes two methods for estimating uncertainties in Greenhouse Gas Inventories, Tier 1 and Tier. Tier 1 is a more simplistic method than Tier. Tier includes simulations of uncertainty data and probability density functions by Monte Carlo analysis. In this study, Tier 1 has been applied for estimations of uncertainties in 1990 and 004 as well as uncertainties in the trend The results are included in Sweden s National Inventory 006. In order to facilitate a simple and transparent procedure for updating and reviewing the uncertainties associated with the source category, comprehensive information has been documented in expert protocols. These protocols include information on source category uncertainties as well as information on when and by whom the elicitation has been performed. The uncertainty estimates for each source category are conducted using various information sources as basis. To estimate uncertainties of aggregated source categories as well as the uncertainties of their associated activity data (AD), emission factors (EF) and emission data (EM), respectively, the error propagation equation presented in the IPCC Good Practice Guidance has been applied. As a part of the Swedish Quality System for the Air Inventory (SMED, 005), designated QC-procedures have been incorporated in this project..1 Tier 1 The Tier 1 method aims at providing a simple as well as time efficient procedure of estimating uncertainties associated with activity data, emission factors and direct. Once the uncertainties in the source categories have been determined, they may be combined to provide uncertainty estimates for the entire inventory in any year and the uncertainty in the overall inventory trend over time. The Tier 1 method for combining estimating uncertainty is based on the error propagation equations as presented in the IPCC Good Practice Guidance. Equation 1 is used when uncertainties are combined by multiplication (for example activity data multiplied with emission factors) and Equation is used when uncertainties are combined by addition (for example adding uncertainties of different sources categories or sectors together). Equation 1. U U U... U 1 n Where: U is the percentage uncertainty in the product of the quantities (half the 95% confidence interval divided by the and expressed as a percentage);

9 9 U i are the percentage uncertainties associated with each of the quantities. Equation. U U * x U * x... U * x 1 1 x x 1... x n n Where: U is the percentage uncertainty in the sum of the quantities (half the 95% confidence interval divided by the (i.e. mean) and expressed as a percentage); x i and U i are the uncertainty quantities and the percentage uncertainties associated with them, respectively. The IPCC Good Practice Guidance recommends that uncertainties should be estimated by source category and gas, where source categories can be determined by fuel type, technology, activity data sources, etc. Section 6.3. in the Good Practice Guidance describes rational and formulas together with a template for estimating uncertainties according to Tier 1. The basis of emission estimates in inventories is in many cases activity data and emission factors instead of emission measurement data. In those cases correlation and dependencies between source categories of activity data and emission factors might occur when used for multiple estimates. In the Tier 1 approach, this can be addressed by aggregating source categories to the level where independency can be assumed to exist. It is suggested that uncertainties in AD, EF and EM are estimated on this level of aggregation, since no method is presented on how to estimate aggregated uncertainties for them. In this study however, uncertainties in activity data, emission factors and emission data are estimated on a disaggregated level and methods for aggregating their uncertainties are presented in chapter.5. It is further notable that Tier 1 does not include adjustments for correlation between gases, even though many of them have the same activity data and therefore are correlated. To what extent this reduces the uncertainty in activity data has not been investigated in this study. n.1.1 Uncertainties in trend In addition to the estimated uncertainties associated with the current year s and the base year s, this study also includes a trend analysis. The trend analysis is performed in accordance with the Tier 1 method, taking into account uncertainties introduced into the trend in by activity data and emission factors, respectively, as well as Type A and Type B sensitivities. Type A sensitivity is defined as the percentage differences in the overall between the base year and the current year in response to a one percent increase in source category in both the base year and the current year. Type B sensitivity is defined as the percentage difference in between the base year and the current year in response to a one percent increase in the source category in the current year only.

10 10 The formulas presented for Tier 1 in the IPCC Good Practice Guidance regarding trend assessment only takes into consideration the uncertainties introduced into the trend in by activity data and emission factors. In this study, some uncertainty estimates derive from emission data. It has been assumed that those uncertainties may be calculated as contributions to uncertainties in emission trends due to activity data. The results from the trend analysis are presented in chapter Expert protocols Quantified uncertainties (%) of all elements (AD, EF and EM) in the inventory have been documented in Swedish in Expert Protocols as given in Figure 1. In the protocols, specially designed to be in compliance with the recommendations in the IPCC Good Practice Guidance chapter 6..5 (IPCC, 000), information is provided on estimated uncertainties (i.e. CRF codes concerned, years, type of AD, EF or EM etc), the value or range of the estimated uncertainty, explanations on the reasons behind the given values, name and qualification of the expert etc. All expert protocols are given a reference number and gathered in one Excel file. In, there are about thirty expert protocols documenting uncertainties in the Swedish GHG Inventory of submission 006. This transparent documentation will enable replicating of results and facilitate updating of uncertainties when something in the inventory changes in the future.

11 11 Reference number: 1 External review by: NN, 00x-xx-xx Date: Result of external review: approved/not approved Expert: NN (references to other material if necessary) Kvalifications: eg working several years with this sector of the GHG inventory Approved by SEPA: NN, 00x-xx-xx Documented by: NN (expert or other person) Responsible authority according to Name of authority National system: Estimated uncertainties: Activity probability Foot- Year CRF Activity data factor s most likely value minimum 1 maximum 1 distribution note 004 1A1a domestic heating oil m3 according to indata -% % normal A1a domestic heating oil CO 73, triangular Petroleum coke tonne x 1 limits for 95% confidence interval, that is,5% risk that the true value is below minimum and,5% risk that the true value is above maximum. probability distribution should be given only when known Basis for expert judgement including logic and scientifical reasons and references to other relevant material: 1) ) x) Figure 1. Design of Expert protocols.

12 1.3 Estimating uncertainties for each source Data in this study has been divided into seven sectors according to how the inventory work is organized (stationary combustion, mobile combustion, CO from industrial processes, of F-gases, other from industrial processes and solvent and other products use, agriculture and, finally, waste). Work with uncertainty estimates is performed in one Excel file with one spreadsheet for each of the seven sectors. Every sector has, by those in the inventory staff with the most expertise on each sector, been divided into sources, according to where independencies between sources were assumed to exist. Each source was evaluated regarding uncertainties (%) on activity data (AD), emission factors (EF), or direct emission data (EM). When estimating uncertainties for each source, a wide range of information has been used. IPCC recommendations have been applied as well as expert judgements based on fluctuations in time series, information from single industrial plants, comparisons with other sources, studies of statistical differences and studies of reports, that are the basis for instance for many emission factors. In chapters , some comments are given on how the work was conducted for each sector. In the previous uncertainty analysis of submission 005, uncertainty estimates for stationary combustion and mobile combustion were to a large extent grouped together due to dependencies in underlying activity data. For example, fuel consumption in CRF 1A3, 1A4 and 1A5 were assumed to derive from the same statistical survey on delivered fuels, and thus uncertainties for those sectors were aggregated per greenhouse gas. During 005, SMED performed a study investigating the sources of different fuels in the Energy statistics and how they were applied in the air emission inventory (Gustafsson et al., 005). Based on results from the study, it is assumed that independency between activity data for stationary combustion and mobile combustion can be approximated. There are however very small amounts of diesel used in stationary combustion, which correlate to the diesel used in mobile combustion. In this study, no correction has been made to compensate for this correlation..3.1 CRF 1. Stationary combustion Most of the estimates of from stationary fuel combustion derive from activity data and emission factors. The activity data on fuel consumption has been assumed to be uncorrelated between the CRF sectors. This assumption is based on the structure of underlying data. The vast majority of the activity data originate from the Energy statistics, produced by Statistics Sweden. The Energy statistics is collected through stratified sample surveys and then enumerated on line of business. In addition, some activity data and emission factors are collected through direct contacts with companies. The uncertainties in activity data are estimated for each year, fuel type and CRF sector, whereas the uncertainties in emission factors are estimated for each greenhouse gas, year, fuel type and CRF sector. The uncertainties associated with activity data and emission factors for stationary combustion sources are considered to be constant over the years, with the exception of 1

13 13 flaring of gas and combustion of peat, where the activity data sources are documented to have higher uncertainties in the base year compared to the latest year. Several expert elicitations of activity data have been performed involving personnel from the Energy statistics at Statistics Sweden as well as experts from the Petroleum industry. In other cases, studies of statistical differences, fluctuations in time series, and comparison with company data, are the basis for expert judgements carried out by the inventory staff. The uncertainties associated with emission factors mainly derive from expert judgements using SMED reports and default values from the IPCC guidelines as the main basis. In some cases no referenced information was available, and thus rough expert judgements had to be made..3. CRF 1. Mobile combustion Most of the estimated from mobile fuel combustion derive from activity data and emission factors. In the cases of CH 4 and N O from road traffic (CRF 1A3b), however, derive from modelled data and are implemented in the inventory as direct emission data (EM) on aggregated level. The activity data on fuel consumption derives from statistics on fuel deliveries. Correlation therefore exists between the different CRF sectors when the fuel is allocated. Uncertainties in activity data are thus estimated on an aggregated level for each year and fuel type. The uncertainties in emission factors of CO are estimated by fuel type, whereas uncertainties in emission factors for CH 4 and N O are estimated by fuel type and CRF sector, e.g. CH 4 for gasoline in CRF 1A3e. In order to match uncertainties in activity data, weighted uncertainties associated with emission factors for CH 4 and N O are calculated on the same aggregated level. This was performed applying the equation for AU EF described in chapter.5. In the cases of CH 4 and N O from road traffic (CRF 1A3b), uncertainties are assigned to the emission model output. The uncertainty estimates are mostly based on SMED reports and expert judgement, but in a few cases IPCC and CORINAIR default recommendations have been applied. Uncertainties in activity data, emission factors and actual for mobile combustion sources are set to be the same 1990 as CRF. Industrial processes, CO CO emission estimates for the industrial processes in the inventory derive from activity data and factors as well as information on estimated and measured data on from single industrial plants. 13

14 14 The activity data is largely based on information from companies, collected via telephone or . In some cases, data from the Energy statistics has been used. The emission factors are based on IPCC defaults or values. In a number of cases, the companies have provided information on emission estimates or measurements. When applying uncertainties on activity data and emission factors, they have first been aggregated on source categories, i.e. CRF A1, A, etc. Thereafter, uncertainties have been assigned by expert judgement. Generally ±5 % has been assigned due to the lack of other indications or relevant information affecting the uncertainty. The uncertainties in the estimates of of CO from industrial processes are considered to have decreased over time..3.4 CRF. Industrial processes, F-gases All emission estimates of F-gases in the industrial processes sector derive from activity data and emission factors, except from the source category aluminum production (CRF C3), where information on PFC are collected from the companies' legal environmental reports. The activity data for most sources in CRF F1, refrigeration and air conditioning equipment, is based on statistics. The uncertainty was assigned in cooperation with the Swedish Chemicals Inspectorate. Other activity data is obtained directly from producers or consumers, and the uncertainty was discussed with relevant persons, if possible. The emission factors are IPCC default, country specific, obtained from producers/consumers or from discussions with experts. The uncertainty in emission factors is to a large extent based on expert judgement. The uncertainty in of PFC in CRF C3 is based on IPCC recommendations. The uncertainties in F-gases from the industrial processes are considered to be constant over time..3.5 CRF. Industrial processes, CH 4 and N O Most emission estimates of CH 4 and N O in the industrial processes sector derive from information collected from the companies' legal environmental reports. In the case of CH 4 and N O from pulp and paper production (CRF G), activity data and factors are used for estimations. For nitric acid production (CRF B) the uncertainty estimates were obtained from producers. For other sources, expert judgement or suggested uncertainties from IPCC Guidelines and IPCC Good Practice Guidance were used, if available. In estimating uncertainties by expert judgement for some sources, Environmental reports from comparable facilities were used as a basis for estimating reasonable uncertainty levels. The uncertainties in CH 4 and N O from the industrial processes are considered to be constant over time. 14

15 CRF 3. Solvent use s from solvent use derive from activity data and emission factors. The activity data are obtained from statistics at the Swedish Chemicals Inspectorate. The uncertainty estimates were discussed and assigned in cooperation with experts at the Swedish Chemicals Inspectorate. The uncertainty estimates for the country specific emission factors used were estimated by expert judgement. The uncertainties in from solvent use are considered to be constant over time..3.7 CRF 4. Agriculture s from agriculture are derived through models applying various activity data and factors. The uncertainty estimates generally derive from the same sources as the activity data and emission factors, respectively, for instance the IPCC or ly referenced data. When no uncertainty estimates were available, estimates from similar statistics were used instead. When neither uncertainty estimates nor any similar statistics were available, rough expert judgements had to be made. Uncertainty estimates are assigned on an aggregated level very similar to the one presented in the NIR. The uncertainties in from agriculture are considered to be constant over time..3.8 CRF 6. Waste s from waste are derived through models applying various activity data and factors. The uncertainty estimates are collected from IPCC (for emission factors) and IPCC combined with expert judgment (for activity data). The uncertainty estimates are to a large extent assigned on the CRF sector (e.g. 6A, Solid waste). The uncertainties in from waste are considered to be constant over time, except for the cases of activity data in Solid waste (CRF 6A), where the uncertainty is considered to be higher in 1990 than Updating uncertainties for each sector Figure gives an example on how input data is given for estimating uncertainties for a single sector. In the sectoral spreadsheets, there is one row for each source, responding to where independency between sources is assumed to exist. For each source, may be derived either from activity data and emission factors or information on actual emission data from companies or models. The first section (green colour) includes information on reference year, IPCC source category, GHG, description of activity data (if relevant), quantified activity data and. The green data should be updated each submission. 15

16 16 The second section (yellow colour) includes information on uncertainty estimates for activity data and emission factors, and emission data in those cases only estimated are available. As required by the IPCC Good Practice Guidance, quality indicators are given for activity data and each GHG factor (D - IPCC default, M - Measurement based, R - National referenced data). The expert judgement reference number(s) refer to what expert protocol(s) are used for this source. The footnote reference number(s) refer to additional information in a footnote spreadsheet, for instance if a choice has been made between two different expert protocols concerning the same source and the rational behind the choice. The yellow data should be overhauled each submission, to make sure that they are correctly linked to the corresponding green data. Yellow data are updated when better information is available, for instance if new studies on emission factors have been conducted and thus it has been possible to fill in better expert protocols. 16
 refer to additional information in a footnote spreadsheet, for instance if a choice has been made between two different expert protocols concerning the same source")

17 17 Figure. Example of design of sectoral uncertainty estimates; CRF. Industrial Processes CO. 17

18 18.5 Combining and aggregating uncertainties for all sources and sectors This section describes how the error propagation equations, Equation 1 and, have been used to estimate uncertainties for different purposes. s in CO -equivalents (E) from all sources and all greenhouse gases are summarized into (T). For each source, the uncertainties associated with activity data (U AD ) and emission factors (U EF ), respectively, are estimated and given in percents. The combined uncertainty (CU) in activity data and emission factors the uncertainty in the reported from each source is calculated as: CU U AD U EF In some cases, uncertainties for direct emission data (U EM ) are used instead of uncertainties for activity data and emission factors. In those cases the combined uncertainty is equal to the uncertainty for the direct : CU U EM The uncertainties are as far as possible presented on the same aggregation level as the present Key Source analysis in the Swedish inventory. The purpose is to facilitate combined use of the two analyses, since both aim at showing what parts of the inventory are especially important and/or weak. This is very important information when planning future inventories and, above all, when using and evaluating the inventory results. However, no direct combination of the two analyses has yet been preformed. The combined uncertainty for each aggregated source category (CU AD, EF, EM ) is calculated using Equation. Combined uncertainty for (aggregated) source categories show the 95% confidence interval associated with the estimated (aggregated) emission quantity. For example, if in a source category are 1,800 Gg CO equivalents with an associated combined uncertainty of ±50%, this gives a 95% confidence interval range of 900,700 Gg CO equivalents. Combined uncertainty as a percentage of for all gases (CU%) is calculated for each source category as: CU * E CU % T The CU% for a source category can be interpreted as the uncertainty in the given that no uncertainty exists in any other source categories. 18
 in activity data and emission factors the uncertainty in the reported from each source is calculated as: CU U AD U EF In some cases, uncertainties for direct emission")
19 19 Deriving from equation CU%, the percentage uncertainty contribution in the (U%) for each greenhouse gas (or different sectors), and the percentage uncertainty for all greenhouse gases together are calculated as: U% CO CU % CO U% CH 4 CU % CH4 U % N O CU % U % F gases N O F gases CU % U% All All CU % Please note that with this method, the percentage uncertainty in will be lower than the sum of the percentage uncertainty contribution in for each greenhouse gas. In this study we have chosen to use the term variance as a means to simplify the analysis and interpretation of uncertainties in the inventory. Using the variance enables calculations of the contribution to the uncertainty in the inventory from each element (AD, EF or EM) and source category. Hence, it will enable decision makers to pinpoint more precise where measures should be taken. Statistical variance is normally used as a measure of how spread out a distribution is. It is the square of the standard deviation. Here the variance in the (VAR ) is calculated as: VAR U% All The percentage contribution to the variance in the from activity data, emission factors and emission data respectively from each source category is then calculated in 3 steps: 1. For each element and source category, the uncertainty as percentage of for all gases (AD%, EF% and EM%) is calculated as: E AD% U AD, T E EF % U EF, T EM % U EM E T. For each element and source category, the contribution to variance in is calculated as: VAR AD AD%, VAR EF EF %, VAR EM EM % 19

20 0 3. For each element and source category, the contribution as percentage of variance in is calculated as: VAR VAR AD % AD, VAR VAR VAR EF % EF, VAR VAR% EM VAR VAR EM.5.1 Aggregating uncertainty contribution from AD and EF in stationary and mobile combustion In the stationary combustion and mobile combustion sectors, aggregations of uncertainty contributions to stemming from activity data and emission factors are calculated to simplify the procedure of estimating the overall uncertainties. In the case of the mobile sector, the correlation in activity data on fuel type level calls for adjustments of the uncertainties estimated for emission factors. In the stationary combustion sector, activity data is assumed to be uncorrelated between fuel types and disaggregated CRF sectors (e.g. 1A1a), resulting in vast number of source categories. In order to make the uncertainty analysis more comprehensible, aggregation of activity data and emission factors are calculated per greenhouse gas and disaggregated CRF sector. The aggregated uncertainty contributions 3 stemming from AD and EFs in stationary combustion and mobile combustion are calculated applying Equation. U is now representing the aggregated uncertainty contribution stemming from AD and EFs to the uncertainty in the aggregated and are expressed as aggregated uncertainties (AU AD and AU EF ). The uncertainty contribution for activity data (AU AD ) and emission factors (AU EF ) respectively are calculated, using the following formulas: AU AD E* U E AD AU EF E* U E EF Where E in this case represents the deriving from AD*EF..6 Quality assurance and quality control (QA/QC) procedures The Swedish National System 4 regulates the emission inventory submitted to the European Commission and to the UNFCCC. As part of the system, SMED has developed a Quality 3 An uncertainty contribution in e.g. activity data should be interpreted as the percentage uncertainty in the emission, provided that no uncertainty exists in the emission factors. Note that the sum of the percentage uncertainty in activity data and emission factors will be higher than the uncertainty in of the aggregated sources. 4 Nationella systemet för inventering och rapportering enligt Kyotoprotokollet och tillhörande beslut inom EU, Naturvårdsverket 004 0

21 1 System in accordance with the IPCC Good Practice Guidance (SMED, 005). The Quality System includes general and specific QA/QC procedures. The specified QC procedures for uncertainty estimates include the following checks: Review of new information in internal documentation (uncertainty parts in QC checklist and work documentation) Changes that may influence uncertainty estimates Uncertainties estimated Uncertainty estimates calculated correctly Internal review of uncertainty document As part of the QA, the SMED co-ordinator carries out an internal audit at the end of the work process before submitting the results to the Swedish EPA. In addition to the SMED internal QA/QC procedures, the National System includes QA by third party. In time of the emission inventory of submission 006, the QA by third party will not be fully implemented in Sweden. The transparent and traceable documentation of uncertainty estimates carried out in this study, however, enables future third party QA. 1
22 3 Results This chapter describes the results of the Tier 1 uncertainty analysis of the Swedish emission inventory years 1990 and 004. In order to make the most use of the data, the uncertainties and variances are presented on various aggregation levels and combinations: by CRF sector, greenhouse gas, contributing elements (i.e. AD, EF and EM) and on the overall estimates. Furthermore, comparisons are made (if possible) with the previous year s results. At the end of the chapter results from the trend uncertainty analysis are presented. It has only been performed on the The estimated uncertainties for all source categories 1990 and 004 as presented in the Swedish National Inventory Report of submission 006 are presented in Appendix Uncertainties and variances per CRF sector The uncertainties and variances for the CRF sectors are presented in Table 1-6, where the results are ranked according to their individual contribution to the uncertainty in the in 004. The ranking takes into account both the quantity of and their associated combined uncertainties. Hence, source categories can be highly ranked even though uncertainties are relatively low if the emission quantities at the same time are high or vice versa. Comments are given to the largest contributors in each sector and in some cases where the combined uncertainties are considerably high. Each table also includes the sector s contribution to the overall uncertainty and variance in the inventory 004. Note that the uncertainty estimates for industrial processes (CRF ) are presented together for all gases even though the work with estimating their uncertainties are divided on gases; of CO, CH 4 and N O, and F-gases. The purpose is to make the results from different CRF sectors more comprehendible. References to relevant expert protocol are given in brackets []. At the end of the chapter, a summary of uncertainty estimates and variances from all sectors are presented in Table CRF 1. Stationary combustion The uncertainty estimates within the stationary combustion sector in this study are assumed to be independent between greenhouse gases, CRF sectors and fuel types. In that accounts for 11 source categories in 004. In order to simplify the analysis, aggregations per gas and CRF sector are made. This results in 45 source categories. Table 1 shows the ten largest uncertainty contributors of these on the emission uncertainty in 004. The largest contributor is of CO from the chemical industry (CRF 1Ac). It has a combined uncertainty of 1.3% of the. The source category has a high uncertainty associated with emission factors, contributing with 4.7% to the variance. The high uncertainties in emission factors are due to large usage of other petroleum products and other non-specified fuels. None of the fuels have referenced
23 3 information available regarding uncertainties in emission factors and thus rough expert judgements are applied, resulting in ±100% for each fuel type [16]. s of CO from public electricity and heat production (CRF 1A1a) have the second highest rank within the stationary combustion sector. The source category has relatively low combined uncertainty but instead it contributes with a large share of the emission quantities. Again, the contribution to variance is biggest in emission factors compared to activity data, accounting for.9% of the variance. The third largest contributor in the sector is of CO from residential (CRF 1A4b). For this source category, the uncertainty in activity data contributes with 1.4% to the variance. It is derived using the statistical differences in the energy statistics as a basis for expert judgement [7]. In addition, allocation of fuels in the other sector (CRF 1A4) is in general uncertain. There are large uncertainties in activity data for of CO from flaring of gas (CRF 1B1c) contributing with 0.59% to the variance. The activity data time series were revised for submission 006 and uncertainties are based on comparisons with old time series [6]. All in all, the whole stationary combustion sector accounts for Gg CO equivalents in 004 with an associated uncertainty of ±4.9%, mostly deriving from uncertainty in factors. The emission factors account for an 8.% contribution to the variance in. Stationary combustion has a combined uncertainty of 1.9% of the. Table 1. The ten largest contributors of uncertainty in the stationary combustion sector and the contribution from the sector to the overall uncertainty in the inventory 004 C RF 1A c 1A 1a 1A 4b 1B 1c 1A f 1A 1b 1A 4b IPCC source category Chemicals Public electricity and Heat production Residential Flaring of gas Other Manufacturing Industries and Construction Petroleum Refining Residential Combine d uncertaint y as % of emission s in year 004, % Activity data contributio n to variance in in 004, % factor contributio n to variance in in 004, % contributio n to variance in in 004, % G as Emissio ns 004 Gg CO eq Combine d uncertain ty, % C O C O C O * 1.45 C O C O C O C H *
24 4 1A 4a 1A 1a 1A 4c Commercial/ Institutional Public electricity and Heat production Agriculture/Forestr y/ Fisheries Stationary combustion 4 C O * 0.09 N O * C O * 0.0 Al l * <0.005 Note that the contribution to variance in also includes 0.003% from emission data. The documentation of how uncertainties in all source categories in stationary combustion have been assessed and their rational are given in Swedish in expert protocols 1,, 4, 5, 6, 7, 9, 16, 19, 8, 9 and 30 (Appendix ). In submission 005, uncertainty estimates for the stationary combustion sector was highly aggregated. This made comparisons of uncertainties per gas possible only for CRF 1A1a, 1A1b, 1Ad and 1B. The uncertainty estimates for of CO from CRF 1A1a, CH 4 from CRF 1A1b and all gases from CRF 1B show higher values in this study compared to submission 005 values. For the other comparisons, the submission 005 values are higher CRF 1. Mobile combustion There are 3 source categories within the mobile combustion, where independency between sources has been assumed in this study. Table shows the ten source categories in the sector with the largest contribution to the emission uncertainty in 004. s of CO from combustion of gasoline and diesel are ranked as the two largest contributions to the overall uncertainty. They both have relatively low combined uncertainties, but contribute with large shares of the emission quantities. For of CO from gasoline, emission factors are more uncertain than activity data, contributing with 1.4% and 0.80% respectively to variance in. For emission of CO from diesel, activity data stands for 1.6% of variance, whereas emission factors stand for less, 0.57%. s of N O from combustion of diesel, excluding the use in road transportation (CRF 1A3b), account for the third largest contribution within the mobile sector to the overall uncertainty. This is mainly due to high uncertainty in factors for off road vehicles and other machinery (±00%), which stands for a large share of the source category s [8]. For this source category, uncertainty in emission factors stands for almost all contribution to the variance (1.7%). s of N O from road traffic (CRF 1A3b) are estimated through modelling. Uncertainties associated with the model output are estimated using the IPCC recommendations on uncertainties in factors for road transportation as guidance [10]. The mobile sector contributes with Gg CO equivalents with the associated uncertainty of ±4.% in 004. The mobile sector has a combined uncertainty of 1.5% of 4
25 5 the, which equals 6.% of variance. The uncertainties deriving from emission factors contribute with the majority of the variance in the sector. The documentation of how uncertainties in all source categories in mobile combustion have been assessed and their rational are given in Swedish in the expert protocols 3, 8, 10, 1, 13, 14, 15 and 0 (Appendix ). The uncertainty estimates for mobile combustion in the Swedish emission inventory of submission 005 were aggregated per greenhouse gas combined with sources of stationary combustion, due to dependencies in activity data. It is therefore not possible to make pairwise comparisons of the results in this study. Table. The ten largest contributors of uncertainty in the mobile combustion sector and the contribution from the sector to the overall uncertainty in the inventory year 004 IPCC source category 1A Mobile combustio n: Gasoline 1A Mobile combustio n: Diesel 1A Mobile combustio n (excluding 1A3b): Diesel 1A3a, 1A5b: Jet Kerosene 1A3b: Gasoline 1A3d: Heavy fuel oil 1A3d: Domestic heating oil 1A3b: Diesel 1A3a, 1A5b: Jet Kerosene 1A Mobile combustio n (excluding 1A3b): Gasoline 1A Mobile combustio n: All fuels * <0.005 Combine d uncertai nty as % of emission s in year 004, % Activity data contributi on to variance in in 004, % factor contribution to variance in in 004, % data contribution to variance in in 004, % contributi on to variance in in 004, % G as Emissio ns 004 Gg CO eq Combine d uncertain ty, % C O C O N O * C O N O C O * 0.01 C O * 0.01 N O * * * N O * * * C H * * * Al l
26 CRF. Industrial processes s from industrial processes constitute in this study 38 uncorrelated source categories. The ten source categories with the largest effect on the overall uncertainty in 004 are presented in Table 3. of HFC from other refrigeration (CRF F1) contributes with largest uncertainty to the uncertainty in 004 from this sector (±0.%). The source category stands for a relatively small emission quantity, but has high uncertainty associated with especially the emission factors, which contribute with 0.1% to the variance. The uncertainties in activity data and emission factors are estimated by expert judgement based on direct and indirect sources of information [7]. The second ranked source category is of CO from iron and steel production (CRF C1), which is assumed to be a relativity good emission approximation, but due to large emission quantities has a high effect on the overall uncertainty in 004. The source category stands for 0.08% of the variance in. s of HFC from mobile air conditioning in passenger cars (CRF F1) have a estimated combined uncertainty of ±41%, which mainly derives from uncertainties in emission factors. The uncertainty is estimated by expert judgement based on direct and indirect sources of information [7]. Notable in this sector is the high combined uncertainty (±15%) in of N O from other chemical industry (CRF B5). It is based on expert judgement assuming that there exist large omissions for this source category []. All in all, from industrial processes account for Gg CO equivalents with an associated uncertainty of ±4.1% in 004. The uncertainty in factors is larger than in activity data and emission data. s from industrial processes have a combined uncertainty of 0.36% of the, or 0.39% of variance. The documentation of how uncertainties in all source categories in industrial processes have been assessed and their rationale are given in Swedish in the expert protocols 1, 4, 11, 1,, 3, 6 and 7 (Appendix ). Table 3. The ten largest contributors of uncertainty in the industrial processes sector and the contribution from the sector to the overall uncertainty in the inventory year 004 CR F F 1 C 1 F 1 IPCC source category Other refrigerati on Iron and steel production Mobile air conditioni ng, passenger cars Combine d uncertai nty as % of emission s in year 004, % Activity data contributi on to variance in in 004, % factor contribution to variance in in 004, % data contributi on to variance in in 004, % contributi on to variance in in 004, % G as Emissio ns 004 Gg CO eq Combine d uncertain ty, % H F C C O H F C *
27 7 C 3 A 1 A B B 5 F C 5 All * <0.005 Aluminium production Cement production Lime production Nitric acid production Other chemical industry Foam blowing, XPS Other metal production P F C * C O * C O * * 0.01 N O * * * N O * * H F C * * * C O * * * Al l The comparisons of uncertainty estimates of the results in this study with estimates of the 005 submission show similar values for of CO for source categories in CRF A and B, but somewhat higher estimates in CRF C. Comparisons of uncertainty estimates in single source categories for of CH 4 and N O from CRF are not possible, but on the overall level, uncertainty estimates in this study are higher for of CH 4 and lower for N O. The uncertainty estimates associated with F-gases from CRF F in this study are higher than the results from submission 005. For the source categories in CRF C, the same estimate is assumed for of PFC, while of SF6 show higher uncertainties in this study CRF 3. Solvent and other product use This sector only contains two source categories, separated on of CO and N O. Table 4 shows their estimated uncertainties associated with the and variance contributions from the different elements. The documentation of how uncertainties in all source categories in solvent and other product use have been assessed and their rational are given in Swedish in expert protocol 4 (Appendix ). The combined uncertainty in CO from solvent and other product use (CRF 3) is estimated to be ±5%. The uncertainty in activity data is estimated in cooperation with the Swedish Chemicals Inspectorate, whereas the uncertainty in emission factors is based on expert judgement. All in all, the sector accounts for only 84 Gg CO equivalents with an associated uncertainty of ±14.1%. For the emission in 004, that constitutes a combined uncertainty of 0.06%, or 0.01% contribution to variance. 7
28 8 Table 4. The two contributors of uncertainty in the solvent and other product use sector and the contribution from the sector to the overall uncertainty in the inventory year 004 CRF 3 IPCC source category Solvent and other product use Other, use of NO Gas Emissio ns 004 Gg CO eq Combined uncertainty, % Combined uncertainty as % of in year 004, % Activity data contributi on to variance in in 004, % factor contribution to variance in in 004, % contributi on to variance in in 004, % CO * * 0.01 N O * * * 3D 3 All All * * 0.01 * <0.005 Totals may not sum due to individual rounding. Compared to uncertainty estimates in submission 005, results in this study are lower for both source categories CRF 4. Agriculture The documentation of how uncertainties in all source categories in agriculture have been assessed and their rationale are given in Swedish in expert protocol 17 (Appendix ). s estimated in the agriculture sector are to a large extent correlated in activity data. Associated uncertainties are therefore assigned on a rather aggregated level, resulting in 5 source categories (Table 5). s of N O from agriculture soils is the source category in this sector and in the whole inventory contributing the most to the overall uncertainty in 004, with a combined uncertainty of 4.8% of the. The source category accounts for relatively large emission quantities and at the same time large combined uncertainty (±87%). This means that the source category is contributing with 67.1% to the variance, deriving mainly from uncertainties in emission factors (63.6%). The uncertainty in factors is estimated by expert judgement using information on several emission factors. The most significant emission factor has an estimated uncertainty of ±80%, whereas the other emission factors are associated with higher uncertainties. Ranked as number two is of CH 4 from enteric fermentation (CRF 4A) with a combined uncertainty of 1.0% of the emission in 004. The source category contributes with high emission quantities and has an estimated combined uncertainty of ±5%, deriving mainly from uncertainties in emission factors. This results in a 3.0% contribution to the variance. The uncertainty in emission factors are estimated as an average of IPCC defaults for uncertainties in Tier 1 and Tier methods. For of N O from cultivation of histosoils (CRF 4D15) the combined uncertainty is estimated to be ±65%, deriving mainly from uncertainty in emission factors. The uncertainty estimates for emission factors contribute with.5% to the variance and are based on IPCC default uncertainty ranges. 8
29 9 The agriculture sector contributes with Gg CO equivalents with the associated uncertainty of ±41%. The agriculture sector has a combined uncertainty of 5.0% of the, or 74% contribution to the variance in 004. The vast majority of the uncertainty derives from emission factors. Table 5. The five contributors of uncertainty in the agriculture sector and the contribution from the sector to the overall uncertainty in the inventory year 004 CRF 4D 4A 4D1 5 4B IPCC source category Agricultural soils Enteric fermentation Cultivation of histosoils Manure managemen t Manure managemen Combined uncertaint y as % of in year 004, % Activity data contributi on to variance in in 004, % factor contribution to variance in in 004, % contributi on to variance in in 004, % Emissio Ga s ns 004 Gg CO eq Combined uncertaint y, % N O CH N O N O CH B t 4 All All * <0.005 Totals may not sum due to individual rounding. The uncertainty estimates for emission of CH 4 in CRF 4A and of N O in CRF 4D are slightly lower in this study compared to estimates in submission 005, whereas of CH 4 and N O from CRF 4B show the same results CRF 6. Waste The documentation of how uncertainties in all source categories in waste have been assessed and their rational are given in Swedish in expert protocol 18 for CRF 6A and 6B, and in expert protocol 5 for CRF 6C (Appendix ). The uncertainty estimates for the waste sector in 004 are presented in Table 6. s of CH 4 from solid waste (CRF 6A) have the largest effect on the overall uncertainty in 004 (1.7%) from this sector. The source category has relatively large emission quantities and at the same time, its combined uncertainty is high, ±58%. It contributes 8.7% to the variance, deriving.3% from activity data and 6.4% from emission factors. The uncertainties in activity data are estimated by expert judgement using the estimated uncertainties in the components deposited waste (±15%) and content of Degradable Organic Carbon (DOC) (±5%) as basis. The uncertainties in emission factors follow the IPCC recommendations of applying ±50% if data on methane generation has poor quality. The combined uncertainties for of N O from wastewater (CRF 6B) are estimated to be ±51%, mainly due to uncertainty in emission factors. The uncertainty in emission factors are based on IPCC recommendations. 9
30 30 The waste sector contributes with 346 Gg CO equivalents with the associated uncertainty of ±51%. The vast majority of the uncertainty derives from emission factors. The waste sector has a combined uncertainty of 1.7% of the in 004. Table 6. The three contributors of uncertainty in the waste sector and the contribution from the sector to the overall uncertainty in the inventory year 004 C R F 6 A 6 B 6 C IPCC source category Solid waste Wastewa ter Waste incinerati on Combine d uncertai nty as % of emission s in year 004, % Activity data contributi on to variance in in 004, % factor contribution to variance in in 004, % data contributi on to variance in in 004, % contributi on to variance in in 004, % G as Emissio ns 004 Gg CO eq Combine d uncertain ty, % C H N O * C O * * Al l * All * <0.005 Totals may not sum due to individual rounding. When comparing the uncertainty estimates for of CH 4 from CRF 6A with values from submission 005 it is obvious that they are significantly higher in this study. The uncertainty estimates associated with of N O from CRF 6B are the same in both studies. The uncertainty estimate for CRF 6C is slightly lower in this study Summary of all sectors Table 7 shows a summary of all sectors in terms of emission quantities, combined uncertainties, contributions to the overall uncertainty in the inventory 004 and activity data, emission factors and emission data contributions to the overall variance. The agriculture sector has the highest uncertainty contribution of all sectors to the overall uncertainty with 5.0%, or 74% to the variance. Stationary combustion is the second largest sector, contributing with 1.9% to the uncertainty, or 11% to the variance. Table 7. Uncertainty and variance contribution for the different sectors in the inventory 004 s 004 Gg CO eq Combined uncertainty, % Combined uncertainty as % of in year 004, % Activity data contribution to variance in in 004, % factor contribution to variance in in 004, % data contribution to variance in in 004, % contribution to variance in in 004, % CRF Sector 1. Stationary combustion * Mobile combustion Industrial Process
31 31 3. Solvent and other product use <0.005 < Agriculture Waste * 8.76 Total * <0.005 Totals may not sum due to individual rounding. Table 7 also shows the contribution to the variance from activity data, emission factors and emission data from each sector in the inventory 004. It shows that the majority - 89% - of the variance in the in 004 derives from emission factors and that variance in activity data stands for 11%. data only accounts for a small share (0.05%) of the overall variance in the inventory. The vast majority of the contribution to variance in emission factors derives from agriculture (CRF 4) accounting for 70% of the variance. The contribution to variance from emission factors in stationary combustion and waste stands for 8.% and 6.4% respectively to the variance. The agriculture sector (CRF 4) also stands for the biggest (3.8%) contribution to the variance from activity data. Stationary combustion and mobile combustion (CRF 1) and waste (CRF 6) stand for quite similar shares of the variance,.8%,.4% and.3% respectively. Industrial processes (CRF ) and solvent and other product use (CRF 3) overall stand for small shares of variance in. 3. Uncertainty and variance contribution from different greenhouse gases Table 8 shows the emission quantities, combined uncertainties, contributions to the overall uncertainty in the inventory 004 and activity data, emission factors and emission data contributions to the overall variance in percentage for different greenhouse gases. The vast majority - 7% - of the variance in the inventory derives from of N O and of CO and CH 4 contributes with 15% and 1% respectively. s of F- gases stand for a minor share 0.3% - of the overall uncertainty in the inventory. Table 8. Uncertainty and variance contribution for the different greenhouse gases in the inventory 004 s 004 Gg CO eq Combined uncertainty, % Combined uncertainty as % of in year 004, % Activity data contribution to variance in in 004, % factor contribution to variance in in 004, % data contribution to variance in in 004, % contribution to variance in in 004, % Gas CO * CH * 1.49 NO F- gases * 0.6 Total * <0.005 Totals may not sum due to individual rounding. 31
32 3 3.3 Uncertainties in trend Table 9 shows the ten largest source categories contributing to the uncertainties introduced into the trend in by activity data, emission factors and emission data respectively. of NO from agricultural soils is ranked number one with an estimated contribution of uncertainty in the trend of 1.5%. The second largest source category is of CH4 from solid waste with an estimated contribution of uncertainty into the trend of 1.3%. The uncertainty introduced into the trend (between 1990 and 004) in is estimated to be.8%, deriving mostly from uncertainty introduced by activity data uncertainty. 3
33 33 Table 9. The ten largest contributors to the uncertainty in trend 1990 to 004 4D CRF 6A 1A Mobile combustio n 1A4b 1A Mobile combustio n 1B1c 1Af 1Ac 1A1b IPCC source category Agricultural soils Solid waste Diesel Residential, Stationary Gasoline Flaring of gas Other Manufacturin g Industries and Construction, Stationary Chemicals Petroleum Refining Enteric 4A fermentation 1,, 3, 4, 6 All G a s N s 1990 Gg CO eq Emissio ns 004 Gg CO eq Activity data uncertaint y contributi on factor uncertaint y contributi on Combine d uncertain ty, % Combined uncertaint y as % of in year 004, % Type A sensitivi ty, % Type B sensitivi ty, % Uncertaint y in trend in introduce d by EF uncertaint y, % Uncertaint y in trend in introduce d by activity data uncertaint y, % Uncertai nty introduc ed into the trend in emission s, % O C H C O C O C O C O C O C O C O C H A ll ,85,
34 34 34
35 35 4 Analysis and discussion By improving the structure of the uncertainty estimates and the transparency in the underlying data, the quality of the uncertainty estimates has improved. Information on emission quantities and their associated uncertainty estimates are now available (in several cases) for disaggregated source categories. There are also clear links in the calculations of aggregated uncertainties simplifying the procedure of updating the figures for future inventory years. As a result of this study, the uncertainty estimates for the are reduced compared to submission 005. The estimated in Sweden in 004 account for Gg CO equivalents. The overall uncertainty associated with these amounts is calculated to be ±5.8%. That equals a variance of 34%. The uncertainty in the agriculture sector (CRF 4) accounts for about 74% of the variance in the inventory or 5% combined uncertainty in 004. Hence, even if it was possible to eliminate the uncertainties in all other sectors, the uncertainty in would remain at ±5%. More precisely, uncertainties in emission factors for N O from agricultural soils (CRF 4A) stands for about 64% of the variance. This should be a high priority when efforts are made to improve the accuracy of the inventory in the future. Appendix 1 shows the uncertainty and variance estimates for the inventory 1990 and 004. The uncertainty in 1990 (±6.4%) is higher compared to 004 (±5.8). This is mainly due to a larger share of emission quantities for source categories with higher uncertainties in 1990 than 004, especially agricultural soils (CRF 4A). In addition, a few source categories have higher estimated uncertainties in 1990 than in 004. The ten source categories with the largest uncertainties in the inventories 004 and 1990 are summarized in Tables 10 and 11 and should be prioritized when efforts are made to improve the quality of the inventory emission estimates. The figures estimated for 1990 and 004 neither include the correlation that may exist between source categories, nor include corrections for non-reported sources. Therefore, the actual uncertainty of the estimated per compound and of the aggregated greenhouse gas will be somewhat higher. There is an estimated ±.8% uncertainty in the trend in between 1990 and 004. It is mainly due to uncertainties introduced by activity data. This is important information when stipulating greenhouse gas mitigation policies by responsible authority. The Swedish target for emission reductions is -4%. When considering the uncertainty in the trend, this means that a larger reduction is needed to ensure that the target is met. 35
36 36 Table 10. The ten source categories with the largest uncertainty and variance contribution in the Swedish inventory for 004 4D 6A CRF IPCC source Category Agricultural soils GHG s 004 NO Solid waste CH4 Gg CO e.q. Combined uncertaint y Combined uncertainty as % of in 004 Activity data contributio n to variance in in 004 factor contribution to variance in in 004 % % % % % contributio n to variance in in Ac Chemicals CO < A 1A1a 4D15 1A Mobile combustion 1A Mobile combustion 1A Mobile combustion (excluding 1A3b) 1A4b Enteric fermentation Public electricity and Heat production Cultivation of histosoils Gasoline Diesel Diesel Residential, stationary CH4 CO NO CO CO NO CO < < < <
37 37 Table 11. The ten source categories with the largest uncertainty and variance contribution in the Swedish inventory for 1990 CRF IPCC source Category GHG s 1990 Combined uncertaint y Combined uncertainty as % of in 1990 Activity data contribution to variance in in 1990 factor contribution to variance in in 1990 contributio n to variance in in D Gg CO e.q. % % % % % Agricultural soils NO A Solid waste CH A4b 4A Residential, stationary CO < Enteric fermentation CH Ac Chemicals CO < D15 Cultivation of histosoils NO < A Mobile combustion Gasoline CO A Mobile combustion Diesel CO A Mobile combustion (excluding 1A3b) Diesel NO < B1c Flaring of gas CO
38 38 5 Possible future improvements This study did not include improvement of single uncertainty estimates, for instance by consulting external experts for better information on uncertainties on different sources. Further work considering uncertainties should focus on such improvements. Uncertainty estimates in this study are to large extent based on the assumption that the uncertainty in source categories has not changed over time. This is of course not realistic for all source categories, and to enable more accurate trend assessment, this issue should be addressed in future studies. The uncertainty analysis should be combined with the Key Source analysis, so that Tier Key Source analysis can be performed. Looking at the factors with the highest contribution to the overall uncertainty in order to help prioritizing future improvements, emission factors and activity data for CH 4 from agricultural soils (CRF 4D), and emission factors for CH 4 from solid waste (CRF 6A) and for CO from chemicals (CRF 1Ac) should be in focus. Information on uncertainties on more disaggregated level in both the agriculture sector and waste sector exists. However, due to correlation in especially activity data, it has not been possible to apply. Applying IPCC Tier methodology would therefore enable improvements in the uncertainty estimates in those sectors. When prioritizing, the cost for improvement should also be taken into account. This may make it difficult to reduce the uncertainty for N O from agricultural soils for instance, since relevant measurements most likely require large financial resources. In order reduce the financial burden for a single country, such studies could be conducted together with other countries with similar conditions as Sweden. The transparent and traceable documentation of uncertainty estimates carried out in this study will enable future internal and external peer reviews, and in particular the QA by third party in accordance with the Swedish National System. In an unpublished paper by Statistics Sweden (Brånvall, 005), sketches of an alternative method to the IPCC Good Practice Guidance Tier is presented. It suggests methods for taking correlation between sources and gases into account as well as how calculations can be performed without using Monte Carlo-simulations. 38
39 39 References Brånvall, G. (005) Quantifying uncertainties in practice kommentarer. Unpublished paper by Statistics Sweden. Gustafsson, T., Olsson, B., Rönnbacka, M. (005) Review of activity data in the Other sector CRF 1Af, construction and CRF 1A4, Other. 1. Pilot study. SMED report 005 IPCC (1997) Revised 1996 IPCC Guidelines for National Greenhouse Gas Inventories. IPCC (000) IPCC Good Practice Guidance and Uncertainty Management in National Greenhouse Gas Inventories. SMED (003) Tillämpning av Good Practice Guidance Förstudie (eng. Application of Good Pratice Guidance Pilot study). SMED report 003. SMED (005) Manual for SMED:s Quality System in the Swedish Air Inventories. SMED report 005. UNFCCC (199) Text of the Convention, Article. United Nations. 39
40 Appendix 1. Tier 1 uncertainty assessment as presented in the Swedish National Inventory Report of submission 006. Table A1. Tier 1 uncertainty assessment for of CO equivalents in 004 without adjustment for correlation between sources. CRF IPCC source category 1A1a GHG s 004 Combined uncertaint y Combined uncertaint y as % of in 004 Activity data contributio n to variance in in 004 factor contributio n to variance in in 004 Gg CO eq % % % % % Public electricity and Heat production CO A1b Petroleum Refining CO A1c Manufacture of Solid Fuels and Other Energy Industries CO * 0.0 1Aa Iron and Steel CO Ab Non-Ferrous Metals CO 9 3 * * * 1Ac Chemicals CO Ad Pulp, Paper and Print CO Ae 1Af Food Processing, Beverages and Tobacco CO * * Other Manufacturing Industries and Construction, stationary CO A Mobile combustion CO A4a Commercial/Institutional CO * 1A4b Residential, Stationary CO * 1A4c Agriculture/Forestry/Fisheries, Stationary CO * 1B1 Solid fuels CO B Oil and Natural Gas CO * * data contributio n to variance in in 004 A Mineral Products CO * 0.03 * B Chemical Industry CO * * C Metal Production CO * 3 Solvent and other product use CO * * 6C Waste Incineration CO * Total CO * * <0.005 Figures may not be exactly the same as presented in NIR due to revised data. 40
41 Table A1 cont. Tier 1 uncertainty assessment for of CO equivalents in 004 without adjustment for correlation between sources. CRF IPCC source category 1A1a GHG s 004 Combined uncertaint y Combined uncertaint y as % of in 004 Activity data contributio n to variance in in 004 factor contributio n to variance in in 004 Gg CO eq % % % % % Public electricity and Heat production CH * * 1A1b Petroleum Refining CH * * * 1A1c Manufacture of Solid Fuels and Other Energy Industries CH4 < * * * 1Aa Iron and Steel CH * * * 1Ab Non-Ferrous Metals CH4 < * * * 1Ac Chemicals CH * * * 1Ad Pulp, Paper and Print CH * * 1Ae 1Af Food Processing, Beverages and Tobacco CH * * * Other Manufacturing Industries and Construction, stationary CH * * data contributio n to variance in in 004 1A Mobile combustion CH * * * 1A4a Commercial/Institutional CH * * 1A4b Residential, Stationary CH * 0.5 1A4c Agriculture/Forestry/Fisheries, Stationary CH * * * 1B1 Solid fuels CH4 < * * * 1B Oil and Natural Gas CH * * * B Chemical Industry CH * * * C Metal Production CH4 <0.5 1 * * G Other - Pulp and Paper CH4 7 1 * * * 4A Enteric Fermentation CH B Manure Management CH A Solid Waste Disposal on Land CH Total CH * * <0.005 Figures may not be exactly the same as presented in NIR due to revised data. 41
42 Table A1. cont. Tier 1 uncertainty assessment for of CO equivalents in 004 without adjustment for correlation between sources. CRF IPCC source category 1A1a GHG s 004 Combined uncertaint y Combined uncertaint y as % of in 004 Activity data contributio n to variance in in 004 factor contributio n to variance in in 004 Gg CO eq % % % % % Public electricity and Heat production NO * A1b Petroleum Refining NO * * 1A1c Manufacture of Solid Fuels and Other Energy Industries NO 3 18 * * * 1Aa Iron and Steel NO * * 1Ab Non-Ferrous Metals NO * * 1Ac Chemicals NO * * 1Ad Pulp, Paper and Print NO * Ae 1Af Food Processing, Beverages and Tobacco NO 11 0 * * * Other Manufacturing Industries and Construction, stationary NO * 0.01 data contributio n to variance in in 004 1A Mobile combustion NO * A4a Commercial/Institutional NO * * 1A4b Residential, Stationary NO * 0.0 1A4c Agriculture/Forestry/Fisheries, Stationary NO 5 8 * * * 1B1 Solid fuels NO 36 * * * 1B Oil and Natural Gas NO < * * * B Chemical Industry NO * * * G Other - Pulp and Paper NO * * 3 Solvent and other product use NO * * 4B Manure Management NO D Agricultural Soils NO B Wastewater Handling NO * 0.03 Total NO C Metal Production PFC * 0.04 F Consumption of Halocarbons and SF6 PFC 5 5 * * * C Metal Production SF * F F Consumption of Halocarbons and SF6 HFC * * Consumption of Halocarbons and SF5 PFC Total F-gases Total Sweden (CO - eqvivalents) * <0.005 Figures may not be exactly the same as presented in NIR due to revised data. 4
43 Table A. Tier 1 uncertainty assessment for of CO equivalents in 1990 without adjustment for correlation between sources. CRF IPCC source category 1A1a GHG s 1990 Combined uncertaint y Combined uncertaint y as % of in 1990 Activity data contributio n to variance in in 1990 factor contributio n to variance in in 1990 Gg CO eq % % % % % Public electricity and Heat production CO A1b Petroleum Refining CO A1c Manufacture of Solid Fuels and Other Energy Industries CO * Aa Iron and Steel CO * Ab Non-Ferrous Metals CO * * 1Ac Chemicals CO Ad Pulp, Paper and Print CO * 0.0 1Ae 1Af Food Processing, Beverages and Tobacco CO * * Other Manufacturing Industries and Construction, stationary CO A Mobile combustion CO A4a Commercial/Institutional CO * 1A4b Residential, Stationary CO A4c Agriculture/Forestry/Fisheries, Stationary CO * 1B1 Solid fuels CO B Oil and Natural Gas CO * * data contributio n to variance in in 1990 A Mineral Products CO * B Chemical Industry CO * * C Metal Production CO * 3 Solvent and other product use CO C Waste Incineration CO 44 5 * * Total CO * * <0.005 Figures may not be exactly the same as presented in NIR due to revised data. 43
44 Table A cont. Tier 1 uncertainty assessment for of CO equivalents in 1990 without adjustment for correlation between sources. CRF IPCC source category 1A1a GHG s 1990 Combined uncertaint y Combined uncertaint y as % of in 1990 Activity data contributio n to variance in in 1990 factor contributio n to variance in in 1990 Gg CO eq % % % % % Public electricity and Heat production CH * * 1A1b Petroleum Refining CH * * * 1A1c Manufacture of Solid Fuels and Other Energy Industries CH4 < * * * 1Aa Iron and Steel CH4 1 * * * 1Ab Non-Ferrous Metals CH4 < * * * 1Ac Chemicals CH * * * 1Ad Pulp, Paper and Print CH * * 1Ae 1Af Food Processing, Beverages and Tobacco CH4 1 0 * * * Other Manufacturing Industries and Construction, stationary CH * * data contributio n to variance in in A Mobile combustion CH * * A4a Commercial/Institutional CH * * 1A4b Residential, Stationary CH * 0.4 1A4c Agriculture/Forestry/Fisheries, Stationary CH * * * 1B1 Solid fuels CH4 <0.5 4 * * * 1B Oil and Natural Gas CH * * * B Chemical Industry CH * * C Metal Production CH4 <0.5 1 * * * G Other - Pulp and Paper CH4 5 1 * * * 4A Enteric Fermentation CH B Manure Management CH A Solid Waste Disposal on Land CH Total CH * <0.005 Figures may not be exactly the same as presented in NIR due to revised data. 44
45 Table A. cont. Tier 1 uncertainty assessment for of CO equivalents in 1990 without adjustment for correlation between sources. CRF IPCC source category 1A1a GHG s 1990 Combined uncertaint y Combined uncertaint y as % of in 1990 Activity data contributio n to variance in in 1990 factor contributio n to variance in in 1990 Gg CO eq % % % % % Public electricity and Heat production NO * A1b Petroleum Refining NO * * 1A1c Manufacture of Solid Fuels and Other Energy Industries NO 3 18 * * * 1Aa Iron and Steel NO * * 1Ab Non-Ferrous Metals NO 3 * * * 1Ac Chemicals NO * * 1Ad Pulp, Paper and Print NO * * 1Ae 1Af Food Processing, Beverages and Tobacco NO * * Other Manufacturing Industries and Construction, stationary NO * 0.01 data contributio n to variance in in A Mobile combustion NO * A4a Commercial/Institutional NO * * 1A4b Residential, Stationary NO * 0.0 1A4c Agriculture/Forestry/Fisheries, Stationary NO * * 1B1 Solid fuels NO 4 * * * 1B Oil and Natural Gas NO 1 89 * * * B Chemical Industry NO * 0.01 * G Other - Pulp and Paper NO * * 3 Solvent and other product use NO * * 4B Manure Management NO D Agricultural Soils NO B Wastewater Handling NO * 0.04 Total NO C Metal Production PFC * 0.08 C Metal Production SF * F F Consumption of Halocarbons and SF6 SF * * Consumption of Halocarbons and SF5 HFC 4 37 * * * Total F-gases * Total Sweden (CO- eqvivalents) * <0.005 Figures may not be exactly the same as presented in NIR due to revised data. 45
46 Appendix. Expert Protocols Referensnummer: 1 Protokollfört av: Maria Lidén, SCB Datum: Externgranskat av: NN, 00x-xx-xx Experter: Fredrik Kanlén, SCB Resultat av externgranskning: godkänt/ej godkänt Kvalifikationer: arbetat med energistatistik statistik över utsläpp från energianvändning 003- ev hänvisningar till underlag Godkänt av Naturvårdsverket: NN, 00x-xx-xx Bedömd kvantitet: År CRF-kod Aktivitet Aktivitetsdata sfaktor er troligaste värde minimum 1 maximum 1 sannolikhetsfördelning A1a bränsleslag 1-5 x enligt indata -% % normal A1b bränsleslag 1-5 x enligt indata -% % normal Ad bränsleslag 1-5 x enligt indata -% % normal A1c bränsleslag 1-5 x enligt indata -5% 5% normal Aa-c bränsleslag 1-5 x enligt indata -5% 5% normal Ae-f exkl byggindustrinbränsleslag 1-5 x enligt indata -5% 5% normal 1 gränser för 95% konfidensintervall, dvs,5% risk att det sanna värdet understiger minimum samt,5% risk att det sanna värdet överstiger maximum. Anges endast om goda grunder finns för vilken fördelning som kan antas. Grund för expertbedömning inkl använda underlagsdata: Förbränning inom företag inom CRF 1A1a, 1A1b och 1Ad undersöks alltid av SCB EN. Därför bör felen i data vara mycket små för de bränsleslag som är förtryckta på blanketten, dessa kodas 1-5 inom utsläppsinventeringen. De fel som finns beror på avrundningar och ev hanteringsfel inom SCB och utsläppsinventeringen, max % är en rimlig skattning. Antagande om normalfördelning är rimligt. Övriga företag inom sni 10-37, dvs CRF 1A1c, 1Aa-c, 1Ae-f exkl byggsektorn undersöks med urvalsundersökningar de flesta åren (undantag: 000 var undersökning). Här kan ett osäkerhetsintervall på +-5% vara rimligt. Antagande om normalfördelning är rimligt. Den som vill veta mer om källor etc kan vända sig till Barbro Olsson, SCB EN. 46
47 Referensnummer: Externgranskat av: NN, 00x-xx-xx Datum: Resultat av externgranskning: godkänt/ej godkänt Expert: Maria Lidén, SCB ev hänvisningar till underlag Kvalifikationer: utfört beräkningar för stationär förbränning sedan 000 Godkänt av Naturvårdsverket: NN, 00x-xx-xx Protokollfört av: Maria Lidén, SCB Bedömd kvantitet: År CRF-kod Aktivitet Aktivitetsdata s faktor er troligaste värde minimum 1 maximum 1 sannolikhetsfördelning alla 1A1a bränsleslag x enligt indata -10% 10% normal alla 1A1b bränsleslag x enligt indata -10% 10% normal alla 1Ad bränsleslag x enligt indata -10% 10% normal alla 1A1c bränsleslag x enligt indata -10% 10% normal alla 1Aa-c bränsleslag x enligt indata -10% 10% normal alla 1Ae-f exkl byggindustrin bränsleslag x enligt indata -10% 10% normal 1 gränser för 95% konfidensintervall, dvs,5% risk att det sanna värdet understiger minimum samt,5% risk att det sanna värdet överstiger maximum. Anges endast om goda grunder finns för vilken fördelning som kan antas. Grund för expertbedömning inkl använda underlagsdata: Bränsleslag med bränslekod inom utsläppsinventeringen är ej förtryckta på blanketten i ENs undersökningar (jfr expertprotokoll 1). Det finns därmed en risk att företagen glömmer att ta med dem eller skriver in dem på fel ställe. Därför är osäkerheten större för dessa bränsleslag. Inom utsläppsinventeringen görs kompletterande datainsamling och datakontroll för dessa bränslen. Den satta osäkerheten avser data inom inventeringen efter den kompletterande insamlingen/kontrollen. 47
48 Referensnummer: 3 Externgranskat av: NN, 00x-xx-xx Datum: Resultat av externgranskning:godkänt/ej godkänt Expert: Tomas Gustafsson, SCB ev hänvisningar till underlag Kvalifikationer: Arbetat med mobila beräkningar i 3 år. Godkänt av Naturvårdsverket: NN, 00x-xx-xx Protokollfört av: Tomas Gustafsson, SCB Bedömd kvantitet: År CRF-kod Aktivitet Aktivitetsdata (TJ) sfaktor er troligaste värde minimum 1 maximum 1 sannolikhetsfördelning Fotnot A3+1A4b-c Bensin Totala leveranser enligt indata -3% 3% Af: mobile, 1A3+1A4b-c Diesel Totala leveranser enligt indata -5% 5% A3d Eo1 Leverans till inrikes sjöfart enligt indata -15% 15% Kanske kan A3d Eo-6 Leverans till inrikes sjöfart enligt indata -15% 15% approximative A3a Flygfotogen Leverans till inrikes civilflyg enligt indata -10% 10% 3 normalfördelning antas A3a Flygbensin Leverans till inrikes civilflyg enligt indata -10% 10% A5b Jetbensin Totala leveranser enligt indata -5% 5% A3b Naturgas Totala leveranser enligt indata -10% 10% 4 1 gränser för 95% konfidensintervall, dvs,5% risk att det sanna värdet understiger minimum samt,5% risk att det sanna värdet överstiger maximum. Anges endast om goda grunder finns för vilken fördelning som kan antas. Grund för expertbedömning inkl använda underlagsdata: All aktivitetsdata baseras på levererade mängder bränsle från SCB:s månatliga undersökning av leveranser, 401:an. 1) Statistik på a leveranser av bensin kan antas vara säkra eftersom inga justeringar görs map lager eller statistika differenser. ) Statistik på a leveranser av diesel kan antas vara säkra eftersom inga justeringar görs map lager eller statistika differenser. Dock har diesel väldigt lika egenskaper som eldningsolja 1 och uppdelningen dem emellan kan eventuellt misredovisas. Därmed något högre osäkerhet för diesel jämfört med bensin. ) Säker på nivå, men indelningen av levererade oljor inrikes-utrikes har ifrågasatts, eftersom avgränsingarna mot utrikes sjöfart är svåra att följa. Statistiken följer RSV ekonomiska redovisningindelning för inrikes och utrikes bränsleleveranser. 3) Flygbränslen relativt säker på nivå. Om man kan dela upp aktivitetsdata bra på inrikes-utrikes får man ungefär +-5% enligt IPCC Good Practice Guidance. Utan att veta säkerheten i LFS statistik höjer jag till 10%. 4) Troligen säker satatistik på nivå av all naturgas, men leverantörerna ska redovisa hur mycket som går till transporter, vilket borde leda till en del fel. 48
49 Referensnummer: 4 Externgranskat av: NN, 00x-xx-xx Datum: maj 004 Resultat av externgranskning: godkänt/ej godkänt Experter: Curt-Åke Boström, Eje Flodström, David Cooper; IVL ev hänvisningar till underlag Kvalifikationer: arbetat många år med mätningar och Godkänt av Naturvårdsverket: NN, 00x-xx-xx Protokollfört av: Maria Lidén; SCB Bedömd kvantitet: År CRF-kod Aktivitet Aktivitets data sfaktor Emissi oner troligaste värde minimum 1 maximum 1 sannolikhetsfördelning stationär förbränning 1 stationär förbränning 1 stationär förbränning Eldningsolja 1 Eldningsolja -5 Propan Stadsgas Naturgas Kol Petroleumkoks Koks Koksugnsgas Masugnsgas LD-gas Torv Avfall Propan Stadsgas Naturgas Kol Petroleumkoks Koks Koksugnsgas Masugnsgas LD-gas CO CO CH4 enligt EFbilaga NIR % 1-10% enligt EFbilaga NIR % 10-30% enligt EFbilaga NIR % 10-30% stationär förbränning Eldningsolja 1 Eldningsolja -5 Torv Avfall CH A1-1A Träbränsle CH A4 Träbränsle CH4 Propan Stadsgas Naturgas Koksugnsgas 1 stationär Masugnsgas förbränning LD-gas NO enligt EFbilaga NIR % 30-50% enligt EFbilaga NIR % 30-50% enligt EFbilaga NIR >-50% 50%< enligt EFbilaga NIR % 10-30% stationär förbränning Eldningsolja 1 Eldningsolja -5 Kol Petroleumkoks Koks Träbränsle Torv Avfall NO enligt EFbilaga NIR % 30-50% 1 gränser för 95% konfidensintervall, dvs,5% risk att det sanna värdet understiger minimum samt,5% risk att det sanna värdet överstiger maximum. Anges endast om goda grunder finns för vilken fördelning som kan antas. Grund för expertbedömning inkl använda underlagsdata: Dessa osäkerheter sattes i SMEDrapport 3:004, sfaktorer för stationär förbränning. Rapporten skrevs av ovan angivna experter. Citat ur rapporten, kap 5 Osäkerheter: "De olika faktorerna är givetvis behäftade med viss osäkerhet. I IVL rapporten L98/78 gjordes en bedömning av osäkerheterna för olika ämnen, bränslen och sektor. Med denna rapport som grund och utifrån de data som framkommit i föreliggande genomgång har följande osäkerheter uppskattats." Osäkerhetsskattningen för CH4 från träbränsle inom CRF 1A4 kommer att bli inaktuell när resultaten från projektet "Småskalig förbränning" implementerats i inventeringen submission 006. OBS! I rapporten skattas även osäkerheter för CO, NOX, SO, NH3 och NMVOC. Detta har dock ej skrivits in här (ingår ej i 005 års osäkerhetsprojekt) 49
50 Referensnummer: 5 Externgranskat av: NN, 00x-xx-xx Datum: Resultat av externgranskning: godkänt/ej godkänt Experter: Curt-Åke Boström, Eje Flodström, IVL ev hänvisningar till underlag arbetat många år med mätningar och skattningar av Kvalifikationer: faktorer vid IVL. Godkänt av Naturvårdsverket: NN, 00x-xx-xx Protokollfört av: Maria Lidén, SCB Bedömd kvantitet: År CRF-kod Aktivitet Aktivitetsdata sfaktor er troligaste värde minimum 1 maximum 1 sannolikhetsfördelning stationär förbränning Eldningsolja 1 CO -1% 1% stationär förbränning Eldningsolja -5 CO -1% 1% 1 stationär enl EF-bilaga NIR ej angiven förbränning Kol CO -3% 3% Avfall CO -30% 30% Torv CO? (mindre än 5%) 10% Masugnsgas CO stor osäkerhet 1 gränser för 95% konfidensintervall, dvs,5% risk att det sanna värdet understiger minimum samt,5% risk att det sanna värdet överstiger maximum. Anges endast om goda grunder finns för vilken fördelning som kan antas. Grund för expertbedömning inkl använda underlagsdata: Dessa osäkerheter sattes i en snabbutredning av Co faktorer för energisektorn på uppdrag av Naturvårdsverket av ovan angivna experter. Se sid -3 i det PM som tillsändes NV ovan angivet datum. 50
51 Referensnummer: 6 Externgranskat av: NN, 00x-xx-xx Datum: Resultat av externgranskning: godkänt/ej godkänt Expert: Maria Lidén, SCB ev hänvisningar till underlag Kvalifikationer: utfört beräkningar för stationär förbränning sedan 000 Godkänt av Naturvårdsverket: NN, 00x-xx-xx Protokollfört av: Maria Lidén, SCB Bedömd kvantitet: År CRF-kod Aktivitet Aktivitetsdata sfaktor er troligaste värde minimum 1 maximum 1 sannolikhetsfördelning B1c koksugnsgas x enligt indata -70% +70% B1c masugnsgas x enligt indata -50% +100% B1c LD-gas x enligt indata -50% +50% 000-1B1c koksugnsgas x enligt indata -50% +50% 000-1B1c masugnsgas x enligt indata -40% +70% 000-1B1c LD-gas x enligt indata -40% +40% 1 gränser för 95% konfidensintervall, dvs,5% risk att det sanna värdet understiger minimum samt,5% risk att det sanna värdet överstiger maximum. Anges endast om goda grunder finns för vilken fördelning som kan antas. Grund för expertbedömning inkl använda underlagsdata: I samband med granskning maj 005 av indata till KOLfil 004 blev vi tvungna att revidera tidsserien för SSABs fackling i Luleå. Aktivitetsdata är, även efter revideringen, mycket osäkra. Vår kontakt på SSAB säger även han att data är osäkra hur man än gör (detta gäller deras fackling, förbränningen har de mycket bättre koll på). Tills annan information kommer fram är det rimligt att ansätta samma osäkerheter för facklingsdata Oxelösund även om de data vi refererar till endast avser Luleå. I Luleå facklar man på två facklor, en med mätning av facklade mängder och en där man skattar facklingen utifrån hur spjället stått etc. De senaste fem åren (ca) har man i större utsträckning facklat i facklan med mätning, detta av buller- och miljöskäl. Osäkerheterna är därför något lägre 000 och framåt. Datafiler som använts i samband med denna utredning finns lagrade på SCBs server under M:\LUFT\INTERNATIONELL RAPPORTERING\Stationär förbränning\submission 006\Fackling SSAB Bör tilläggas att de osäkerheter som satts är mitt eget tyckande utifrån den gamla respektive nya tidsserien. Även osäkerheterna är alltså osäkra... Vår kontakt på SSAB: Leif Wahlberg SSAB Tunnplåt, Metallurgi Luleå tfn: mob: fax: leif.wahlberg@ssab.com 51
52 Referensnummer: 7 Externgranskat av: NN, 00x-xx-xx Datum: Resultat av externgranskning: godkänt/ej godkänt Expert: Maria Lidén, Tomas Gustafsson, SCB ev hänvisningar till underlag Kvalifikationer: arbetat med utsläppsberäkningar flera år Godkänt av Naturvårdsverket: NN, 00x-xx-xx Protokollfört av: Maria Lidén, SCB Bedömd kvantitet: År CRF-kod Aktivitet Aktivitets data sf aktor er troligaste värde minimum 1 maximum 1 sannolikhetsfördelning alla 1Af byggindustri diesel, eldningsolja 1-5 x enligt indata från EN -0% 0% alla 1A4a diesel, eldningsolja 1-5 x enligt indata från EN -0% 0% alla 1A4b diesel, eldningsolja 1-5 x enligt indata från EN -0% 0% alla 1A4c diesel, eldningsolja 1-5 x enligt indata från EN -0% 0% alla 1Af byggindustri övriga bränslen x enligt indata från EN -10% 10% alla 1A4a övriga bränslen x enligt indata från EN -10% 10% alla 1A4b övriga bränslen x enligt indata från EN -10% 10% alla 1A4c övriga bränslen x enligt indata från EN -10% 10% 1 gränser för 95% konfidensintervall, dvs,5% risk att det sanna värdet understiger minimum samt,5% risk att det sanna värdet överstiger maximum. Anges endast om goda grunder finns för vilken fördelning som kan antas. Grund för expertbedömning inkl använda underlagsdata: Oljor: Osäkerhetsskattningen har satts genom en expertbedömning utifrån storleken på den statistiska differens som redovisas i EN0SM. Vi har antagit att den statistiska differensen på användarsidan (ca 10%) kan föras på övrigsektorn. Detta då data för industrin har en mkt hög säkerhet. Vid uppdelning på sektorer inom övrigsektorn tror vi att osäkerheten ökar till ca 0%. Övriga bränslen: För dessa bränslen visas ingen nämnvärd statistisk differens i EN0SM. Vi skattar därför osäkerheten som lägre än för oljorna men högre än för motsvarande bränslen inom industrin. 10% är då ett rimligt antagande. 5
53 Referensnummer: 8 Externgranskat av: NN, 00x-xx-xx Datum: Resultat av externgranskning: godkänt/ej godkänt Expert: Tomas Gustafsson, SCB ev hänvisningar till underlag Kvalifikationer: Arbetat med mobila beräkningar i 3 år. Godkänt av Naturvårdsverket: NN, 00x-xx-xx Protokollfört av: Tomas Gustafsson, SCB Bedömd kvantitet: År CRF-kod Aktivitet Aktivitetsdata sfaktor er troligaste värde minimum 1 maximum 1 sannolikhetsfördelning Fotnot Af mobil bensin och diesel CH4-175% 175% A3e bensin och diesel CH4-00% 00% A4b bensin och diesel CH4-00% 00% A4c bensin och diesel CH4-150% 150% 004 1Af mobil bensin och diesel CH4-175% 175% 004 1A3e bensin och diesel CH4-00% 00% 004 1A4b bensin och diesel CH4-00% 00% 004 1A4c bensin och diesel CH4-150% 150% enl EF-bilaga NIR Af mobil bensin och diesel NO -00% 00% skeva, kanske lognormal A3e bensin och diesel NO -00% 00% A4b bensin och diesel NO -00% 00% A4c bensin och diesel NO -00% 00% 004 1Af mobil bensin och diesel NO -00% 00% 004 1A3e bensin och diesel NO -00% 00% 004 1A4b bensin och diesel NO -00% 00% 004 1A4c bensin och diesel NO -00% 00% 1 gränser för 95% konfidensintervall, dvs,5% risk att det sanna värdet understiger minimum samt,5% risk att det sanna värdet överstiger maximum. Anges endast om goda grunder finns för vilken fördelning som kan antas. Grund för expertbedömning inkl använda underlagsdata: Osäkerhetsbedömninbarna är gjorda utifrån de bokstavsbeteckningar som anges i CORINAIR vad gäller osäkerheter för arbetsfordon och arbetsmaskiner. NO har beteckning E, vilket anses baseras på information med sämst kvalitet och inte vara representativt för populationen. CH4 har blandat C och E, där C står för ett urval av ett part tester och kan anses vara någorlunda representativt för pop. Har antagit att E=+-00%, medan C=+-150%. 53
54 Referensnummer: 9 Externgranskat av: NN, 00x-xx-xx Datum: Resultat av externgranskning: godkänt/ej godkänt Expert: Maria Lidén, SCB ev hänvisningar till underlag Kvalifikationer: utfört beräkningar för stationär förbränning sedan 000 Godkänt av Naturvårdsverket: NN, 00x-xx-xx Protokollfört av: Maria Lidén, SCB Bedömd kvantitet: År CRF-kod Aktivitet Aktivitetsdata sfaktor er troligaste värde minimum 1 maximum 1 sannolikhetsfördelning torv x enligt indata -1.00%.00% torv x enligt indata -5.00% 5.00% torv x enligt indata -5.00% 5.00% torv x enligt indata -5.00% 5.00% torv x enligt indata % 5.00% torv x enligt indata -5.00% 15.00% torv x enligt indata -5.00% 30.00% torv x enligt indata -5.00% 10.00% torv x enligt indata -5.00% 5.00% torv x enligt indata -.00%.00% torv x enligt indata -.00%.00% torv x enligt indata -.00% 15.00% 00-1 torv x enligt indata -.00%.00% 1 gränser för 95% konfidensintervall, dvs,5% risk att det sanna värdet understiger minimum samt,5% risk att det sanna värdet överstiger maximum. Anges endast om goda grunder finns för vilken fördelning som kan antas. Grund för expertbedömning inkl använda underlagsdata: Förbränning av torv enligt inventeringens underlagsdata (i SCB:s s.k. "KOLfil") skiljer sig från förbränning av torv enligt EN 31 SM. EN 31 SM är den publicerade versionen av SCB EN:s kvartalsstatistik. De data som används inom inventeringen är samlade från ett flertal källor hos EN för att uppnå bästa möjliga kvalitet, dokumentationen av exakt hur detta gjordes är dock inte fullständig. Eva Johansson på SCB EN är nu ansvarig för kvartalsstatistiken. Jag och Eva bedömer att vi inte vinner något på att gräva ett varv till i Ens gamla datafiler för talet, det är bara att konstatera att olika datakällor ger skilda resulat. De här satta osäkerheterna för torv är skillnaderna mellan data enligt EN31SM och data använda i inventeringen + nån procentenhet. För mer information se excelfiler på SCB, M:\LUFT\INTERNATIONELL RAPPORTERING\Stationär förbränning\submission 006\Div utredningar från attgöralistan\utredning torvdata.xls 54
55 Referensnummer: 10 Externgranskat av: NN, 00x-xx-xx Datum: Resultat av externgranskning: godkänt/ej godkänt Expert: Tomas Gustafsson, SCB ev hänvisningar till underlag Kvalifikationer: Arbetat med mobila beräkningar i 3 år. Godkänt av Naturvårdsverket: NN, 00x-xx-xx Protokollfört av: Tomas Gustafsson, SCB Bedömd kvantitet: År CRF-kod Aktivitet Subaktivitet Aktivitetsdata sfaktor er troligaste värde minimum 1 maximum A3b Bensin Passenger Car CH4 enligt indata från artemis -40% 40% A3b Bensin Truck -3,5t CH4 enligt indata från artemis -40% 40% A3b Bensin Moped CH4 enligt indata från artemis -40% 40% A3b Bensin Motorcycel CH4 enligt indata från artemis -40% 40% A3b Diesel Passenger Car CH4 enligt indata från artemis -45% 45% A3b Diesel Truck -3,5t CH4 enligt indata från artemis -45% 45% A3b Diesel Bus CH4 enligt indata från artemis -45% 45% A3b Diesel Truck 3,5-16t CH4 enligt indata från artemis -45% 45% A3b Diesel Truck 16t- CH4 enligt indata från artemis -45% 45% A3b Naturgas Alla CH4 enligt indata från artemis 004 1A3b Bensin Passenger Car NO enligt indata från artemis -60% 60% 004 1A3b Bensin Truck -3,5t NO enligt indata från artemis -60% 60% 004 1A3b Bensin Moped NO enligt indata från artemis -60% 60% 004 1A3b Bensin Motorcycel NO enligt indata från artemis -60% 60% 004 1A3b Diesel Passenger Car NO enligt indata från artemis -65% 65% 004 1A3b Diesel Truck -3,5t NO enligt indata från artemis -65% 65% 004 1A3b Diesel Bus NO enligt indata från artemis -65% 65% 004 1A3b Diesel Truck 3,5-16t NO enligt indata från artemis -65% 65% 004 1A3b Diesel Truck 16t- NO enligt indata från artemis -65% 65% 004 1A3b Naturgas Alla NO enligt indata från artemis 1 gränser för 95% konfidensintervall, dvs,5% risk att det sanna värdet understiger minimum samt,5% risk att det sanna värdet överstiger maximum. Anges endast om goda grunder finns för vilken fördelning som kan antas. Grund för expertbedömning inkl använda underlagsdata: 1) Osäkerheterna är satta utifrån mycket låg kunskap i hur säker artemisdata kan antas vara. IPCC Godd Practice Guidance anger att faktorer för CH4 har en trolig osäkerhet på ca +- 40%, medan faktorerna för NO troligen ligger övere +-50%. Här antas att utsläppen från bensin är något säkrare än diesel eftersom aktivitetsdata antas vara något säkrare. Antar att osäkerheten för utsläppen av NO från bensin och diesel ligger på +- 60% respektive +- 65%. ) Hittills inga utsläpp beräknade. Kanske kommer det med artemis. 55
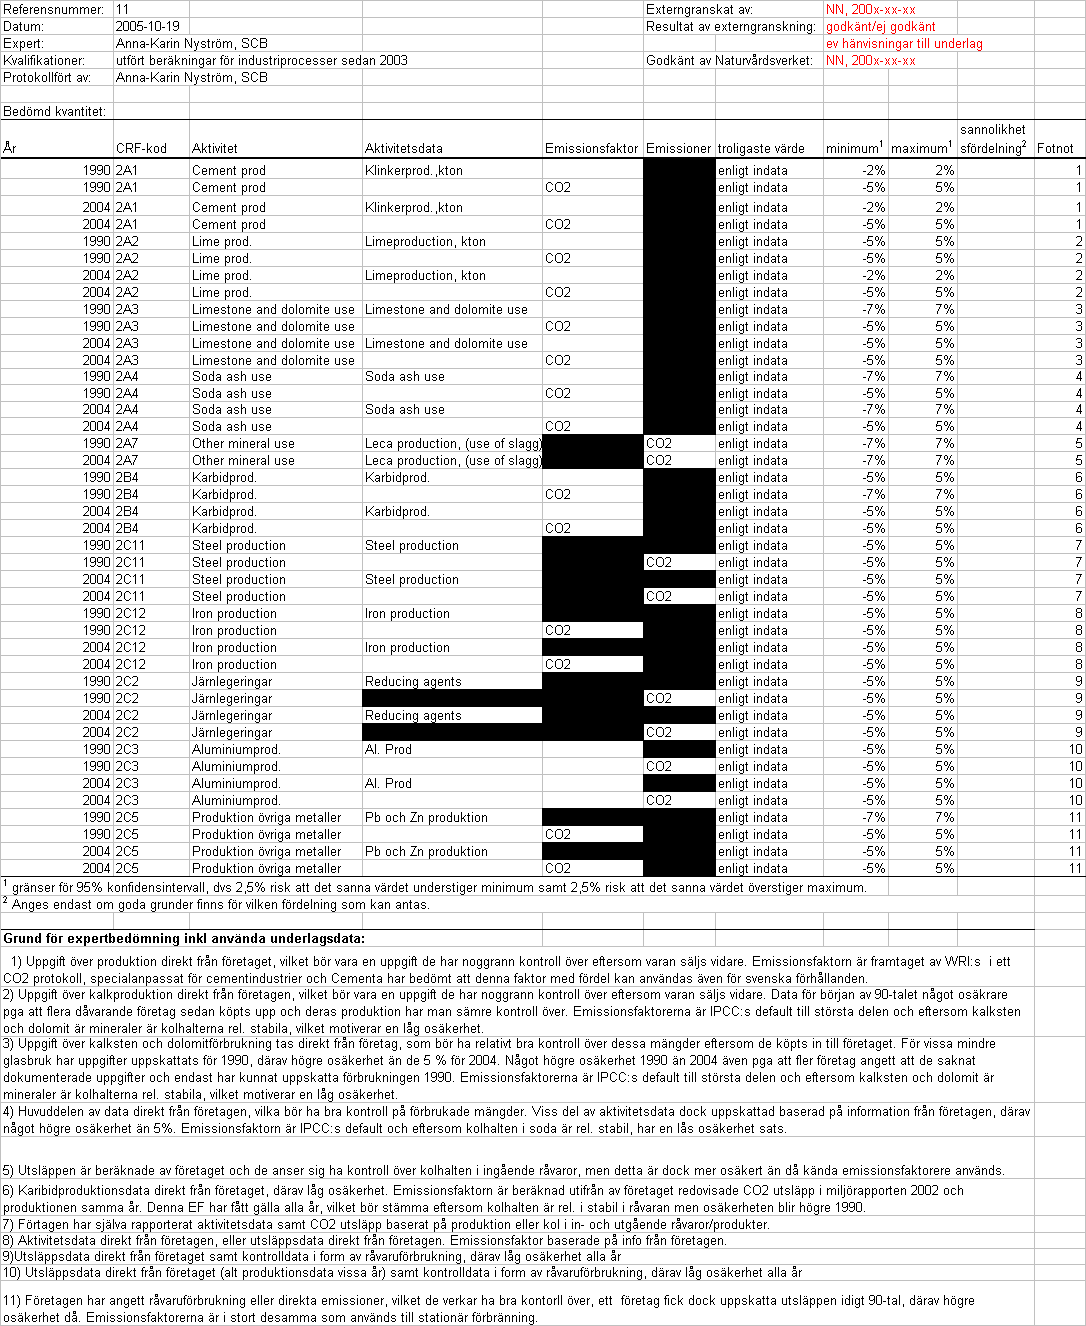
56 56
Klimatpåverkan och de stora osäkerheterna - I Pathways bör CO2-reduktion/mål hanteras inom ett osäkerhetsintervall
 Klimatpåverkan och de stora osäkerheterna - I Pathways bör CO2-reduktion/mål hanteras inom ett osäkerhetsintervall Vi måste förstå att: Vårt klimat är ett mycket komplext system Många (av människan påverkade)
Stiftelsen Allmänna Barnhuset KARLSTADS UNIVERSITET
 Stiftelsen Allmänna Barnhuset KARLSTADS UNIVERSITET National Swedish parental studies using the same methodology have been performed in 1980, 2000, 2006 and 2011 (current study). In 1980 and 2000 the studies
SWESIAQ Swedish Chapter of International Society of Indoor Air Quality and Climate
 Swedish Chapter of International Society of Indoor Air Quality and Climate Aneta Wierzbicka Swedish Chapter of International Society of Indoor Air Quality and Climate Independent and non-profit Swedish
Country report: Sweden
 Country report: Sweden Anneli Petersson, PhD. Swedish Gas Centre Sweden Statistics for 2006 1.2 TWh produced per year 223 plants 138 municipal sewage treatment plants 60 landfills 3 Industrial wastewater
CHANGE WITH THE BRAIN IN MIND. Frukostseminarium 11 oktober 2018
 CHANGE WITH THE BRAIN IN MIND Frukostseminarium 11 oktober 2018 EGNA FÖRÄNDRINGAR ü Fundera på ett par förändringar du drivit eller varit del av ü De som gått bra och det som gått dåligt. Vi pratar om
Signatursida följer/signature page follows
 Styrelsens i Flexenclosure AB (publ) redogörelse enligt 13 kap. 6 och 14 kap. 8 aktiebolagslagen över förslaget till beslut om ökning av aktiekapitalet genom emission av aktier och emission av teckningsoptioner
FORSKNINGSKOMMUNIKATION OCH PUBLICERINGS- MÖNSTER INOM UTBILDNINGSVETENSKAP
 FORSKNINGSKOMMUNIKATION OCH PUBLICERINGS- MÖNSTER INOM UTBILDNINGSVETENSKAP En studie av svensk utbildningsvetenskaplig forskning vid tre lärosäten VETENSKAPSRÅDETS RAPPORTSERIE 10:2010 Forskningskommunikation
Isolda Purchase - EDI
 Isolda Purchase - EDI Document v 1.0 1 Table of Contents Table of Contents... 2 1 Introduction... 3 1.1 What is EDI?... 4 1.2 Sending and receiving documents... 4 1.3 File format... 4 1.3.1 XML (language
Grass to biogas turns arable land to carbon sink LOVISA BJÖRNSSON
 Grass to biogas turns arable land to carbon sink LOVISA BJÖRNSSON Project funding and reporting, Thomas Prade & Mikael Lantz (2016) Grass for biogas - Arable land as carbon sink. Report 2016:280. Energiforsk,
Schenker Privpak AB Telefon VAT Nr. SE Schenker ABs ansvarsbestämmelser, identiska med Box 905 Faxnr Säte: Borås
 Schenker Privpak AB Interface documentation for web service packageservices.asmx 2012-09-01 Version: 1.0.0 Doc. no.: I04304b Sida 2 av 7 Revision history Datum Version Sign. Kommentar 2012-09-01 1.0.0
Swedish framework for qualification www.seqf.se
 Swedish framework for qualification www.seqf.se Swedish engineering companies Qualification project leader Proposal - a model to include the qualifications outside of the public education system to the
Senaste trenderna inom redovisning, rapportering och bolagsstyrning Lars-Olle Larsson, Swedfund International AB
 1 Senaste trenderna inom redovisning, rapportering och bolagsstyrning Lars-Olle Larsson, Swedfund International AB 2 PwC undersökning av börsföretag & statligt ägda företag Årlig undersökning av års- &
Regional Carbon Budgets
 Regional Carbon Budgets Rapid Pathways to Decarbonized Futures X-CAC Workshop 13 April 2018 web: www.cemus.uu.se Foto: Tina Rohdin Kevin Anderson Isak Stoddard Jesse Schrage Zennström Professor in Climate
Information technology Open Document Format for Office Applications (OpenDocument) v1.0 (ISO/IEC 26300:2006, IDT) SWEDISH STANDARDS INSTITUTE
 v1.0 (ISO/IEC 26300:2006, IDT) SWEDISH STANDARDS INSTITUTE") SVENSK STANDARD SS-ISO/IEC 26300:2008 Fastställd/Approved: 2008-06-17 Publicerad/Published: 2008-08-04 Utgåva/Edition: 1 Språk/Language: engelska/english ICS: 35.240.30 Information technology Open Document
SVENSK STANDARD SS-ISO/IEC 26300:2008 Fastställd/Approved: 2008-06-17 Publicerad/Published: 2008-08-04 Utgåva/Edition: 1 Språk/Language: engelska/english ICS: 35.240.30 Information technology Open Document
This exam consists of four problems. The maximum sum of points is 20. The marks 3, 4 and 5 require a minimum
 Examiner Linus Carlsson 016-01-07 3 hours In English Exam (TEN) Probability theory and statistical inference MAA137 Aids: Collection of Formulas, Concepts and Tables Pocket calculator This exam consists
EASA Standardiseringsrapport 2014
 EASA Standardiseringsrapport 2014 Inför EASA Standardiseringsinspektion hösten 2016 Presentatör Johan Brunnberg, Flygteknisk Inspektör & Del-M Koordinator Sjö- och luftfartsavdelningen Enheten för operatörer,
Pharmacovigilance lagstiftning - PSUR
 Pharmacovigilance lagstiftning - PSUR Karl Mikael Kälkner Tf enhetschef ES1 EUROPAPARLAMENTETS OCH RÅDETS DIREKTIV 2010/84/EU av den 15 december om ändring, när det gäller säkerhetsövervakning av läkemedel,
Measuring child participation in immunization registries: two national surveys, 2001
 Measuring child participation in immunization registries: two national surveys, 2001 Diana Bartlett Immunization Registry Support Branch National Immunization Program Objectives Describe the progress of
Beslut om bolaget skall gå i likvidation eller driva verksamheten vidare.
 ÅRSSTÄMMA REINHOLD POLSKA AB 7 MARS 2014 STYRELSENS FÖRSLAG TILL BESLUT I 17 Beslut om bolaget skall gå i likvidation eller driva verksamheten vidare. Styrelsen i bolaget har upprättat en kontrollbalansräkning
Module 6: Integrals and applications
 Department of Mathematics SF65 Calculus Year 5/6 Module 6: Integrals and applications Sections 6. and 6.5 and Chapter 7 in Calculus by Adams and Essex. Three lectures, two tutorials and one seminar. Important
Oförstörande provning (NDT) i Del M Subpart F/Del 145-organisationer
 i Del M Subpart F/Del 145-organisationer") Oförstörande provning (NDT) i Del M Subpart F/Del 145-organisationer Ref. Del M Subpart F & Del 145 2012-05-02 1 Seminarium för Teknisk Ledning HKP 3maj, 2012, Arlanda Inledning Allmänt Viktigare krav
Oförstörande provning (NDT) i Del M Subpart F/Del 145-organisationer Ref. Del M Subpart F & Del 145 2012-05-02 1 Seminarium för Teknisk Ledning HKP 3maj, 2012, Arlanda Inledning Allmänt Viktigare krav
Manhour analys EASA STI #17214
 Manhour analys EASA STI #17214 Presentatör Johan Brunnberg, Flygteknisk Inspektör & Del-M Koordinator Sjö- och luftfartsavdelningen Operatörsenheten Sektionen för teknisk operation 1 Innehåll Anmärkningen
Viktig information för transmittrar med option /A1 Gold-Plated Diaphragm
 Viktig information för transmittrar med option /A1 Gold-Plated Diaphragm Guldplätering kan aldrig helt stoppa genomträngningen av vätgas, men den får processen att gå långsammare. En tjock guldplätering
COPENHAGEN Environmentally Committed Accountants
 THERE ARE SO MANY REASONS FOR WORKING WITH THE ENVIRONMENT! It s obviously important that all industries do what they can to contribute to environmental efforts. The MER project provides us with a unique
Protected areas in Sweden - a Barents perspective
 Protected areas in Sweden - a Barents perspective Olle Höjer Swedish Environmental Protection Agency Naturvårdsverket Swedish Environmental Protection Agency 2013-04-03 1 The fundamental framework for
EBBA2 European Breeding Bird Atlas
 Methodology Sergi Herrando, Verena Keller, Petr Voříšek et al. objectives 1. To document breeding evidence for all bird species at a resolution of 50x50 km 2. To estimate abundance for all bird species
Isometries of the plane
 Isometries of the plane Mikael Forsberg August 23, 2011 Abstract Här följer del av ett dokument om Tesselering som jag skrivit för en annan kurs. Denna del handlar om isometrier och innehåller bevis för
Item 6 - Resolution for preferential rights issue.
 Item 6 - Resolution for preferential rights issue. The board of directors in Tobii AB (publ), reg. no. 556613-9654, (the Company ) has on November 5, 2016, resolved to issue shares in the Company, subject
Aborter i Sverige 2008 januari juni
 HÄLSA OCH SJUKDOMAR 2008:9 Aborter i Sverige 2008 januari juni Preliminär sammanställning SVERIGES OFFICIELLA STATISTIK Statistik Hälsa och Sjukdomar Aborter i Sverige 2008 januari juni Preliminär sammanställning
Estimated emissions of NMVOC in Sweden
 Report series SMED and SMED&SLU Nr 6 2004 Swedish Methodology for Environmental Data 600 500 Emissions of NMVOC (kton) 400 300 200 100 0 1988 1989 1990 1991 1992 1993 1994 1995 1996 1997 1998 1999 2000
Indikatorer för utvecklingen av de Europeiska energisystemen
 Indikatorer för utvecklingen av de Europeiska energisystemen Filip Johnsson NEPP:s vinterkonferens 2018 Stockholm, 2018 Division of Energy Technology Department of Space, Earth and Environment Chalmers
SVENSK STANDARD SS-EN ISO 19108:2005/AC:2015
 SVENSK STANDARD SS-EN ISO 19108:2005/AC:2015 Fastställd/Approved: 2015-07-23 Publicerad/Published: 2016-05-24 Utgåva/Edition: 1 Språk/Language: engelska/english ICS: 35.240.70 Geografisk information Modell
Uttagning för D21E och H21E
 Uttagning för D21E och H21E Anmälan till seniorelitklasserna vid O-Ringen i Kolmården 2019 är öppen fram till och med fredag 19 juli klockan 12.00. 80 deltagare per klass tas ut. En rangordningslista med
EUFOU Nätverksmöte i Halmstad 3-4 oktober 2018
 EUFOU Nätverksmöte i Halmstad 3-4 oktober 2018 Ekonomi WS1 Revisionsfrågor/erfarenheter Revision inom H2020 CFS Vid projektets slut med egen revisor Om direkta + unit costs => 325000 Mall Annex 5 till
Eternal Employment Financial Feasibility Study
 Eternal Employment Financial Feasibility Study 2017-08-14 Assumptions Available amount: 6 MSEK Time until first payment: 7 years Current wage: 21 600 SEK/month (corresponding to labour costs of 350 500
District Application for Partnership
 ESC Region Texas Regional Collaboratives in Math and Science District Application for Partnership 2013-2014 Applying for (check all that apply) Math Science District Name: District Contacts Name E-mail
Kurskod: TAMS11 Provkod: TENB 28 August 2014, 08:00-12:00. English Version
 Kurskod: TAMS11 Provkod: TENB 28 August 2014, 08:00-12:00 Examinator/Examiner: Xiangfeng Yang (Tel: 070 2234765) a. You are permitted to bring: a calculator; formel -och tabellsamling i matematisk statistik
Schenker Privpak AB Telefon 033-178300 VAT Nr. SE556124398001 Schenker ABs ansvarsbestämmelser, identiska med Box 905 Faxnr 033-257475 Säte: Borås
 Schenker Privpak AB Interface documentation for web service packageservices.asmx 2010-10-21 Version: 1.2.2 Doc. no.: I04304 Sida 2 av 14 Revision history Datum Version Sign. Kommentar 2010-02-18 1.0.0
Förändrade förväntningar
 Förändrade förväntningar Deloitte Ca 200 000 medarbetare 150 länder 700 kontor Omsättning cirka 31,3 Mdr USD Spetskompetens av världsklass och djup lokal expertis för att hjälpa klienter med de insikter
Module 1: Functions, Limits, Continuity
 Department of mathematics SF1625 Calculus 1 Year 2015/2016 Module 1: Functions, Limits, Continuity This module includes Chapter P and 1 from Calculus by Adams and Essex and is taught in three lectures,
The Swedish National Patient Overview (NPO)
") The Swedish National Patient Overview (NPO) Background and status 2009 Tieto Corporation Christer Bergh Manager of Healthcare Sweden Tieto, Healthcare & Welfare christer.bergh@tieto.com Agenda Background
The Swedish National Patient Overview (NPO) Background and status 2009 Tieto Corporation Christer Bergh Manager of Healthcare Sweden Tieto, Healthcare & Welfare christer.bergh@tieto.com Agenda Background
Botnia-Atlantica Information Meeting
 Botnia-Atlantica 2014-2020 Information Meeting Norway: Nordland Sweden: Västerbotten Västernorrland Nordanstigs kommun Finland: Mellersta Österbotten Österbotten Södra Österbotten Monitoring Committee
PORTSECURITY IN SÖLVESBORG
 PORTSECURITY IN SÖLVESBORG Kontaktlista i skyddsfrågor / List of contacts in security matters Skyddschef/PFSO Tord Berg Phone: +46 456 422 44. Mobile: +46 705 82 32 11 Fax: +46 456 104 37. E-mail: tord.berg@sbgport.com
Agenda. Tid Aktivitet Föreläsare Åtgång tid 08:30 Registrering vid TS recep. Transport till våning 5.
 Agenda Tid Aktivitet Föreläsare Åtgång tid 08:30 Registrering vid TS recep. Transport till våning 5. Dennis, Jerry och Gun. 30 min. 09:00 Intro. (Agendan, lokaler, m.m.) Dennis / Jerry/Gun 15 min 09:15
FÖRBERED UNDERLAG FÖR BEDÖMNING SÅ HÄR
 FÖRBERED UNDERLAG FÖR BEDÖMNING SÅ HÄR Kontrollera vilka kurser du vill söka under utbytet. Fyll i Basis for nomination for exchange studies i samråd med din lärare. För att läraren ska kunna göra en korrekt
Support for Artist Residencies
 1. Basic information 1.1. Name of the Artist-in-Residence centre 0/100 1.2. Name of the Residency Programme (if any) 0/100 1.3. Give a short description in English of the activities that the support is
Adding active and blended learning to an introductory mechanics course
 Adding active and blended learning to an introductory mechanics course Ulf Gran Chalmers, Physics Background Mechanics 1 for Engineering Physics and Engineering Mathematics (SP2/3, 7.5 hp) 200+ students
Här kan du checka in. Check in here with a good conscience
 Här kan du checka in med rent samvete Check in here with a good conscience MÅNGA FRÅGAR SIG hur man kan göra en miljöinsats. Det är egentligen väldigt enkelt. Du som har checkat in på det här hotellet
Evaluation Ny Nordisk Mat II Appendix 1. Questionnaire evaluation Ny Nordisk Mat II
 Evaluation Ny Nordisk Mat II Appendix 1. Questionnaire evaluation Ny Nordisk Mat II English version A. About the Program in General We will now ask some questions about your relationship to the program
Swedish adaptation of ISO TC 211 Quality principles. Erik Stenborg
 Swedish adaptation of ISO TC 211 Quality principles The subject How to use international standards Linguistic differences Cultural differences Historical differences Conditions ISO 19100 series will become
Dokumentnamn Order and safety regulations for Hässleholms Kretsloppscenter. Godkänd/ansvarig Gunilla Holmberg. Kretsloppscenter
 1(5) The speed through the entire area is 30 km/h, unless otherwise indicated. Beware of crossing vehicles! Traffic signs, guardrails and exclusions shall be observed and followed. Smoking is prohibited
Urban Runoff in Denser Environments. Tom Richman, ASLA, AICP
 Urban Runoff in Denser Environments Tom Richman, ASLA, AICP Tom Richman, CATALYST 1 Tom Richman, CATALYST 2 Tom Richman, CATALYST 3 Tom Richman, CATALYST 4 Tom Richman, CATALYST 5 Tom Richman, CATALYST
12.6 Heat equation, Wave equation
 12.6 Heat equation, 12.2-3 Wave equation Eugenia Malinnikova, NTNU September 26, 2017 1 Heat equation in higher dimensions The heat equation in higher dimensions (two or three) is u t ( = c 2 2 ) u x 2
Läkemedelsverkets Farmakovigilansdag
 Swedish Medical Products Agency s Patient- and Consumer Advisory Board Brita Sjöström May 29, 2018 Patientrådet@mpa.se https://lakemedelsverket.se/patient-konsument-rad The vision of the Swedish Medical
Documentation SN 3102
 This document has been created by AHDS History and is based on information supplied by the depositor /////////////////////////////////////////////////////////// THE EUROPEAN STATE FINANCE DATABASE (Director:
Projektmodell med kunskapshantering anpassad för Svenska Mässan Koncernen
 Examensarbete Projektmodell med kunskapshantering anpassad för Svenska Mässan Koncernen Malin Carlström, Sandra Mårtensson 2010-05-21 Ämne: Informationslogistik Nivå: Kandidat Kurskod: 2IL00E Projektmodell
Om oss DET PERFEKTA KOMPLEMENTET THE PERFECT COMPLETION 04 EN BINZ ÄR PRECIS SÅ BRA SOM DU FÖRVÄNTAR DIG A BINZ IS JUST AS GOOD AS YOU THINK 05
 Om oss Vi på Binz är glada att du är intresserad av vårt support-system för begravningsbilar. Sedan mer än 75 år tillverkar vi specialfordon i Lorch för de flesta olika användningsändamål, och detta enligt
DE TRE UTMANINGARNA..
 DE TRE UTMANINGARNA.. SYSTEM MATERIAL PROCESSER PROTOTYP UTVECKLING SERIE UTVECKLINGSFASER NY LEVERANTÖR System Process AS9100 NadCap Geometri Legering In718/ Ti Rf/ Al Standard ISO9000 TID RESAN MOT MÅLET
3 rd October 2017
 3 rd October 2017 Failures of Scaffold False work Failures Form work Bursting Trench Support Failure Hoarding Failures Can be expensive and result in fatalities and serious injuries Cardiff
Dränerade våtmarker, storlek på emission och rapportering till UNFCCC och Kyoto. Åsa Kasimir Klemedtsson
 Dränerade våtmarker, storlek på emission och rapportering till UNFCCC och Kyoto Åsa Kasimir Klemedtsson 2013-10-29 Institutionen för geovetenskaper B L U E S Biogeochemistry, Land Use & Ecosystem Sciences
State Examinations Commission
 State Examinations Commission Marking schemes published by the State Examinations Commission are not intended to be standalone documents. They are an essential resource for examiners who receive training
Asylum seekers -health evaluation and vaccination. Bernice Aronsson MD The Public Health Agency Sweden
 Asylum seekers -health evaluation and vaccination Bernice Aronsson MD The Public Health Agency Sweden 2015 1,014,836 people made it into the EU zone by sea routes 3,771 either went missing or died (UNHCR)
Lisebergs och Örby Slott Villaförening: val av solcellsleverantör
 Lisebergs och Örby Slott Villaförening: val av solcellsleverantör Varför ta vi initiativiet? Priset för solpaneler har sjunkat drastiskt. Nu får man tillbaka investeringen i mindre än 12 år. I 2017 finns
Introduktion ICAO-EASA.
 Introduktion ICAO-EASA. SSP= State Safety Program ( krav på stater från ICAO) talar bl.a. om SPI. 1 Info om kommande SMS-krav för POA. Sverige har som medlemsland i ICAO åtagit sig att ta fram ett nationellt
Differences between Eurostat and CRF data in Swedish reporting
 SMED Report No 125 2013 Differences between Eurostat and CRF data in Swedish reporting A comparative study of data on fuel consumption in 2005-2011 reported by Sweden to Eurostat and UNFCCC Annika Gerner,
Resultat av den utökade första planeringsövningen inför RRC september 2005
 Resultat av den utökade första planeringsövningen inför RRC-06 23 september 2005 Resultat av utökad första planeringsövning - Tillägg av ytterligare administrativa deklarationer - Variant (av case 4) med
Anvisningar för ämnesansvariga vid LTV-fakulteten
 STYRANDE DOKUMENT SLU ID: SLU.ltv 2015.1.1.1-839 Sakområde: Organisation och beslutsstruktur samt Forskning och utbildning på forskarnivå Dokumenttyp: Anvisning/Instruktion Beslutsfattare: Dekan Avdelning/kansli:
Arbetstillfällen 100 000.
 2 3 4 Arbetstillfällen 100 000. 5 6 7 Vissa anspråk ställs I de internationella direktiv och konventioner Sverige antingen är ålagt att följa eller frivilligt valt att följa. Här har jag listat några exempel
DVA336 (Parallella system, H15, Västerås, 24053)
") DVA336 (Parallella system, H15, Västerås, 24053) Respondents: 28 Answer Count: 9 Answer Frequency: 32,14 % Teaching methods The teaching methods in the course, that is their practical implementation and
DVA336 (Parallella system, H15, Västerås, 24053) Respondents: 28 Answer Count: 9 Answer Frequency: 32,14 % Teaching methods The teaching methods in the course, that is their practical implementation and
Materialplanering och styrning på grundnivå. 7,5 högskolepoäng
 Materialplanering och styrning på grundnivå Provmoment: Ladokkod: Tentamen ges för: Skriftlig tentamen TI6612 Af3-Ma, Al3, Log3,IBE3 7,5 högskolepoäng Namn: (Ifylles av student) Personnummer: (Ifylles
Styrteknik: Binära tal, talsystem och koder D3:1
 Styrteknik: Binära tal, talsystem och koder D3:1 Digitala kursmoment D1 Boolesk algebra D2 Grundläggande logiska funktioner D3 Binära tal, talsystem och koder Styrteknik :Binära tal, talsystem och koder
Health café. Self help groups. Learning café. Focus on support to people with chronic diseases and their families
 Health café Resources Meeting places Live library Storytellers Self help groups Heart s house Volunteers Health coaches Learning café Recovery Health café project Focus on support to people with chronic
William J. Clinton Foundation Insamlingsstiftelse REDOGÖRELSE FÖR EFTERLEVNAD STATEMENT OF COMPLIANCE
 N.B. The English text is an in-house translation. William J. Clinton Foundation Insamlingsstiftelse (organisationsnummer 802426-5756) (Registration Number 802426-5756) lämnar härmed följande hereby submits
Questionnaire for visa applicants Appendix A
 Questionnaire for visa applicants Appendix A Business Conference visit 1 Personal particulars Surname Date of birth (yr, mth, day) Given names (in full) 2 Your stay in Sweden A. Who took the initiative
The Municipality of Ystad
 The Municipality of Ystad Coastal management in a local perspective TLC The Living Coast - Project seminar 26-28 nov Mona Ohlsson Project manager Climate and Environment The Municipality of Ystad Area:
Hållbar utveckling i kurser lå 16-17
 Hållbar utveckling i kurser lå 16-17 : Jag tillhör akademin / My position is in the School of Jag tillhör akademin / My position is in the School of Humaniora och medier / Humanities and Media Studies
FOI MEMO. Jonas Hallberg FOI Memo 5253
 Projekt/Project Security culture and information technology Projektnummer/Project no Kund/Customer B34103 MSB Sidnr/Page no 1 (5) Handläggare/Our reference Datum/Date Jonas Hallberg 2015-01-21 FOI Memo
Här kan du sova. Sleep here with a good conscience
 Här kan du sova med rent samvete Sleep here with a good conscience MÅNGA FRÅGAR SIG hur man kan göra en miljöinsats. Det är egentligen väldigt enkelt. Du som har checkat in på det här hotellet har gjort
Alla Tiders Kalmar län, Create the good society in Kalmar county Contributions from the Heritage Sector and the Time Travel method
 Alla Tiders Kalmar län, Create the good society in Kalmar county Contributions from the Heritage Sector and the Time Travel method Goal Bring back the experiences from the international work of Kalmar
Kurskod: TAMS28 MATEMATISK STATISTIK Provkod: TEN1 05 June 2017, 14:00-18:00. English Version
 Kurskod: TAMS28 MATEMATISK STATISTIK Provkod: TEN1 5 June 217, 14:-18: Examiner: Zhenxia Liu (Tel: 7 89528). Please answer in ENGLISH if you can. a. You are allowed to use a calculator, the formula and
Att utveckla och skapa en effektiv och dynamisk process för konsolidering och rapportering
 Ulla-Britt Fagerström - Senior lösningsspecialist, IBM Business Analytics 22 maj 2013 Att utveckla och skapa en effektiv och dynamisk process för konsolidering och rapportering Då kan drömmar gå i uppfyllelse
Kundfokus Kunden och kundens behov är centrala i alla våra projekt
 D-Miljö AB bidrar till en renare miljö genom projekt där vi hjälper våra kunder att undersöka och sanera förorenad mark och förorenat grundvatten. Vi bistår dig som kund från projektets start till dess
Ecotaxes in MALTA. 12th of October 2005 BERLIN MALTA
 Ecotaxes in 12th of October 2005 BERLIN INTRODUCTION Malta INTRODUCTION Environment gaining prominence on political agenda Basic legislative framework to enable the implementation of the Polluter Pays
Matthew Thurley Industriell bildanalys (E0005E) Response rate = 65 %
 Response rate = 65 %") Matthew Thurley Industriell bildanalys (E000E) Response rate = % Survey Results Legend Relative Frequencies of answers Std. Dev. Mean Question text Left pole % % Right pole n=no. of responses av.=mean
Matthew Thurley Industriell bildanalys (E000E) Response rate = % Survey Results Legend Relative Frequencies of answers Std. Dev. Mean Question text Left pole % % Right pole n=no. of responses av.=mean
Nordic Casemix Centre (NCC) (Nordiskt center för patientgruppering r.f)
 (Nordiskt center för patientgruppering r.f)") Nordic Casemix Centre (NCC) (Nordiskt center för patientgruppering r.f) Mona Heurgren Chair of Board NCC Head of Unit Unit for development of Quality and Efficiency Studies The National Board of Health
Nordic Casemix Centre (NCC) (Nordiskt center för patientgruppering r.f) Mona Heurgren Chair of Board NCC Head of Unit Unit for development of Quality and Efficiency Studies The National Board of Health
Custom-made software solutions for increased transport quality and creation of cargo specific lashing protocols.
 Custom-made software solutions for increased transport quality and creation of cargo specific lashing protocols. ExcelLoad simulates the maximum forces that may appear during a transport no matter if the
Beijer Electronics AB 2000, MA00336A, 2000-12
 Demonstration driver English Svenska Beijer Electronics AB 2000, MA00336A, 2000-12 Beijer Electronics AB reserves the right to change information in this manual without prior notice. All examples in this
Tunga metaller / Heavy metals ICH Q3d & Farmakope. Rolf Arndt Cambrex Karlskoga
 Tunga metaller / Heavy metals ICH Q3d & Farmakope Rolf Arndt Cambrex Karlskoga Tunga metaller / Heavy metals Rolf Arndt -Quality Assurance Cambrex Karlskoga - Svenska Farmakopekommitten / Working Party
EVALUATION OF ADVANCED BIOSTATISTICS COURSE, part I
 UMEÅ UNIVERSITY Faculty of Medicine Spring 2012 EVALUATION OF ADVANCED BIOSTATISTICS COURSE, part I 1) Name of the course: Logistic regression 2) What is your postgraduate subject? Tidig reumatoid artrit
Kursplan. AB1029 Introduktion till Professionell kommunikation - mer än bara samtal. 7,5 högskolepoäng, Grundnivå 1
 Kursplan AB1029 Introduktion till Professionell kommunikation - mer än bara samtal 7,5 högskolepoäng, Grundnivå 1 Introduction to Professional Communication - more than just conversation 7.5 Higher Education
3rd September 2014 Sonali Raut, CA, CISA DGM-Internal Audit, Voltas Ltd.
 3rd September 2014 Sonali Raut, CA, CISA DGM-Internal Audit, Voltas Ltd. Role and responsibility of Internal Audit Sharing of best practices Model of operation In conduct of audit assignment Other functions
SVENSK STANDARD SS :2010
 SVENSK STANDARD SS 8760009:2010 Fastställd/Approved: 2010-03-22 Publicerad/Published: 2010-04-27 Utgåva/Edition: 2 Språk/Language: svenska/swedish ICS: 11.140 Sjukvårdstextil Sortering av undertrikå vid
Preschool Kindergarten
 Preschool Kindergarten Objectives CCSS Reading: Foundational Skills RF.K.1.D: Recognize and name all upper- and lowercase letters of the alphabet. RF.K.3.A: Demonstrate basic knowledge of one-toone letter-sound
Surfaces for sports areas Determination of vertical deformation. Golvmaterial Sportbeläggningar Bestämning av vertikal deformation
 SVENSK STANDARD SS-EN 14809:2005/AC:2007 Fastställd/Approved: 2007-11-05 Publicerad/Published: 2007-12-03 Utgåva/Edition: 1 Språk/Language: engelska/english ICS: 97.220.10 Golvmaterial Sportbeläggningar
Accomodations at Anfasteröd Gårdsvik, Ljungskile
 Accomodations at Anfasteröd Gårdsvik, Ljungskile Anfasteröd Gårdsvik is a campsite and resort, located right by the sea and at the edge of the forest, south west of Ljungskile. We offer many sorts of accommodations