R Project SAFE. Radionuclide release and dose from the SFR repository. M Lindgren, M Pettersson Kemakta Konsult AB
|
|
|
- Ann-Charlotte Bergman
- för 6 år sedan
- Visningar:
Transkript
1 R--8 Project SAFE Radionuclide release and dose from the SFR repository M Lindgren, M Pettersson Kemakta Konsult AB S Karlsson Studsvik Eco & Safety AB L Moreno Department of Chemical Engineering and Technology, Royal Institute of Technology October 2 Svensk Kärnbränslehantering AB Swedish Nuclear Fuel and Waste Management Co Box 5864 SE-2 4 Stockholm Sweden Tel Fax
2 ISSN SKB Rapport R--8 Project SAFE Radionuclide release and dose from the SFR repository M Lindgren, M Pettersson Kemakta Konsult AB S Karlsson Studsvik Eco & Safety AB L Moreno Department of Chemical Engineering and Technology, Royal Institute of Technology October 2 This report concerns a study which was conducted for SKB. The conclusions and viewpoints presented in the report are those of the author(s) and do not necessarily coincide with those of the client.
3 Summary The objective of this report is to describe the radionuclide release and dose calculations for the SFR repository within the SAFE study. A number of calculation cases for quantitative analyses have been defined based on the expected development of the conditions in the repository, rock and biosphere for a base scenario and for other scenarios. In this study three cases are analysed within the base scenario to illustrate the expected development in the near field, i.e. the vaults and Silo including the waste and technical barriers. The main case with intact barriers, a variation case with degraded technical barriers after years and a variation case with influence of gas. The variation case with influence of gas is presented in Moreno et al. (2). The influence of the surrounding rock on the release of radionuclides is illustrated with two cases; included or neglected geosphere. Changes in discharge points and ecosystems in the biosphere are studied by calculation of human dose for a reasonable biosphere development, two variations of the development of the ecosystem (mire and well) as well as today's biosphere during the whole time period. The reasonable case assumes that the release of radionuclides from the time for repository closure until 5 AD is to a coast recipient that corresponds to a part of the present Öregrundsgrepen. The ongoing land rise will decrease the size of Öregrundsgrepen with time. For the time period 4 AD to 5 AD the water volume and water turn over is thus assumed to be less than today. At 5 AD the radionuclides are released to a lake that is developed in the area. This lake will remain as recipient until 8 AD where after the radionuclides are assumed to be released to agricultural land until 2 AD. In addition to the base scenario, calculations are performed for some other scenarios. The other scenarios include; initially degraded barriers, influence of chemicals, a combined effect of degraded barriers and influence of chemicals, permafrost and human intrusion. The result for the base scenario with intact barriers and a reasonable biosphere development is an initial dose of about -8 Sv/yr determined by 37 Cs released from BLA. The maximum total dose for the whole SFR repository is 4-6 Sv/yr at 5 AD totally dominated by organic 4 C from the Silo. The maximum dose if the release occurs to a mire area is 6-6 Sv/yr. The dose is initially dominated by 239 Pu and 24 Pu from BLA and later by 79 Se. The maximum dose if the release occurs to a well with a recharge area from all vaults is 4-4 Sv/yr. The dose is totally dominated by 239 Pu and 24 Pu from BLA. The alternative well with a recharge area from the Silo results in a maximum dose of 5-5 Sv/yr, dominated by organic 4 C. In the case with release to today's biosphere the maximum dose is obtained directly after repository closure from release of 37 Cs from BLA at a level of -8 Sv/yr. The case with degraded technical barriers results in a maximum dose for SFR for all studied biospheres that is up to a factor three higher than that for intact barriers. The largest increase in dose is obtained for release from the Silo to mire. 3
4 Sammanfattning Syftet med denna rapport är att beskriva radionuklidtransport- och dosberäkningarna för SFR inom SAFE studien. För den kvantitativa analysen har ett antal beräkningsfall definierats baserat på den förväntade utvecklingen av förhållandena i förvaret, omgivande berg och biosfären för ett basscenario och för övriga scenarier. I denna studie analyseras tre fall inom basscenariot för att illustrera den förväntade utvecklingen i närzonen, bergsalarna och Silon inklusive avfall och tekniska barriärer. Huvudfallet med intakta barriärer, ett variationsfall med degraderade tekniska barriärer efter år och ett variationsfall med inverkan av gas. Variationsfallet med inverkan av gas presenteras i Moreno et al. (2). Inverkan av det omgivande berget på radionuklidutsläppet illustreras i två beräkningsfall, inkluderad eller försummad geosfär. Förändringar i utsläppspunkt och ekosystem i biosfären studeras i beräkningarna av dos till människa för en rimlig biosfärsutveckling, två alternativa utvecklingar av ekosystemet (myr och brunn) liksom dagens biosfär för hela tidsperioden. I det rimliga fallet antas att utsläppet av radionuklider från förvarets förslutning till 5 AD sker till en kustrecipient som motsvarar en del av den nuvarande Öregrunsgrepen. Den pågående landhöjningen medför att storleken på Öregrundsgrepen minskar med tiden. För tidsperioden 4 AD till 5 AD antas därför att vattenvolymen och vattenomsättningen är mindre än idag. Det antas vidare att en sjö har bildats i området och att denna sjö utgör recipient för utsläpp av radionuklider mellan 5 ADoch 8 AD. Från 8 AD till och med 2 AD släpps nukliderna ut till ett jordbruksområde. Beräkningar har förutom för basscenariot genomförts för ett antal övriga scenarier. Dessa scenarier omfattar initialt degraderade barriärer, inverkan av kemikalier, en kombinerad effekt av degraderade barriärer efter år och kemikalier, permafrost och slutligen ett intrångsscenario. Resultatet för basscenariot med intakta barriärer och en rimlig biosfärsutveckling är en initial dos på ungefär -8 Sv/år som domineras av utsläpp av 37 Cs från BLA. Den totala maximaldosen för utsläpp från hela SFR är 4-6 Sv/år vilket erhålls år 5 AD. Dosen domineras totalt av utsläppet av organiskt 4 C från Silon. Om utsläppet istället sker till ett myrområde erhålls en maximal dos på 6-6 Sv/år. Dosen domineras till en början av 239 Pu och 24 Pu från BLA och senare av 79 Se. Utsläpp av radionuklider från de fyra bergsalarna till en brunn ger som mest en totaldos på 4-4 Sv/år, vilken domineras helt och hållet av utsläpp av 239 Pu och 24 Pu från BLA. Motsvarande utsläpp från Silon ger en maximal totaldos på 5-5 Sv/år dominerad av organiskt 4 C. Vid utsläpp till dagens biosfär erhålls den maximala dosen omedelbart efter förvarets förslutning. Den maximala dosen är ungefär -8 Sv/år och domineras av 37 Cs från BLA. Beräkningsfallet med degraderade tekniska barriärer ger en maximal dos för hela SFR för alla studerade biosfärer som är upp till tre gånger högre än för fallet med intakta barriärer. Den största ökningen i dos erhålls för utsläpp från Silon till en myr. 5
5 Contents Page Introduction 9. Background 9.2 Objective 9.3 Structure of report 2 Description of calculation cases 2. Choice of calculation case 2.2 Base scenario - Near field Main case - intact barriers Fractured/degraded barriers Base scenario - Geosphere Base scenario - Biosphere Reasonable biosphere development Release to a mire area Release to a well Release to today's biosphere Other scenarios Initial defects Climate - Permafrost Human activity - Well in the repository 2 3 Models Computer codes Near-field code, NUCFLOW Far-field code, FARF Biosphere model Model descriptions Silo BMA BTF BTF BLA 34 4 Basic assumptions Premises Near-field data Radionuclide inventory Physical and chemical data Hydrological data Far-field data Biosphere data 42 5 Results - Base scenario Silo Intact barriers 44 7
6 5..2 Degraded barriers BMA Intact barriers Degraded barriers BTF Intact barriers Degraded barriers BTF Intact barriers Degraded barriers BLA 69 6 Results - Other scenarios Initially degraded barriers Chemicals Silo BMA BTF BTF Permafrost 6.4 Human intrusion 7 Summary of results 3 7. Base scenario Intact barriers Degraded barriers Initially degraded barriers Chemicals Far field Permafrost Human intrusion Summary of doses References Appendices Appendix A: Check of screening of radionuclides Appendix B: Discretization in near-field models Appendix C: Examples of input files for near-field calculations Appendix D: Biosphere models 8
7 Introduction. Background Differences between this study and older studies of SFR that influences the calculations and results of radionuclide release are: The waste inventory has been updated, based on new detailed information of produced and planned waste (Riggare and Johansson, 2). The total activity content is unchanged, 6 Bq, but the distribution between different nuclides is different. The radionuclide inventory is given in detail, i.e. in each waste package instead of in each repository part only. This implies a possibility to describe the radionuclide release better. New hydrogeological calculations (Holmén and Stigsson, 2a) result in a more detailed description of the water flow inside the repository parts. The water flow rates inside the repository are lower in this study, since they were chosen very pessimistic in the older studies due to the lack of detailed information. Although the new near-field calculations are complex and many input parameters are changed the decrease in water flow is one of the main reasons to the lower near-field release rates for most calculation cases compared to the previous studies. All input data (SKB, 2a) have been thoroughly reviewed and many small changes were performed compared to older studies. Of major importance in the near field is decreased sorption capacity for nickel. The near-field model set up to describe the release is made more complex, to be able to include the more detailed information on the inventory and water flow. This model may be seen as a somewhat simplified three-dimensional model. Older studies (Wiborgh et al., 987; Lindgren and Pers, 99) were performed with a model describing different release path separately. The discretizations were finer in the transport direction in the older models. The performed changes imply a better description of influence between different release paths but a poorer description of the instationary diffusion. In this study far-field calculations were performed for all cases. In older studies simplified calculations for selected nuclides have been performed (Neretnieks et al., 987). For the biosphere calculations the most evident difference from earlier studies is the construction of a case where the ecosystems in the area changes with time as a consequence of the land rise (here called reasonable biosphere development). This approach also includes later releases of radionuclides accumulated in sediments. In the earlier study two separate cases coast and inland were modelled, without interaction.2 Objective The objective of this report is to describe the radionuclide release and dose calculations for the SFR repository within the SAFE study. The information used in the calculations is documented and the results are presented. The aims of the radionuclide release calculations are to quantitatively describe the radionuclide transport and to analyse the effect of different scenarios on the environment during years after repository closure, both in the near field and biosphere. 9
8 By performing several calculation cases for each repository part, enough knowledge and understanding are achieved to fulfil these aims..3 Structure of report The different calculation cases are described in Chapter 2 and the computer codes and the compartment models in Chapter 3. The input data used are summarised in Chapter 4. The results for the near field, far field and biosphere are presented in Chapter 5 for the base scenario and in Chapter 6 for the other scenarios. The base scenario comprises a main case and a case with degraded barriers. Other scenarios treat influence of chemicals, permafrost and human intrusion. A summary of the results is presented in Chapter 7.
9 2 Description of calculation cases 2. Choice of calculation case A number of calculation cases for quantitative analyses have been defined based on the expected development of the conditions in the repository, rock and biosphere for the base scenario and for the other scenarios. The expected evolution of the repository system, the scenario analysis and the selection of calculation cases are given in the scenario report (SKB, 2b). The aim is that the calculation cases will consider the expected development and the uncertainties connected to it, both concerning processes and events that influences the state of the system and quantitative data that describe these states. The uncertainties are illustrated by analysing different calculation cases for the base scenario in combination with pessimistic choice of the parameter values used in the calculations. A schematic description of the calculation cases is shown in Figure 2- and a short summary is given in Table 2-. Three cases are analysed within the base scenario to illustrate the expected development in the near field, i.e. the vaults and Silo including the waste and technical barriers. The influence of the surrounding rock on the release of radionuclides is illustrated with two cases; included or neglected geosphere. Changes in discharge points and ecosystems in the biosphere are studied by calculation of human dose for a reasonable biosphere development, two variations of the development of the ecosystem as well as today's biosphere during the whole time period. Figure 2-. Schematic description of the calculation cases.
10 Table 2-. Summary of the calculation cases. Scenario/Calculation case Base scenario Main case (intact barriers) Influence of gas Degraded technical barriers Description All technical barriers fulfil the specifications of the construction at closure. Constant properties during the whole time period. Water flow in the near field influenced by the ongoing land rise. Dose to human for a reasonable biosphere development that imply release of radionuclides to Öregrundsgrepen during the time period 2 AD to 5 AD, release to a lake during the period 5 AD to 8 AD and release to agricultural land during the period 8 AD to 2 AD. Dose consequence also for the alternatives with release of radionuclides to a well downstream the repository from 4 AD to 2 AD, release of radionuclides to a mire area from 4 AD to 2 AD and for release to Öregrundsgrepen with today's conditions during the whole time period. Expelled water containing radionuclides from the near field barriers due to gas produced in the near field. Other conditions as in the case "intact barriers". (not included in this report, see Moreno et al., 2) Conditions as in the case "intact barriers" during the time period 2 AD to 3 AD. Fractured/degraded barriers in the near field implies changed flow conditions in the near field from 3 AD until 2 AD. Other conditions in the near field, geosphere and biosphere as in the case "intact barriers". Other scenario: Initial defects Fracture in the concrete Fracture(s) in the concrete barriers at repository closure that structure increase the water flow through the technical barriers in comparison to the case "intact barriers" in the Base scenario. Other conditions as in the case "intact barriers". Fracture in the concrete structure and gas Chemicals/complexing agents Chemicals/complexing agents and degraded barriers Other scenario: Climate Permafrost Other scenario: Human activity Well in the repository Water containing radionuclides expelled through fracture(s) in the concrete barriers due to gas produced in the near field. Other conditions as in the case " Fracture in the concrete structure". (not included in this report, see Moreno et al., 2) Considerably poorer sorption in the technical barriers in the near field. Other conditions as in the case "intact barriers" in the Base scenario. Considerably poorer sorption in the technical barriers in the near field. Other conditions as in the case "degraded technical barriers" in the Base scenario. Frozen repository until 2 AD when radionuclide release occurs with the total flow through the different repository parts. Dose consequence with today's biosphere, Öregrundsgrepen. A well is sunk in the repository earliest when the shoreline passes by the repository area, i.e. earliest at 3 AD. Immediate dose consequence from ingestion. The long term dose consequence caused by the well are changed flow conditions, but otherwise same conditions as in the case "intact barriers" in the Base scenario. 2.2 Base scenario - Near field The aim of the calculations for the base scenario is to show the ability of the repository to prevent radionuclide release from the waste, taking the future changes in barrier properties and other conditions into consideration. To fulfil this purpose a main case and 2
11 two variation cases have been defined. The purpose of the variation cases is to illustrate the consequence of possible but more uncertain and not in detailed studied processes. One variation case show the consequence of water containing radionuclides expelled by gas formed in the repository. The other case shows the influence of an extensive degradation of the technical barriers with time. A general description of transport processes, barrier properties and other conditions taken into consideration in the different cases is given below. A more detailed description is given in the report describing the scenario and system analysis (SKB, 2b) Main case - intact barriers One of the prerequisites of the base scenario is that the properties of all technical barriers fulfil the requirements at repository closure. This implies that concrete floor, walls and lid in the different repository parts do not contain large intersecting fractures. The same concerns the porous concrete or concrete grout surrounding the waste packages. Small fractures in the concrete may be formed due to stress in the material. Bentonite and sand/bentonite barriers in the Silo are assumed to be homogeneous. The concrete moulds and concrete tanks are supposed to be almost intact at closure, i.e. they do not contain large intersecting fractures. Steel packagings may very well be tight at closure, but there might also be damages caused during the operational period, for example due to corrosion. Steel packagings are therefore not considered as barriers for water and dissolved radionuclides. After closure groundwater will flow into the different repository parts from the surrounding rock and fill up pore volumes and empty space in the repository. The time from repository closure to a water filled repository is rather short, some few years for the vaults and some ten years for the Silo (Holmén and Stigsson, 2a). In the calculations the time to fill the repository is neglected and a water filled repository is assumed to prevail immediately after repository closure. When water flows into the different repository parts and come into contact with the waste the radionuclides in the waste dissolves in the water. Limitations in the solubility and availability in the waste will delay the dissolution and thereby influence the concentration of radionuclides in the water in contact with the waste. Dissolved radionuclides are thereafter transported through the waste matrix, walls of waste packages and surrounding concrete, bentonite and gravel barriers out from the different repository parts. The transport occurs by diffusion and with the water that flows in the different barriers but the release is delayed by sorption in the barrier materials. The quantity of the radionuclides that are released from the different repository parts is thus dependent on the concentration of radionuclides in the water in contact with the waste, on the diffusion and sorption properties of the barrier materials and on the size and distribution of the water flow in the barriers and how these change with time. No limits in solubility or availability to dissolve in the water in contact with the waste are taken into account for the nuclides. However, the calculations take into account a certain time for the release of radionuclides in waste stabilised in bitumen. The release of radionuclides from a bitumen matrix is insignificant unless a network of pores or fractures is formed in the matrix. Such a network can be formed by several mechanisms (Pettersson and Elert, 2). Once an opening to the surface of the matrix is established the radionuclides dissolve in the water filled pores or fractures and are released from the matrix by diffusion. This is a complicated course of events that is difficult to quantify, but a conservative estimate is that it will take at least years before all nuclides in a bitumen matrix are dissolved. In the calculations it is therefore assumed that one percent 3
12 of the initial radionuclide content in the waste is released from the bitumen matrix every year. The resistance to diffusion and flow in the barriers depends on their porosity as well as the presence of fractures in the materials. Due to chemical reactions between the barrier material and components in the water these properties will change with time. Analysis performed indicate only small changes in the concrete barriers, even after long time (Höglund, 2). In the calculations it is assumed that there are no changes of the fractures or porosity with time. Instead, values chosen on porosity, diffusion coefficient and hydraulic conductivity represent materials with the expected increase in porosity with time and small fractures in the concrete barriers already from repository closure. The properties of the bentonite barriers will also change with time due to chemical reactions and the possibility exists that the concrete barriers may crack due to mechanical impact, from for example increased pressure from gas production. These mechanisms have not been studied in detailed within the SAFE project. Possible consequences of this type of degradation are difficult to define but are illustrated separately as a variation case, fractured/degraded barriers, to the main case. Size and direction of the water that flows through the different repository parts and their barriers will change with time even if the hydrological properties are constant. This is due to the land rise and its influence on the groundwater flow in the surrounding rock. In the calculations this is simulated by stepwise changes of size and direction of the flow in accordance with the results from the hydrogeological calculations in the detailed model (Holmén and Stigsson, 2a). Size and direction of the flow calculated for the time 2 AD is assumed to be valid from repository closure to 3 AD. At this time the size and direction of the flow are changed according to the hydrogeological calculations at 3 AD. Stepwise changes are performed in the same way at 4 and 5 AD but since only small changes are expected for longer times stationary flow conditions is assumed to prevail from 5 AD and ahead. The transport of radionuclides in the near field will be delayed by sorption in cement and concrete as well as in bentonite barriers and gravel backfill. In cement and concrete barriers the penetrating water will quickly obtain a high ph, and the ion strength will be high since the penetrating water is salt and concrete contribute with dissolved salts. With time the leakage of cement components may result in some decrease in ph and ion strength in cement and concrete barriers, but alkaline conditions will be maintained during long time. The expected decrease in ph is not judged to influence the sorption in the cement and concrete barriers negatively but decreased ion strength will increase the sorption of elements like caesium and strontium that sorb by ion exchange. Therefore the sorption data is chosen to be representative for fresh cement and concrete with a high ph and high ion strength for the whole time period. The water in the bentonite barriers and gravel backfill will at repository closure have ph and ion strength more in accordance with the penetrating groundwater. Leaching of concrete components will give rise to an increase in ph with time and also change the chemical composition of the solid materials. These processes have not been analysed, but they are not expected to decrease the sorption in comparison with the sorption in these materials at repository closure. The reason for that is that an increase in ph favours the sorption and that the secondary minerals formed in contact with alkaline water are mostly good sorbents. Therefore sorption data for gravel backfill and bentonite barriers representative for a saline groundwater are chosen and these are assumed to be valid for the whole studied time period. The future change from saline to 4
13 non-saline groundwater is neglected since this only implies sorption of elements that sorb via ion exchange and thereby increase the sorption capacity for them. Products from corrosion of iron and steel are not taken into account as sorption barrier despite that there is strong evidence that iron oxides and iron hydroxides bind many elements. Reported sorption data in the literature given as Kd-values are for many nuclides as high and in some cases higher than for sorption on cement and concrete (Savage et al., 2). Sorption on corrosion products can thus be of importance for the release of radionuclides from the near field, especially from BLA that does not have concrete barriers. The waste contains chemicals that may form complex with the radionuclides and thereby influence the sorption of the radionuclides. Cellulose in the waste and as additive in cement and concrete may through alkaline degradation form isosaccarinic acid (ISA) that is a strong complexing agent. Based on estimated amounts of chemicals and cellulose materials in different waste types in SFR the concentrations of complexing agents inside the waste packages have been calculated (Fanger et al., 2). This shows that the concentration of complexing agents inside the waste packages for a few waste types can be so high that it can not be disregarded that sorption inside the packages can be influenced. The highest concentrations of ISA are obtained in the waste packages with bitumenised waste in steel packaging, but these are, however, not treated as a sorption barrier anyway. Fanger and co-workers also show that there are a few waste types with cement stabilised waste where the concentration of ISA is of the same level as the threshold concentration ( -4 M) where ISA may lead to a small reduction in sorption of fourvalent and pentavalent elements in the cement matrix. Any influence on the sorption of these elements in mould walls or other concrete barriers outside the cement matrix at this low concentration of ISA seems not especially likely. The reason for this is that the ISA formed will to a large extent be kept inside the cement matrix since ISA itself sorb on cement. In addition there are experiments that indicate that lower concentrations of ISA do not influence sorption of elements in complexes with ISA. There are also chemicals within the waste that may act as complexing agents. Two of these (EDTA and sodium capryliminodipropionat, NKP) give concentrations inside the waste packages of a few waste types that may imply a reduction of the sorption of Ni and chemically analogue divalent elements in the waste matrix with cement. Regarding the expected small effects from complexing agents on the sorption and that the data representing the sorption in the system without complexing agents are already conservatively chosen, the possible effects from complexing agents are neglected in the base scenario. The presence of high concentrations of complexing agents may however be of importance for the safety of the repository. Thus this is illustrated as an initial defect scenario where the presence of complexing agents result in a considerable reduction of the sorption in the near field barriers. This case is further described in Section Despite complexing agents, colloids in water may reduce the delay of radionuclides in the near field barriers. Radionuclide transport with colloids in the near field is neglected due to the expected low concentrations of colloids in near-field water with such high concentrations of salt. 5
14 2.2.2 Fractured/degraded barriers The performed analysis on the future chemical degradation of the concrete barriers in SFR show only small changes even after long times (Höglund, 2). There are, however, other processes that have not been studied in detail that may influence the barrier properties in the long term. Concerning cement and concrete barriers it is mainly mechanisms that can change the transport properties by causing fractures that need to be considered. Examples of such mechanisms are pressure build-up due to gas production, pressure from expanding corrosion products and stress in the materials caused by settlements and movements in the system. These types of changes can increase the hydraulic conductivity in cement and concrete barriers and also form preferential transport paths for the radionuclides. The properties of bentonite barriers can also change, especially through chemical reactions with cement components. The performed analysis that has been made shows that rather fast ion exchange may occur in sand/bentonite. Chemical transformations of bentonite caused by high ph are also possible. This type of chemical transformations can imply reduced hydraulic properties in the bentonite barriers with time. The sorption properties are probably not negatively influenced since the minerals that can be formed, for example CSH phases, are as good sorbents as the original minerals. The effect of deteriorating hydraulic properties with time in cement and concrete barriers as well as in bentonite barriers is illustrated in a variation case within the base scenario. Since the lapse of time for the degradation of the barriers is unknown it is assumed that the degeneration occur momentarily years after repository closure, i.e. at 3 AD. For the Silo the same conditions are assumed as in the base case despite other water flows through the Silo barriers from 3 AD and further on. The size and direction of this water flow from 3 AD and further on are given by the hydrogeological modelling in the detail scale with increased hydraulic conductivity in the barriers compared to the main case (Holmén and Stigsson, 2a). Also for BMA all conditions are assumed to be the same as in the main case except changed water flows from 3 AD and further on. At this point the concrete walls in one room, room 2, closest to the fracture zone 6, are degraded. The size and direction of the water flow in different parts of BMA with degraded walls was calculated with the hydrogeological model in the detail scale and the results for year 3 AD and further on are used in the calculations of the radionuclide release from the near field. No calculations are performed for the radionuclide release from the BTF vaults in the case with degraded barriers after years. However an estimate is performed on possible changes based on calculated changes of the water flow. 2.3 Base scenario - Geosphere Radionuclides transported out from the technical barriers in the different repository parts are transported further in the rock by the flowing water. The transport occurs mainly by advection in the open fractures in the rock. The ability of the rock to delay and thereby through decay reduce the release of radionuclides to the recipients in the biosphere compared to the release from the near field depend upon the so called transport resistance (see for example Andersson et al., 998). The transport resistance is determined by the size of the groundwater flow, the travel distance and the exchange of radionuclides between the flowing water and the rock matrix. 6
15 The ongoing land rise displaces the shoreline and thus both the travel distance and the groundwater flow change with time. The effect of that on the transport and delay of radionuclides are, however, relatively limited. Two simplified cases are illustrated. In one case, it is assumed that the release occur directly from the near field to the recipient in the biosphere. This pessimistic case is based on the expected low transport resistance during the first to 2 years after repository closure as well as uncertainties in parameters that quantifies transport and processes that may reduce travel times, for example transport with colloids and microbes. In the other case the time dependence of the transport resistance is neglected and the influence of the rock on the release of radionuclides is illustrated with constant values on the migration parameters included in the model. The hydrogeological parameter values are chosen based on the results from the groundwater flow modelling and with the purpose that the chosen values as far as possible are valid for all repository parts during the whole time period. 2.4 Base scenario - Biosphere To calculate the distribution of radionuclides in the biosphere and the dose to human four different cases have been defined. The reasonable development of the biosphere is based on the expected development of the biosphere and future changes of the discharge area for the groundwater passing the repository. In addition cases with a mire area and a well are studied to illustrate uncertainties in discharge areas and biosphere development. To show the influence of the repository independent of changes in the biosphere one case is where today's biosphere is assumed to prevail during the whole time period. A more detailed description of the calculations of the migration of radionuclides in the different ecosystems and the different exposure pathways to human that are included in the calculations of dose is given in Karlsson et al., (2) Reasonable biosphere development The reasonable case assumes that the release of radionuclides from the time for repository closure until 5 AD is to a coast recipient that corresponds to a part of the present Öregrundsgrepen. In the calculations the same conditions as today is assumed to prevail until 4 AD. The ongoing land rise will decrease the size of Öregrundsgrepen with time. For the time period 4 AD to 5 AD the water volume and water turn over is thus assumed to be less than today. At 5 AD the radionuclides are released to a lake that is developed in the area. This lake will remain as recipient until 8 AD. At that point the lake has grown into wet-land and mire areas has developed. After 8 AD these areas are assumed to be drained and used as agricultural land until 2 AD. This reasonable biosphere development is schematically described in Figure 2-2. Coastal recipient Today s conditions Smaller recipient Lake Agricultural land 2 AD 3 AD 4 AD 5 AD 8 AD 2 AD Figure 2-2. Schematic description of the reasonable biosphere development. Radionuclides released to the Öregrundsgrepen are assumed to be distributed between the water phase and suspended material in the water. The water turnover in 7
16 Öregrundsgrepen imply that both dissolved radionuclides and radionuclides in suspended matter are spread over the whole water volume and further out in the Baltic Sea. The suspended matter with its content of radionuclides can settle as sediment and the nuclides can accumulate in deeper sediments but also move up to the water phase again. Vegetation in the water can take up radionuclides from the water while fish take up radionuclides both directly from the water and through contaminated food. Cattle that graze on the edge of the water can take up radionuclides by eating water vegetation and drink water. Humans are exposed for radionuclides by eating meat and drinking milk from cows that have been grazing at the shore and by eating fish from the area. Radionuclides released to the lake can in the same way as in the coastal model be distributed between the water phase and suspended matter in the water. Dissolved radionuclides and radionuclides on suspended matter can also leave the system through discharge from the lake. Radionuclides on the suspended matter can settle on sediments and, if not resuspended to the water phase, become accumulated in deeper sediments as a consequence of burial of fresh sediment. In the same way as in the coastal model radionuclides can be taken up by fish and water vegetation. Cattle grazing on the shores may take up radionuclides by eating water vegetation and drinking water from the lake. In contrast to the coastal model it is assumed in the lake model that humans take water from the lake both as drinking water and to irrigate a garden plot where vegetables and root crops are grown. Radionuclides in the irrigation water are thus directly transferred to the upper soil layer in the garden plot but also to some extent directly to the crop surfaces through the water droplets that are maintained on the leaves and other vegetation parts above the ground. Vegetables and root crops growing in the garden may, through root uptake, take up the radionuclides in the upper soil layer but also bring back radionuclides to the upper soil by mouldering. At the same time an exchange between the upper and the deeper soil layers occur through processes like infiltration and bioturbation. Radionuclides in the deeper soil layers may also leak back to the lake and radionuclides in the upper soil layer may both return to the lake and leave the system through erosion. Humans in the area can be exposed to radionuclides in the system by eating fish from the lake and by consumption of meat and milk from the cattle that grazes at the shores and drink water from the lake. In addition, exposure occurs through drinking water that is taken from the lake and through consumption of vegetables and root crops grown in the garden plot. Exposure via consumption of a small amount of soil, which is unintentionally eaten because of e.g. insufficiently washed vegetables, are also considered. Humans in the area can also be exposed by inhalation of contaminated soil particles in the air. In addition, it is assumed that working at the garden plot imply external exposure from the radionuclides in the soil. The discharge area is changed to agricultural land at 8 AD. The radionuclides are then supplied with the groundwater flowing in the saturated zone. These radionuclides can be transported up to the soil layer above through capillary forces, root uptake and through diffusion during dry periods while infiltration transports the radionuclide in the opposite direction during wet periods. Besides the radionuclides supplied with the groundwater the radionuclides accumulated in the sediments during the earlier coastal and lake periods are movable in the same way as the radionuclides in the groundwater. The concentration of radionuclides in the water phase is influenced by sorption on the solid materials. Radionuclides are transported out from the system with groundwater that leaves the system and due to erosion in the upper soil layer. 8
17 Radionuclides in the upper soil layer are available for root uptake and may be transferred to crops cultivated in the area in form of cereals, root crops and vegetables. Part of the area is also used as pasturage for cattle. Humans are exposed to these radionuclides by eating the crops and by eating meat and drinking milk from cattle fed with crops and grass grown in the area. In addition exposure by unintentional intake of contaminated soil particles left on vegetables are also considered. Inhalation of contaminated soil particles as well as external exposure when working on the field are also included Release to a mire area This case is chosen to illustrate the uncertainty of discharge area for water and radionuclides and other uncertainties in future biosphere conditions. The reasonable biosphere development is based on a prognosis that shows that the discharge area will follow the shoreline. In this case it is instead assumed that the radionuclides are discharged into a mire area from year 4 AD until 2 AD. Radionuclides released into the mire area are distributed between the water phase and solid material. Out transport of radionuclides from the system occurs by water leaving the system from the layer close to the ground surface. It is assumed that peat from the mire area is used as soil improvement and as fuel in one household. The cultivated crops are taking up radionuclides from the peat and humans are exposed by consumption of the crops as well as meat and milk from cattle fed with the crops. In addition exposure is assumed to occur through inhalation of peat particles that are present in the air and through inhalation of the exhaust gas from peat combustion. External exposure from the mire area during outdoor staying in the area is also included Release to a well The well case illustrates the consequences of release of radionuclides to a well that some time in the future is sunk downstream the repository area. The results of the calculation of the future hydrogeology in the area indicates that such a well can not exist before 4 AD. In the well case the consequences of release of radionuclides from the repository to a well downstream the repository during the time period 4 AD to 2 AD are analysed. Based on the hydrogeological calculations (Holmén and Stigsson, 2a) it is assumed that all radionuclides released from one repository part exit in this well with a water consumption of 2,37 m 3 /day. Such a well can supply a small agricultural property with 5- cows and can also be used for irrigating a small garden plot where vegetables and root crops are grown. The turn-over of radionuclides that occurs by irrigation and the uptake through the food chains that this may cause is assumed to occur in the same way as in irrigation with lake water (see Section 2.4.). One difference is that no nuclides may leave the system through erosion in the well case, so the well, crops and the upper and lower soil layers are in this respect a closed system. Humans that take water from the well are supposed to be exposed by drinking water and by eating vegetables and root crops from the garden plot irrigated with water from the well. Uptake of radionuclides occurs also by consumption of meat and milk from cows that drink water from the well. Exposure also occurs by unintended intake of soil as well as through inhalation of contaminated soil particles in the air and through external exposure from radionuclides in the upper soil layer. 9
18 2.4.4 Release to today's biosphere The model used is the same as that for the first 2 years in the reasonable biosphere development (see Section 3.4.), i.e. a coastal model describing the conditions in Öregrundsgrepen today. The exposure pathways considered are thus consumption of fish as well as consumption of milk and meat from cattle, which has been grazing at the shores. 2.5 Other scenarios 2.5. Initial defects To illustrate the consequences of deviations from the expected properties of technical barriers and waste at repository closure three cases are studied: One or several large fractures in the concrete structure at repository closure Sorption in the technical barriers is considerably lower than in the base scenario due to considerable amounts of complexing agents that have been forgotten in the repository at closure The combined effect of a considerably lower sorption in the technical barriers and one or several large fractures in the concrete structure after years. Fracture in the concrete structure In this case it is assumed that, at closure of SFR, there are one or several large fractures in the concrete structures in BMA, BTF and 2BTF. These fractures are located in the vicinity of fracture zone 6 in the rock. Accordingly, this case is the same as the variation case in the base scenario with fractured/degraded barriers except for the point of time at which the fractures arise. Here it is assumed that fractures are already present at repository closure and the results from the hydrogeological modelling of the case with degraded barriers can therefore be used for the whole time period. Chemicals/complexing agents Two cases are studied to illustrate the effect of considerably deteriorated chemical barrier properties in the near field due to unexpected large amount of chemicals with complexing ability in for example the waste. One case is identical to the main case in the base scenario except for that the sorption is considerably lower in all technical barriers in the Silo, BMA and BTF caverns for the elements influenced by complexing agents. The decreased sorption capacity is obtained by reducing the K d -value in concrete/cement, bentonite, sand/bentonite and gravel backfill with a factor of for tetravalent and pentavalent elements and with a factor of for divalent and trivalent elements. In the other case, deteriorated sorption properties in the near field barriers described in the previous paragraph is combined with the variation case in the base scenario with degraded barriers after years Climate - Permafrost Even though it is very unlikely that continuous permafrost down to the depth of the repository will be formed before 2 AD, the effects of such a scenario is illustrated. For the sake of simplicity it is assumed that the whole repository is frozen until 2 AD when it melts. At this point all barriers are assumed to be cracked and not sustain any resistance for flowing groundwater. The chemical barrier function in form of sorption on the barrier materials does, however, remain. Radionuclides are transported out through the near field barriers with the total flow of groundwater in the 2
19 different repository parts. The size of the flow is obtained from the results of the calculation with the hydrogeological model on detail scale at 7 AD, the end point of the calculations. The instant dose consequences at 2 AD are calculated for today's biosphere conditions Human activity - Well in the repository As intrusion scenario the consequences of a well sunk into the different repository parts are studied. A well can be sunk at 3 AD at the earliest, when parts of the repository are not below the sea any longer. Here it is assumed that a well is sunk into the different parts of the repository where the largest water turnover prevail, i.e. the gravel backfill in the upper parts of the Silo, BMA and BTF caverns and in BLA. The water in the well is assumed to be used only as drinking water since drinking water is the dominating exposure pathway initially. The long-term consequences of wells sunk into the repository are that an open hole constitutes a fast transport path for radionuclides from the repository up to the ground surface and that the water flow rate through the repository is influenced. If a well is sunk into BLA and this hole is left open, the water flow rate through BLA is higher than the flow obtained for the base case. An increase of a factor three at 3 AD and a factor seven at 5 AD is obtained (Holmén and Stigsson, 2a). 2
20 3 Models 3. Computer codes 3.. Near-field code, NUCFLOW The near-field code NUCFLOW is a compartment model developed from the NUCTRAN-code (Romero, 995 and Romero et al., 999). The major development in NUCFLOW is the possibility to use stepwise changes of the water flow with time. NUCFLOW is a multiple path model that calculates the instationary nuclide transport in the near field of a repository as occurring through a network of resistances and capacitances coupled together in analogy with an electrical circuit network. The code takes into account diffusive and advective (water flow) transport, chain decay and sorption. It can simultaneously handle several sources, pathways and sinks to water flowing in fractures intersecting the repository. To represent the barrier system, through which the species are transported, NUCFLOW makes use of the integrated finite difference method and of the concept of compartments. The barrier system is discretized into compartments. The material balance over a compartment connected to some other compartment for a dissolved single nuclide is described as: V K i i dci dt AD = e ( c j ci ) + j i d i, j j i j i ( q j, ic j ) ( qi, jci ) Vi K iλci where V i is the volume of compartment i (m 3 ) V i K i is the capacity of the compartment, K = ε + ( ε) K d ρs ε is the porosity of the material in the compartment (-) K d is the distribution coefficient (m 3 /kg) ρ s is the solid density (kg/m 3 ) c i, c j is the concentration in compartment i and j respectively (mol/m 3 ) t is time (s) A is the diffusion area (m 2 ) D e is the effective diffusivity (m 2 /s) d is the diffusion length (m) q is the water flow (m 3 /s) λ is the decay constant (s - ). The left-hand side of the equation accounts for the accumulation of nuclides in the water and the solid by sorption. The right hand side accounts for the diffusive transport from one compartment to the adjacent compartments, the advective transport from one compartment to the adjacent compartments and the radionuclide decay. The compartments are defined by their volume, their diffusion length and cross sectional area used by the diffusion and by their material data, such as porosity, density and diffusivity. The equivalent water flow rate, Q eq, is used for representing the diffusive transport of radionuclides from the compartments in contact with the far field (host rock). This fictitious flow rate can be visualised as the flow rate that carries away dissolved species 23
21 with the concentration at the compartment interface resulting in the release of radionuclides. It has been derived by solving equations for diffusive transport to the passing water by boundary layer theory. The value of Q eq depends on the geometry of the contact area, the water flux, the flow porosity and the diffusivity as follows (Neretnieks et al., 987): Q eq = A w ε rock 4 D π t w res where A w is the surface area between the compartment and rock (m 2 ) ε rock is the flow porosity (-) D w is the diffusivity of the nuclides in water (m 2 /s) t res is the residence time of the water in contact with the compartment (s) Far-field code, FARF3 The far-field code FARF3 used is the PROPER-version, Version... The PROPERpackage is a complete program package developed by SKB for calculation of the radionuclide release from a spent fuel repository. The code FARF3 (Norman and Kjellbert, 99 and Eriksson et al., 999) calculates the transport of dissolved radionuclides through the fractured rock, the retention caused by interactions between the nuclides and the rock matrix, and the radioactive chain decay. The processes included are: advection - transport of radionuclides by water flowing through fractures in the rock dispersion - the spreading caused by velocity variations in different fractures or in different parts of a fracture matrix diffusion and sorption - the diffusive transport of radionuclides from the water in the fracture into pores and microfissures of the rock matrix where the nuclides may sorb on the solid surfaces radioactive chain decay - the decay and in-growth of radionuclides that are members of a decay chain. FARF3 is based on the one-dimensional advection-dispersion equation with onedimensional diffusion perpendicular to the flow into a matrix of finite depth. The equation is formulated in flux averaged quantities of concentration, water velocity, dispersivity and the exchange rate between flowing water and the pores of the rock matrix Biosphere model The model system used is based on compartment models. Models are set up for each ecosystem studied, such as lake, agricultural land and coastal areas (Karlsson et al., 2). The concept of the models is a dynamic model for calculating the distribution of radionuclides between major physical components of the biosphere like soil, water and sediments, the result of which are used to predict biological uptake and radiation doses along multiple pathways. The turnover of radionuclides is described by first order differential equations, which are solved numerically with ACTIVI from the computer code BIOPATH (Bergström et al., 982 and 995). The PRISM-system (Gardner et al, 983) was used to generate randomly drawn values according to the statistical distribution, given for each parameter. The resulting transfers between different compartments of the models are all described by transfer coefficients or rate constants expressed as the turnover of elements per year. 24
22 The instationary phase of the important physical and geochemical processes such as erosion, sorption and radioactive decay are taken into account. Processes like bioaccumulation and root uptake are accounted for by steady state concentration ratios (bioconcentration factors). The concentration of radionuclides in food stuff is calculated assuming equilibrium between plants/animals and their environment, an assumption that is justified by the time scale in question and that is usually used in this kind of modelling (e.g BIOMOVS, 996, Davis et al., 993). Uptake in aquatic biota is calculated using bioaccumulation factors whereas uptake in terrestrial vegetation is simulated using root-uptake factors and translocation factors (for radionuclides added to the vegetation surface). Specific transfer factors are used when calculating the transfer of radionuclides to milk and cattle meat. The internal exposure of humans is a combination of exposure from radionuclides that are eaten and those that are inhaled. Exposure from the former ones is calculated by combining the concentration in food stuff, consumption rates and nuclide specific dose coefficients for conversion from activity to dose (becquerel to sievert) for ingested radionuclides. By combining concentration in air with inhalation rates and nuclide specific dose coefficients for conversion from activity to dose for inhaled radionuclides exposure via inhalation is estimated. External exposure is estimated through consideration of exposure times, concentration of radionuclides in the air or on the ground and nuclide specific dose coefficients for conversion from concentration of radionuclides to dose (becquerel to sievert) for external exposure. Probabilistic calculations have been performed for the biosphere. Thousand realisations have been performed for each case. The distribution functions used as input data are given in SKB (2a). However, the results in this report are only presented as arithmetic mean values. The total dose for each calculation case for the studied scenarios is calculated using TS and SUM4 within the PROPER-package. 3.2 Model descriptions The model used for modelling the migration of radionuclides in each repository part is described in this section. A schematic layout of the compartments is given in Appendix B and an example of an input data file for NUCFLOW for each repository part compartments is given in Appendix C. Schematic layouts of the biosphere model systems are given in Appendix D and the models are described in Karlsson et al., (2) Silo A schematic figure of the model used for the radionuclide release calculations for the Silo is shown in Figure 3-. The internal of the Silo has been divided into two sections in the radial direction and three in the vertical direction. The division in the radial direction is made to describe that the waste conditioned with bitumen is allocated to the inner part of the Silo surrounded by waste conditioned with cement. Approximately 2 % of the waste are embedded in bitumen, which means that the inner part with waste in the model is significantly smaller than the outer part. Three different waste types have been defined in the model; waste conditioned with cement in concrete moulds, waste conditioned with cement in steel packaging and waste conditioned with bitumen in steel packaging. The division in three vertical sections is made to get a better representation of the transport. Each section is in turn divided into compartments representing different parts 25
23 of the repository, e.g. waste, concrete backfill and concrete walls. In total the model consists of 94 compartments. A detailed figure of the discretization is given in Appendix B. Radionuclides in waste conditioned with cement in concrete moulds and in steel packaging are transported out from the waste package both by diffusion and advection. The diffusivity used for the waste matrix is that in concrete grout. Water flowing through the walls of the moulds is assumed to flow in small fractures in the concrete material and hence, sorption in mould walls is not taken into account for the advective transport through the mould walls. The diffusivity in the walls of the moulds is that in construction concrete. Radionuclides in waste conditioned with bitumen are assumed to be dissolved from bitumen to the water filled pores in the bitumen matrix at a constant rate during years. As soon as the nuclides are in solution, they are free to be transported out by diffusion through the waste matrix to the surrounding concrete grout using the diffusivity in water. No sorption in bitumen is accounted for. The main part of the concrete walls inside the Silo, forming the shafts, is only accounted for as sorption capacity that is available when nuclides diffuse into them. However, walls separating waste embedded in bitumen in the inner part of the Silo from cement conditioned waste in the outer part represent both a sorption capacity and a diffusive resistance. For each section, the diffusion length in the concrete grout surrounding the waste packages is assigned a thickness of 4 cm for bitumenised waste and 2 cm for cement conditioned waste. It is assumed that the diffusion length is the same for radial and axial transport. The retention of nuclides in the concrete grout is on average underestimated, since the majority of radionuclides have to be transported several meters through the concrete grout. The water flow rate through the waste part of the Silo is very low due to the low hydraulic conductivity, particularly in the concrete structure and surrounding bentonite barriers. Water flowing through the waste part is predominantly directed in the vertical direction (Holmén and Stigsson, 2a), and is directed upward during the first thousand years from repository closure and thereafter downward. In the model, the advective transport in the horizontal plane through the waste part and surrounding concrete and bentonite barriers is neglected but the diffusive transport is accounted for. The boundary condition outside the bentonite is a so-called equivalent flow rate, Q eq. In the bottom and the top of the Silo diffusion and advection in vertical as well as in horizontal direction is accounted for. There is a diffusive transport through the concrete lid of the Silo, but the water is assumed to flow in the gas vents only. Sorption is accounted for in all barriers within the Silo. 26
24 Waste Concrete grout Concrete structure Gravel Rock Bentonite Sand-Bentonite (9/) Sand Mould wall Qeq Water flow Diffusion Qeq Figure 3-. Transport paths for radionuclides in the Silo. View from side and above. 27
25 3.2.2 BMA A schematic figure of the model used for the radionuclide release calculations for BMA is shown in Figure 3-2. To describe the transport from BMA the repository is divided into five sections plus two parts representing gravel backfill in both ends of the vault. The division is made to get a better representation of the transport along the vault. The size of each section is chosen to comprise a certain number of rooms of the encapsulation. The first section represents room -4, the second represents room 5-9, the third represents room -, the fourth represents room 2 and the fifth represents room 3-5. Each section is in turn divided into compartments representing different parts of the repository, e.g. waste, mould walls and encapsulation. In total the model consists of 6 compartments. A more detailed figure of the discretization is given in Appendix B. In the model the waste have been sorted into five different waste types; concrete moulds with waste conditioned with cement, steel containers with waste conditioned with cement, steel drums with waste conditioned with cement, steel containers with waste conditioned with bitumen and steel drums with waste conditioned with bitumen. It is foreseen that various metallic wastes will be deposited in BMA ( Other waste ). How this waste will be packaged is at present not specified, but in this study the waste is modelled as cement conditioned waste in steel containers. Each of the five sections of the model has a unique combination of the different waste types according to the present and planned allocation of the waste (Riggare and Johansson, 2). This implies that the inventory of individual radionuclides is different in the five sections of the model. In this study it is assumed that the space inside the encapsulation not occupied by waste is not backfilled. The high contrast in hydraulic conductivity between the space around the waste packages and the waste packages implies that the water flow through the waste packages will be limited. In the model it is assumed that no water is flowing through the packages. Radionuclides in waste conditioned with cement are transported out from the waste matrix by diffusion using the same diffusivity as in concrete grout. Radionuclides in concrete moulds also have to diffuse through the walls of the concrete moulds using a diffusivity of construction concrete. Radionuclides in waste conditioned with bitumen are assumed to be dissolved from bitumen to the water filled pores in the bitumen matrix at a constant rate during years. As soon as the nuclides are in solution, they are free to be transported out by diffusion through the waste matrix using the diffusivity in water. Sorption is accounted for in waste conditioned with cement, but not for waste embedded in bitumen. 28

26 Figure 3-2. Transport paths for radionuclides in BMA. View from long side and short side. 29
27 3.2.3 BTF In the vault BTF, concrete tanks are stacked two high around the walls of the vault, see Figure 3-3. Concrete moulds are used to make compartments where drums with ashes can be stacked. To make a separating wall the moulds are stacked four moulds high and nine moulds wide. A total of six compartments are needed to make room for steel drums. Five of the compartments will be completely filled, containing drums each, and the last compartment will hold 929 drums. When a compartment is filled with drums, it is sealed using concrete grout. The rest of the vault is used for concrete tanks, steel boxes and various metallic waste. A schematic figure of the model used for the radionuclide release calculations for BTF is shown in Figure 3-4. To describe the transport from BTF the repository is divided into five sections plus two parts representing gravel backfill in both ends of the vault. The division is made to get a better representation of the transport along the vault. The first section contains steel drums with ashes, plus surrounding concrete tanks and concrete moulds. The concrete tanks and moulds are used as walls to facilitate the emplacement of the steel drums. However, in the model this is simplified and the three waste types are assumed to be in parallel with each other and surrounded by concrete grout. In the four remaining sections of BTF an equal distribution of concrete tanks and "Berglöfslöfslådor" has been assumed. Various metallic wastes foreseen to be deposited in BTF are modelled as concrete tanks. Each section is in turn divided into compartments representing different parts of the repository, e.g. waste, tank walls and gravel backfill. In total the model consists of 95 compartments. A more detailed figure of the discretization is given in Appendix B. The main part of the water flows in the gravel in the top, and the part that flows through the waste and surrounding concrete grout is rather small. The contrast in hydraulic conductivity between the waste packages and the concrete grout is small, and water flow through the waste packages can not be disregarded. In the calculations the water flow that passes through the concrete grout is also assumed to pass through the waste packages. The steel drums are 2 l drums in which a smaller drum with waste is deposited and the space between the two drums is filled with concrete. In the model, it is assumed that the whole volume between the two drums is filled with concrete. The sorption capacity in this concrete is used as the radionuclides diffuse and flow into the concrete. The concrete moulds used as internal walls for the drums are of the same type as in BMA, but only moulds with low activity are allocated to BTF. In the calculations activity in moulds in BTF is neglected, but the sorption capacity in the moulds is used as radionuclides from the drums diffuse and flow into them. 3
28 3.9 m drums Concrete tank (.3x3.3 m, height 2.2 m, 2 on top) drums Drums with ashes (, ca 5.4x.3 m, height 5.4 m) Concrete moulds (.2x.2x.2 m, 36, piled 4 on top) drums About 4 m drums No of packages in the 4 m section: 56 concrete tanks 26 concrete moulds 6479 steel drums with ashes. drums 929 drums No of packages in the remaining tunnel: another 545 concrete tanks and odd waste together with 96 steel boxes (.2x.8x.8 m). Steel boxes (Berglöfsboxes) Figure 3-3. Schematic view of the allocation of waste in BTF. 3

29 Figure 3-4. Transport paths for radionuclides in BTF. View from long side and short side BTF A schematic figure of the model used for the radionuclide release calculations for 2BTF is shown in Figure 3-5. To describe the transport from 2BTF the repository is divided into five sections plus two parts representing gravel backfill in both ends of the vault. The division is made to get a better representation of the transport along the vault. Since all the waste consists of ion exchange resins in concrete tanks, a homogeneous distribution of activity and waste packages is assumed. The model for 2BTF comprises 32

30 9 compartments totally. A more detailed figure of the discretization is given in Appendix B. The water flows mainly in the gravel in the top of 2BTF and only a small part flow through the waste and surrounding concrete grout. The contrast in hydraulic conductivity between the waste packages and surrounding concrete grout is small and hence water flow through the waste packages may not be disregarded. In the calculations the water flow that passes through the concrete grout is also assumed to pass through the waste packages. Figure 3-5. Transport paths for radionuclides in 2BTF. View from long side and short side. 33

31 3.2.5 BLA A schematic figure of the model used for the radionuclide release calculations is shown in Figure 3-6. The model used for BLA is divided into five waste sections surrounded by a section with only water in each short side. The barriers in BLA are limited. In the model no barriers are taken into account. The nuclides are initially free to be transported with the water flow to the surrounding rock. The division into seven parts is probably of minor importance and the model may be seen as a stirred tank. This implies a high initial radionuclide release rate. Figure 3-6. Transport paths for radionuclides in BLA. View from long side and short side. 34
32 4 Basic assumptions This chapter summarises the premises on which this analysis is based upon. Also, the input data used for modelling the migration of radionuclides in the near field and the far field are compiled here. Motivations and a discussion of the selection of data is given elsewhere (SKB, 2a). 4. Premises The radionuclide transport calculations are based on the following assumptions for the near field: The time it takes to refill the repository with groundwater after closure is neglected and all repository sections are saturated with water in year 23. The construction of all technical barriers in the Silo and the vaults are in accordance with specifications for the existing facility and present plans for repository closure. For BMA it is assumed that the space between the waste packages is not backfilled. Waste packagings of steel are already fully permeable to water at repository closure. Radionuclides in bitumenised waste are released from bitumen to the water filled pores in the bitumen matrix with a constant rate during years without being limited by solubility. The nuclide can diffuse to surrounding barriers as soon as it is in solution. Sorption on bitumen is not accounted for. All other radionuclides, i.e. unconditioned or conditioned/stabilised in cement, are assumed to be instantaneously dissolved in water in contact with the waste without being limited by solubility. The nuclides are transported to surrounding barriers through diffusion and, in some repository parts, by advection. Sorption is accounted for in cement conditioned or stabilised waste. The advective transport through the barriers is given by the magnitude and the direction of a water flow through them that is changing with time due to land rise. The results from the detailed hydrogeology modelling (Holmén and Stigsson, 2a) have been adjusted to be in accordance with the discretization used in the migration model (Holmén and Stigsson, 2b). The magnitude and direction of the water flow in three dimensions is then transferred as input data to the migration model. The water flow is changed stepwise at 3 AD, 4 AD and 5 AD. Diffusion and sorption properties of the barriers are assumed to be constant in time. The conditions determining the sorption properties of the different barriers are the initial composition of the material, a high ion-strength in water and, for cement and concrete barriers, high ph. Waste packages in BLA are not surrounded by any barriers. The small amount of bitumen and concrete used for conditioning part of the waste in BLA is not accounted for. Neither is the bottom plate made of concrete or shotcrete covering walls and ceiling of vault. 35
33 For the cases where the barriers are assumed to be intact, the hydraulic properties of all barriers are assumed to be constant in time. The hydraulic conductivity assigned to intact concrete barriers corresponds to concrete with small, intersecting fractures. For the cases where barriers are assumed to be degraded, the degraded barriers are given the same hydraulic properties as gravel. 4.2 Near-field data 4.2. Radionuclide inventory The estimated inventory of radionuclides in SFR at repository closure (Riggare and Johansson, 2) includes 59 radionuclides, but only 42 of these are considered to be of importance for the safety assessment (SKB, 2a). The initial inventory of these 42 nuclides is compiled in Table 4-. Note that 4C has been divided into organic and inorganic carbon. However, in order to reduce the time needed for calculating the migration of radionuclides in near field and far field as well as estimating the corresponding doses, the number of nuclides included in the calculations has been limited to 29. This is discussed in more detail in Appendix A. As indicated in Table 4-, 24 Pu is omitted in the calculations. However, the initial inventory (in mole) of 24 Pu is added to the initial inventory of the next nuclide in chain 4N+, 24 Am. Chain decay is not taken into account with one exception, the formation of 93m Nb from decay of 93 Mo. 36
34 Table 4-. Radionuclide inventory (Bq) in SFR at repository closure (23) (Riggare and Johansson, 2a). Silo BMA BTF 2BTF BLA Nuclide Half-life [years] a) 3 H C inorg C org Cl Co Ni Ni Se Sr Zr m Nb Nb Mo Tc Pd m Ag m Cd Sn I Cs Cs Sm Eu Eu m Ho U b) U b) U b) U b) U b) Np b) Pu Pu Pu Pu b) Pu Am m Am b) Am b) Cm b) Cm b) Cm b) Cm b) a) Firestone (998) b) Nuclides not included in the final calculations. 37
35 4.2.2 Physical and chemical data Values on density, porosity and effective diffusivity for the materials modelled in SFR are given in Table 4-2. Sorption coefficients used are compiled in Table 4-3 and Table 4-4. The latter table is valid for cases when the influence of chemicals, e.g. ISA, are accounted for. Note that the sorption coefficient is uninfluenced by chemicals for some elements. No sorption in bitumen has been accounted for. Table 4-2. Physical data for materials used in SFR (SKB, 2a). Material Solid density (kg/m 3 ) Effective diffusivity (m 2 /s) Porosity (m 3 /m 3 ) Construction concrete Concrete grout in Silo Concrete grout in BTF/2BTF Gravel and sand Cement conditioning in packages Bentonite Sand/bentonite 9/ Bitumen 3 Water 2-9 Table 4-3. Sorption coefficients, K d, (m 3 /kg) (SKB, 2a). Element Concrete and cement Gravel and sand Bentonite Sand/bentonite 9/ H C (inorganic) C (organic) Cl.6 Co Ni Se Sr....2 Zr Nb Mo.6 Tc Pd.4..9 Ag...9 Cd Sn.5.. I.3 Cs...5. Sm Eu Ho U 5..9 Np 5..9 Pu 5 Am Cm 38
36 Table 4-4. Sorption coefficients, K d (m 3 /kg), influenced by chemicals (SKB, 2a). Element Concrete and cement Gravel and sand Bentonite Sand/bentonite 9/ H C (inorganic) C (organic) Cl.6 Co Ni Se Sr....2 Zr Nb Mo.6 Tc Pd.4..9 Ag...9 Cd Sn.5.. I.3 Cs...5. Sm Eu Ho U Np Pu.5... Am.... Cm Hydrological data The water flow rate through the different repository parts of SFR has been estimated and is discussed in detail elsewhere (Holmén and Stigsson, 2a). The total water flow rate through the different repository parts of SFR as estimated in the detailed hydrogeology modelling is given in Table 4-5. The results from the detailed hydrogeology modelling have been adjusted to be in accordance with the discretization used in the migration model (Holmén and Stigsson, 2b). The adjusted data on magnitude and direction of water flow in three dimensions is then transferred as input data to the migration model. Accordingly, a three-dimensional water flow is assigned to each compartment in the migration model. Table 4-5. Total water flow rate through different repository parts (Holmén and Stigsson, 2a). Repository part Total water flow rate (m 3 /yr) 2 AD 3 AD 4 AD 5 AD BTF: Waste part BTF: Whole vault BTF2: Waste part BTF2: Whole vault BLA: Waste part BLA: Whole vault BMA: Encapsulation BMA: Whole vault Silo: Encapsulation Silo: Top filling
37 Tabell 4-6. Total water flow rate through different repository parts when these are degraded (Holmén and Stigsson, 2a) Repository part Total water flow rate (m 3 /yr) 2 AD 3 AD 4 AD 5 AD BTF: Waste part Intact part Degraded part BTF: Whole vault BTF2 Same data assumed as for BTF BMA: Encapsulation Intact part Degraded part BMA: Whole vault Silo: Encapsulation Silo: Top filling The equivalent water flow rate, Q eq, used for representing the diffusive transport of radionuclides from the bentonite wall of the Silo to the far field (host rock) is given in Table 4-7. Table 4-7. Equivalent water flow rate (m 3 /yr) for the Silo model. Q eq (m 3 /yr) Compartment*) 2AD 3AD 3AD 4AD 4AD 5AD 5AD *) The Silo model with the compartments is given in Appendix B. 4
38 4.3 Far-field data The data needed for modelling the far-field transport using FARF3 is summarised in Table 4-8. Radionuclide specific effective diffusivities, D e, and sorption coefficients, K d, used within this work are compiled in Table 4-9. Table 4-8. Compilation of data used for modelling the migration of radionuclides in the far field (SKB, 2a). Parameter Water travel time, t w (yr) 5 Peclet number, Pe ( ) Flow-wetted surface area, a w (m 2 /m 3 ) 2 Matrix porosity, ε (m 3 /m 3 ).5 Maximum penetration depth, x (m) 2 Table 4-9. Radionuclide specific effective diffusivites D e (m 2 /s) and sorption coefficients K d (m 3 /kg) (SKB, 2a). Element D e K d Saline Saline H. -3 C inorganic C organic Cl Co Ni Se Sr Zr Nb Mo Tc(IV) Pd Ag Cd Sn I Cs Sm Eu Ho U(IV) Np(IV) Pu Am Cm
39 4.4 Biosphere data The dose conversion factors for ingestion used for estimating the dose in the human intrusion scenario are summarised in Table 4-. These factors are also used in the check of the screening of nuclides (Appendix A). The dose conversion factors for coast given in Table 4- are used for estimating the dose in the permafrost scenario. Other data used for modelling the transport of radionuclides in the biosphere and estimation of dose is presented and discussed in Karlsson et al. (2) and is compiled in SKB (2a). Table 4-. Dose conversion factors for ingestion (EU, 996) and ecosystem specific dose conversion factors for coast (Karlsson et al., 2). Nuclide Ingestion dose factor [Sv/Bq] Ecosystem specific dose conversion factor for coast [Sv/Bq] 3 H C inorg C org Cl Co Ni Ni Se Sr Zr m Nb Nb Mo Tc Pd m Ag m Cd Sn I Cs Cs Sm Eu Eu m Ho Pu Pu Pu Pu Am
40 5 Results - Base scenario In this chapter, the results for the base scenario are presented. Results for other scenarios, e.g. the influence of uncertainty in sorption data, are presented in Chapter 6. A main case has been defined within the base scenario where the near-field barriers are intact, the retention in the far-field rock is neglected and the doses from release of radionuclides are based on a reasonable biosphere development. The effect of near-field barriers being degraded after years is also highlighted, as well as the importance of the far-field rock as a barrier. In addition, three variations of ecosystems have been investigated. This chapter is divided into five sections, each section focusing on one repository part. All sections have the same disposition. First the release from the near field is discussed. Since the far field is not accounted for in the main case, the dose in recipient is based on the near-field release rate. The near-field release rate is therefore followed by the dose obtained for the reasonable biosphere development. Next the effect of an accounted far field is shown. Finally, the dose corresponding to a near-field release, neglecting the far field, to today's biosphere, mire and well is discussed. The reasonable development of the biosphere in the area is described elsewhere (Kautsky, 2). This has been the base for the reasonable biosphere development case used in this study. It assumes that the release of radionuclides from the time for closure of the repository to year 5 AD occurs to a coastal recipient corresponding to a part of Öregrundsgrepen. It is assumed that the conditions of today prevail until 4 AD. The size of Öregrundsgrepen will decrease as a consequence of the land rise and therefore a smaller water volume and longer water retention times has been assumed for the time period 4 AD to 5 AD. After 5 AD the release of radionuclides occurs to a lake which has been developed in the area. This lake is used as a recipient until 8 AD. At that time the lake has grown into a mire area. After 8 AD it is assumed that this area is drained and used for agricultural purposes until 2 AD. Two other recipients are also used in order to illustrate the uncertainties in where the groundwater from the repository will reach the biosphere after 4 AD. The reasonable biosphere development case is based on the prediction that the release point will follow the shoreline. In the mire recipient case it is instead assumed that the radionuclides are released to a mire area during the time period 4 AD to 2 AD. In the well recipient case the radionuclides are assumed to reach the biosphere within a well during the time period 4 AD to 2 AD. A forth case, the today's biosphere case, where the coastal recipient of today is assumed to prevail during the time period from the closure of the repository until 2 AD has also been used in accordance to the statements in the directions of SSI (SSI, 998). The results are presented in graphs where the release rate (Bq/yr) or the arithmetic mean dose (Sv/yr) is plotted as a function of time. As seen in for example Figure 5-, there is a sudden increase, or sometimes a decrease, in near-field release rate, especially evident at 3 AD. This is an artefact from the way a non-stationary water flow is taken into account in the near-field model (in the model a continuously changing water flow is represented by stepwise changes). This artefact propagates to the results on far-field release rate as well as dose in recipient. The figures on dose for the reasonable biosphere development shows a sudden increase in dose around 4 AD and 5 AD, 43
41 as well as an increase or decrease at 8 AD. These stepwise changes in dose is due to the fact the recipient to which the nuclides are assumed to be released changes from one recipient to another, as described above. In general the doses increase as the recipient in the reasonable biosphere development case changes from Öregrundsgrepen to a coast with smaller water volume as well as when the coast changes to lake. This is mainly due to decreased dilution as water volumes decrease and retention times increase. Another important factor is that additional exposure pathways are considered in the lake model compared to the coastal models as freshwater is also used for consumption and irrigation. The model used for the time period 8 AD to 2 AD (agricultural land model) is very different from the other used as the inflow of radionuclides occurs within a porous medium (soil) instead of to a water volume. In this model accumulation of radionuclides in soil is an important process for the calculation of the concentration of nuclides in the soil profile whereas dilution is the most important process in the coastal and lake models. In the agricultural land model it is also assumed that radionuclides which have accumulated in sediments earlier during the coastal and lake stages are present within the soil and available for exposure to humans. This can be seen as a peak in the dose curves at 8 AD. Processes like erosion of the uppermost soil layer and mixing between soil layers results in a decrease of the accumulated radionuclides with time leading to decreasing doses. For some radionuclides it can be seen that the dose curves increase again after a certain decrease. This is because new nuclides are supplied with the groundwater. The lines in the dose curves are interpolated between a number of points and because relatively few time steps has been used in the calculations for this later time period the curves do not describe the decrease in dose fully properly. For nuclides, which sorb to solid matter in soil this decrease is slower than for more mobile nuclides but this can, unfortunately, not be seen in the figures. One radionuclide which deserves special attention here is 4 C for which the dose curves decrease drastically when the use of the agricultural land model starts. This is due to that no root uptake of carbon is considered in the model (carbon is fixed by the green parts above the ground). Instead humans intake 4 C only through unintended consumption of soil (e.g. via insufficiently washed vegetables) and through consumption of milk and meat from cattle which have consumed contaminated soil when grazing. This leads to a much lower exposure for 4 Cin the agricultural land model compared to other nuclides, which are also taken up by crops. 4 C is also one of the nuclides which give the highest doses in the lake model (the uptake in fish is very large) which fortifies the impression of a drastically decrease in the dose curves at 8 AD. 5. Silo 5.. Intact barriers The modelling of the migration of radionuclides in the Silo gives a release from the near field that during the whole studied time period is dominated by organic 4 C (see Figure 5-). In the beginning, 3 H gives the second highest release rate, but from about 22 AD 8m Ag is the second most dominating nuclide in terms of release rate. The maximum release rate of 8m Ag is obtained at 3 AD. The release of 36 Cl, 93 Mo and 35 Cs becomes more and more important from about 5 AD. The release rate of these three nuclides is, however, some three orders of magnitude lower than for organic 4 C. For a reasonable biosphere development the dose is dominated by organic 4 C up to about 8 AD (Figure 5-2), when the recipient is changed from a lake to agricultural land and a significantly lower dose is obtained from organic 4 C. The dose is dominated 44
42 by 29 I, 36 Cl, 79 Se and 93 Mo instead. The dose during the agricultural period is less than -8 Sv/yr. The maximum total dose obtained from release of radionuclides from the Silo is 3-6 Sv/yr which is at 5 AD. The far-field barrier (the geosphere) delays the release of radionuclides. How effective the far field rock is as a barrier varies from nuclide to nuclide. The effect of the far-field barrier on the release of radionuclides in the Silo is shown in Figure 5-3. By comparing Figure 5- and Figure 5-3 it is seen that it to a large extent is the same nuclides that dominate the release rate from both the near field and the far field. The difference in release rate between the near field and the far field is insignificant for organic 4 C, 36 Cl, 93 Mo and 29 I. These nuclides do not sorb in the geosphere. For nuclides like inorganic 4 C, 59 Ni and 79 Se a reduction in maximum release rate of about a factor two is obtained at most. For other nuclides the far-field rock is a more effective barrier. The maximum far-field release rate of 9 Sr and 35 Cs is between three and six times lower than that from the near field. The corresponding reductions in release rate of 3 H and 8m Ag is up to two orders of magnitude and of 37 Cs four orders of magnitude. When the nuclides are released to today's biosphere the whole studied period the dose obtained from release of radionuclides in Silo is very low (Figure 5-4). The maximum dose is less than - Sv/yr and is dominated by the release of organic 4 C. If the nuclides are released to a mire area after 4 AD instead, higher doses are obtained (compare Figure 5-5). The dose dominating nuclide is organic 4 C between 4 AD and 6 AD and after that 79 Se. Other nuclides of importance for the total dose are 8m Ag and 36 Cl. The maximum total dose (2-7 Sv/yr) is obtained at the end of the near-field calculations (2 AD). An even higher total dose is obtained if the nuclides are released to a well located downstream the repository (Figure 5-6). The maximum total dose (5-5 Sv/yr) is obtained when the well is sunk (4 AD), and is dominated by organic 4 C. The second most important nuclide is 29 I but its dose is between one and two orders of magnitude lower than that for the dominating nuclide. 45
43 Near-field release [Bq/yr] Silo-BS2 Ag-8m C-4inorg C-4org Cl-36 Cs-35 Cs-37 H-3 I-29 Mo-93 Nb-93m Ni-59 Pd-7 Se-79 Sr Time [yr, AD] Figure 5-. Near-field release rate from Silo.(The nuclides in the bottom right corner are 7 Pd and inorganic 4 C.) Silo-BS2 C-4org Cl-36 Cs-35 I-29 Mo-93 Se-79 Total Dose [Sv/yr] Time [yr, AD] Figure 5-2. Dose from release of radionuclides from Silo to the reasonable biosphere. 46
44 Far-field release [Bq/yr] Silo-BS2 Ag-8m C-4inorg C-4org Cl-36 Cs-35 H-3 I-29 Mo-93 Nb-93m Ni-59 Pd-7 Se-79 Sr Time [yr, AD] Figure 5-3. Far-field release rate from Silo Silo-BS2 C-4org Total -5 Dose [Sv/yr] Time [yr, AD] Figure 5-4. Dose from release of radionuclides from Silo to today's biosphere. 47
45 Dose [Sv/yr] Silo-BS2 Ag-8m C-4org Cl-36 Cs-35 I-29 Mo-93 Ni-59 Se-79 Total Time [yr, AD] Figure 5-5. Dose from release of radionuclides from Silo to a mire area. Dose [Sv/yr] Silo-BS2 Ag-8m C-4org Cl-36 Cs-35 I-29 Mo-93 Ni-59 Se-79 Total Time [yr, AD] Figure 5-6. Dose from release of radionuclides from Silo to a well. 48
46 5..2 Degraded barriers Degradation of concrete and bentonite barriers leads to an increased water flow through the Silo. The magnitude and direction of the water flow has been estimated based on the results from the hydrogeology modelling with an increased hydraulic conductivity in the Silo (Holmén and Stigsson, 2a). In the hydrogeology model a homogeneous conductivity, except for the gravel in the top, was assumed for this case. However, even though the barriers are degraded or fractured the hydraulic properties of the Silo should be such that an axial flow through the part of the Silo where the waste is located is dominating. A vertical flow through this part is therefore assumed in the migration model. The flow is directed upward during the first thousand years from repository closure and thereafter downward. The results for a Silo being degraded years after repository closure are shown in Figure 5-7 to Figure 5-2. Since the Silo is assumed to be intact during the first years, the water flow rate through the Silo, and thus the near-field release rate, during this time period are identical to that for the main case with intact barriers discussed in Section 5... The increase in flow 3 AD leads to an increase in release rate compared to the main case. For 59 Ni between one and two orders of magnitude higher release rate from the near field is obtained, and for 36 Cl, 79 Se, 93 Mo, 8m Ag, 29 I and 35 Cs the release rate is a factor seven to ten higher. The maximum near-field release rate of organic 4 C is a factor four higher than for the main case. The delay in the far field may in this case with less retention in the near field be of more importance than in the case with intact barriers. However, the far field is of most importance for the short-lived nuclides and since this case is equal to the case with intact barriers the first years, the influence of the far -field is not markedly higher than in the case with intact barriers. The maximum total dose for release to reasonable biosphere, today s recipient, mire area and well is 9-6 Sv/yr, 3 - Sv/yr, 5-6 Sv/yr and 2-4 Sv/yr, respectively. 49
47 Near-field release [Bq/yr] Silo-BS5 Ag-8m C-4inorg C-4org Cl-36 Cs-35 Cs-37 H-3 I-29 Mo-93 Nb-93m Ni-59 Pd-7 Se-79 Sr Time [yr, AD] Figure 5-7. Near-field release rate from a Silo being degraded from 3 AD. Dose [Sv/yr] Silo-BS5 Ag-8m C-4org Cl-36 Cs-35 I-29 Mo-93 Ni-59 Se-79 Total Time [yr, AD] Figure 5-8. Dose from release of radionuclides from a Silo being degraded from 3 AD to the reasonable biosphere (calculations performed for dominating nuclides only). 5
48 Far-field release [Bq/yr] Silo-BS5 Ag-8m C-4inorg C-4org Cl-36 Cs-35 H-3 I-29 Mo-93 Nb-93m Ni-59 Pd-7 Se-79 Sr Time [yr, AD] Figure 5-9. Far-field release rate from a Silo being degraded from 3 AD Silo-BS5 C-4org Total -5 Dose [Sv/yr] Time [yr, AD] Figure 5-. Dose from release of radionuclides from a Silo being degraded from 3 AD to today's biosphere (calculations performed for dominating nuclides only). 5
49 Dose [Sv/yr] Silo-BS5 Ag-8m C-4org Cl-36 Cs-35 I-29 Mo-93 Ni-59 Se-79 Total Time [yr, AD] Figure 5-. Dose from release of radionuclides from a Silo being degraded from 3 AD to a mire area (calculations performed for dominating nuclides only). Dose [Sv/yr] Silo-BS5 Ag-8m C-4org Cl-36 Cs-35 I-29 Mo-93 Ni-59 Se-79 Total Time [yr, AD] Figure 5-2. Dose from release of radionuclides from a Silo being degraded from 3 AD to a well (calculations performed for dominating nuclides only). 52
50 5.2 BMA 5.2. Intact barriers The results for BMA for the base scenario are shown in Figure 5-3 to Figure 5-8. The near-field release rate is dominated by organic 4 C, and from about 58 AD and onwards by 59 Ni. The exception is the first few years after repository closure when 9 Sr results in a somewhat higher release rate than organic 4 C. 9 Sr gives a significant release rate for about 2 years. 3 H and 37 Cs are also among the nuclides dominating the near-field release shortly after repository closure. Organic 4 C also dominates the total dose for the reasonable biosphere development until 8 AD (see Figure 5-4). When the recipient changes from a lake to agricultural land at 8 AD the dose corresponding to organic 4 C drops drastically but for some other nuclides it increases, and the total dose increases to 2-7 Sv/yr. During the agricultural period several nuclides contribute to the total dose, 36 Cl, 59 Ni, 79 Se, 93 Mo, 35 Cs and 29 I. 79 Se dominates the dose between 8 AD and 9 AD and later 29 I dominates. The maximum total dose for BMA is 5-7 Sv/yr, obtained at about 5 AD. The result on release from the far field is shown in Figure 5-5. The influence of the far-field rock on the release of radionuclides from BMA is a delay and thereby reduced release rates for especially sorbing short-lived nuclides. For example the release rate of 9 Sr, 37 Cs and 63 Ni decrease one or several orders of magnitude. The dose dominating nuclides are however only slightly influenced by the far field. When the nuclides are released to today's biosphere the whole studied period the maximum total dose for release of radionuclides from BMA is very low (see Figure 5-6). A maximum dose of 2 - Sv/yr is obtained and is dominated by the release of organic 4 C. If the recipient is a mire area, the dose dominating nuclide is 79 Se. 36 Cl, 59 Ni and 8m Ag each gives a dose that is about an order of magnitude lower. The dose from 59 Ni is still increasing at the end of the calculations. The total dose is almost constant during the studied time period with a maximum of 3-6 Sv/yr. Release to a well results in an even higher total dose. The maximum dose is obtained at 4 AD and is caused by the release of organic 4 C. Organic 4 C dominates the dose until 6 AD. From then, 29 I and later 59 Ni are dominating nuclides. However, other nuclides, e.g. 93 Mo and 35 Cs, give a significant contribution to the total dose. 53
51 Near-field release [Bq/yr] BMA-BS Ag-8m C-4inorg C-4org Cl-36 Cs-35 Cs-37 H-3 I-29 Mo-93 Nb-93m Nb-94 Ni-59 Ni-63 Pd-7 Pu-239 Pu-24 Se-79 Sn-26 Sr-9 Tc-99 Zr Time [yr, AD] Figure 5-3. Near-field release rate from BMA. Dose [Sv/yr] BMA-BS Ag-8m C-4inorg C-4org Cl-36 Cs-35 I-29 Mo-93 Ni-59 Se-79 Tc-99 Total Time [yr, AD] Figure 5-4. Dose from release of radionuclides from BMA to the reasonable biosphere. 54
52 Far-field release [Bq/yr] BMA-BS Ag-8m C-4inorg C-4org Cl-36 Cs-35 Cs-37 H-3 I-29 Mo-93 Nb-93m Nb-94 Ni-59 Ni-63 Pd-7 Se-79 Sn-26 Sr-9 Tc-99 Zr Time [yr, AD] Figure 5-5. Far-field release rate from BMA BMA-BS C-4org Total -5 Dose [Sv/yr] Time [yr, AD] Figure 5-6. Dose from release of radionuclides from BMA to today's biosphere. 55
53 Dose [Sv/yr] BMA-BS Ag-8m C-4inorg C-4org Cl-36 Cs-35 I-29 Mo-93 Nb-94 Ni-59 Pu-239 Pu-24 Se-79 Sn-26 Tc-99 Total Time [yr, AD] Figure 5-7. Dose from release of radionuclides from BMA to a mire area. Dose [Sv/yr] BMA-BS Ag-8m C-4inorg C-4org Cl-36 Cs-35 I-29 Mo-93 Nb-93m Nb-94 Ni-59 Ni-63 Pd-7 Pu-239 Pu-24 Pu-242 Se-79 Sn-26 Tc-99 Zr-93 Total Time [yr, AD] Figure 5-8. Dose from release of radionuclides from BMA to a well. 56
54 5.2.2 Degraded barriers Degradation of the encapsulation in BMA, for example by leaching of components in the concrete structures, may lead to fracturing. It is foreseen that the largest effect on release from a degraded encapsulation is obtained where fracture zone 6 intersects BMA, since this is where the ground-water flow is highest. Fracture zone 6 intersects BMA at room 2 why it is assumed that this room is degraded. In this case it is assumed that degradation occurs instantaneously at 3 AD (see Chapter 3). A fracture through this room have a limited influence on the total flow through BMA (Holmén and Stigsson, 2a). A small redistribution of the flow is obtained, but the main effect is a significant increase in flow through the encapsulation at room 2. The release rate from the near field for this case is shown in Figure 5-9. Since the flow through the repository between 2 AD and 3 AD is the same as for the main case shown in Figure 5-3 above, the release rate for this period of time is identical. However, the higher water flow rate from 3 AD compared to the main case generally results in an increased nuclide release rate. For certain time periods the release rate of some nuclides (e.g. inorganic 4 C, 59 Ni and 99 Tc) is between one and two orders of magnitude higher. Other nuclides, such as organic 4 C, 36 Cl, 93 Mo, 29 I and 35 Cs is only marginally affected by a higher water flow rate through room 2. A significant difference between intact and degraded barriers in BMA is that the dose from release of 59 Ni, 239 Pu and 24 Pu to the reasonable biosphere after 8 AD increases significantly with degraded barriers. This leads to that 59 Ni dominates until 5 AD and thereafter the two plutonium isotopes dominate the dose. The maximum total dose for release to reasonable biosphere in this case is -6 Sv/yr. The release rate from the far field for this case is shown in Figure 5-2. Even though the retention in the near field barriers is smaller in this case compared to the case with intact barriers the influence of the far field is small for most of the dose dominating nuclides, except for 239 Pu and 24 Pu. The release of these nuclides is reduced more than two orders of magnitude. The maximum total dose for release to today's biosphere, mire area and well is 2 - Sv/yr, 3-6 Sv/yr and 7-5 Sv/yr, respectively. 57
55 Near-field release [Bq/yr] BMA-BS5 2 Ag-8m Am-24 C-4inorg C-4org Cl-36 Cs-35 Cs-37 H-3 Ho-66m I-29 Mo-93 Nb-93m Nb-94 Ni-59 Ni-63 Pd-7 Pu-239 Pu-24 Pu-242 Se-79 Sn-26 Sr-9 Tc-99 Zr-93 Time [yr, AD] Figure 5-9. Near-field release rate from BMA with an encapsulation being degraded from 3 AD. Dose [Sv/yr] BMA-BS5 Ag-8m C-4inorg C-4org Cl-36 Cs-35 I-29 Mo-93 Nb-94 Ni-59 Pu-239 Pu-24 Se-79 Sn-26 Tc-99 Total Time [yr, AD] Figure 5-2. Dose from release of radionuclides from BMA with an encapsulation being degraded from 3 AD to the reasonable biosphere (calculations performed for dominating nuclides only). 58
56 Far-field release [Bq/yr] BMA-BS5 Ag-8m C-4inorg C-4org Cl-36 Cs-35 Cs-37 H-3 I-29 Mo-93 Nb-93m Nb-94 Ni-59 Ni-63 Pd-7 Se-79 Sn-26 Sr-9 Tc-99 Zr Time [yr, AD] Figure 5-2. Far-field release rate from BMA with an encapsulation being degraded from 3 AD BMA-BS5 C-4org Total -5 Dose [Sv/yr] Time [yr, AD] Figure Dose from release of radionuclides from BMA with an encapsulation being degraded from 3 AD to today's biosphere (calculations performed for dominating nuclides only). 59
57 Dose [Sv/yr] BMA-BS5 Ag-8m Am-24 C-4inorg C-4org Cl-36 Cs-35 I-29 Mo-93 Nb-94 Ni-59 Ni-63 Pd-7 Pu-239 Pu-24 Pu-242 Se-79 Sn-26 Tc-99 Zr-93 Total Time [yr, AD] Figure Dose from release of radionuclides from BMA with an encapsulation being degraded from 3 AD to a mire area (calculations performed for dominating nuclides only). Dose [Sv/yr] BMA-BS5 Ag-8m Am-24 C-4inorg C-4org Cl-36 Cs-35 Ho-66m I-29 Mo-93 Nb-93m Nb-94 Ni-59 Ni-63 Pd-7 Pu-239 Pu-24 Pu-242 Se-79 Sn-26 Tc-99 Zr-93 Total Time [yr, AD] Figure Dose from release of radionuclides from BMA with an encapsulation being degraded from 3 AD to a well (calculations performed for dominating nuclides only). 6
58 5.3 BTF 5.3. Intact barriers The results for the modelling of radionuclide transport within the near field of BTF are shown in Figure The release is to a major part similar to that from BMA in terms of dominating nuclides. The maximum release rate for organic 4 C is 2 8 Bq/yr which is obtained a thousand years after repository closure. From that point the release rate of organic 4 C decreases. Instead, the highest release rate is obtained by 59 Ni and inorganic 4 C from 6 AD. For release to the reasonable biosphere (Figure 5-26) the total dose is in the beginning dominated by organic 4 C. When the recipient for the nuclides is changed from a coastal area to a lake (at 5 AD) there is a steep increase in dose. This increase is especially evident for inorganic 4 C, but organic 4 C is still resulting in the highest dose. The dose corresponding to inorganic 4 C is slowly increasing between 5 AD and 8 AD but that from organic 4 C is decreasing. The total dose is therefore dominated by inorganic 4 C between 6 AD and 8 AD. At 8 AD the recipient is changed to an agricultural land, and consequently the dose from both organic and inorganic 4 C is significantly reduced. Several nuclides then significantly contribute to the dose, 36 Cl, 59 Ni, 79 Se, 93 Mo, 29 I and 35 Cs. At 8 AD the dose is dominated by 36 Cl and later by 29 I. The maximum total dose, 4-7 Sv/yr, is obtained at 5 AD. The influence of the far-field rock on the release of radionuclides from BTF is shown in Figure The maximum far-field release rate of organic 4 C is a factor two lower than that from the near field. Other dose dominating nuclides, inorganic 4 C, 36 Cl, 79 Se and 29 I, are also slightly influenced by the far field. Short-lived sorbing nuclides are more influenced than the dose dominating nuclides. For example 9 Sr, 37 Cs, 8m Ag and 63 Ni decrease one or several orders of magnitude in the far field. The dose obtained from a release of radionuclides in BTF to today's biosphere is dominated by organic 4 C with a maximum total dose of 3 - Sv/yr. Release of radionuclides in BTF to a mire area gives a dose that is dominated by 79 Se. 8m Ag are among the dose dominating nuclides in the time period 4 AD to 5 AD (see Figure 5-29). Other nuclides of importance for the total dose are 36 Cl and 59 Ni, but they give a dose that is about an order of magnitude lower than 79 Se. Organic 4 C dominates the dose between 4 AD and 6 AD when nuclides in BTF are released to a well (see Figure 5-3). For longer times several nuclides give a major contribution to the total dose, e.g. inorganic 4 C, 59 Ni, 93 Mo, 29 I and 35 Cs. The maximum total dose, obtained 4 AD, is 7-5 Sv/yr. 6
59 Near-field release [Bq/yr] BTF-BS2 Ag-8m C-4inorg C-4org Cl-36 Cs-35 Cs-37 H-3 I-29 Mo-93 Nb-93m Nb-94 Ni-59 Ni-63 Pd-7 Se-79 Sr-9 Tc-99 Zr Time [yr, AD] Figure Near-field release rate from BTF. Dose [Sv/yr] BTF-BS2 Ag-8m C-4inorg C-4org Cl-36 Cs-35 I-29 Mo-93 Ni-59 Se-79 Tc-99 Total Time [yr, AD] Figure Dose from release of radionuclides from BTF to the reasonable biosphere. 62
60 Far-field release [Bq/yr] BTF-BS2 Ag-8m C-4inorg C-4org Cl-36 Cs-35 H-3 I-29 Mo-93 Nb-93m Nb-94 Ni-59 Ni-63 Pd-7 Se-79 Sr-9 Tc Time [yr, AD] Figure Far-field release rate from BTF BTF-BS2 C-4org Total -5 Dose [Sv/yr] Time [yr, AD] Figure Dose from release of radionuclides from BTF to today's biosphere. 63
61 Dose [Sv/yr] BTF-BS2 Ag-8m C-4inorg C-4org Cl-36 Cs-35 I-29 Mo-93 Ni-59 Se-79 Tc-99 Total Time [yr, AD] Figure Dose from release of radionuclides from BTF to a mire area. Dose [Sv/yr] BTF-BS2 Ag-8m C-4inorg C-4org Cl-36 Cs-35 I-29 Mo-93 Nb-93m Nb-94 Ni-59 Ni-63 Pd-7 Pu-239 Pu-24 Se-79 Sn-26 Tc-99 Zr-93 Total Time [yr, AD] Figure 5-3. Dose from release of radionuclides from BTF to a well. 64
62 5.3.2 Degraded barriers The effect of degradation of barriers in BTF from 3 AD has also been estimated. The water flow through BTF where a 7 m long section of the repository, located where fracture zone 6 intersects the vault, is given an insignificant flow resistance has been modelled (Holmén and Stigsson, 2a). The results show that the water flow rate through the waste and surrounding concrete backfill is up to a factor six higher than for an intact barrier. Furthermore, it is concluded that the main part of the water in BTF (9 %) flows through the degraded part. However, the total water flow through the whole vault increases with no more than a factor two. No radionuclide migration calculations have been made for this case. However, based on the results discussed in the previous paragraph, it is concluded that only waste packages in the degraded part will be affected by the higher flow rate obtained with a degraded barrier. Theoretically, in comparison to the nuclide release rate from an intact barrier, the release rate from these packages can increase with a factor corresponding to the increase in flow for the nuclides of importance. Radionuclides with short half-life may increase more. An increased release rate from the non-degraded part of the vault will not be obtained since the water flow rate through this part is not foreseen to increase. A 7 m wide section corresponds to about % of the total waste volume. A flow increase of a factor six for % of the waste together with essentially an uninfluenced water flow rate through the rest of the waste, and an increase in total flow through the vault of a factor two, both indicate that the near-field release rate should not be more than a factor two higher in comparison to the main case. Thus, the maximum total dose is estimated to be 8-7 Sv/yr for the reasonable biosphere development BTF 5.4. Intact barriers The results for the near-field release from 2BTF resembles that from BMA (compare Figure 5-3 and Figure 5-3). In the beginning the release is dominated by organic 4 C and later by 59 Ni. The release rate of organic 4 C from 2BTF is about a factor five lower than that from BMA. The difference for 59 Ni is about a factor three. The dose obtained for release of radionuclides from 2BTF for the reasonable biosphere development is shown in Figure It is the same nuclides that dominate the dose as for BMA. The dose obtained from organic 4 C released from 2BTF is between a factor five to eight lower than the corresponding release from BMA. The maximum total dose is 9-8 Sv/yr at 5 AD. When the lake is transferred into agricultural land at 8 AD the total dose is 5-8 Sv/yr. 79 Se dominates the dose at this point of time followed by 36 Cl and 59 Ni. The dose decrease until 9 AD, after that the dose increase slightly. During this time period 36 Cl, 59 Ni, 79 Se, 93 Mo, 29 I and 35 Cs dominate the dose. The influence of the far-field rock on the release of radionuclides from 2BTF is shown in Figure The dose dominating nuclides, organic 4 C, 36 Cl, 59 Ni, 79 Se and 29 I, are slightly influenced by the far field. Short-lived sorbing nuclides are more influenced than the dose dominating nuclides. For example 9 Sr, 37 Cs, 8m Ag and 63 Ni decrease one or several orders of magnitude in the far field. The total dose obtained when nuclides from 2BTF are released to today's biosphere is dominated by the release of organic 4 C, with a total dose less than - Sv/yr (see Figure 5-34). 65
63 Figure 5-35 shows the dose obtained for release to a mire area. The result for 2BTF is very similar to that obtained for BMA (Figure 5-7) in terms of dominating nuclides ( 36 Cl, 59 Ni, 79 Se and 8m Ag). The maximum total dose for 2BTF is however somewhat lower (7-7 Sv/yr). The results for 2BTF and BMA are also similar for a release to a well. Organic 4 C dominates the dose up to about 6 AD and thereafter the dose is dominated by 93 Mo, 29 I and 59 Ni (see Figure 5-36). 36 Cl, 79 Se and 35 Cs also contribute to the total dose. The total dose from release from 2BTF is however somewhat lower than for BMA. The results for 2BTF gives a maximum total dose of -5 Sv/yr about 4 AD. Near-field release [Bq/yr] BTF2-BS2 Ag-8m C-4inorg C-4org Cl-36 Cs-35 Cs-37 H-3 I-29 Mo-93 Nb-93m Nb-94 Ni-59 Ni-63 Pd-7 Se-79 Sn-26 Sr-9 Tc-99 Zr Time [yr, AD] Figure 5-3. Near-field release rate from 2BTF. 66
64 Dose [Sv/yr] BTF2-BS2 Ag-8m C-4inorg C-4org Cl-36 Cs-35 I-29 Mo-93 Ni-59 Se-79 Tc-99 Total Time [yr, AD] Figure Dose from release of radionuclides from 2BTF to the reasonable biosphere. Far-field release [Bq/yr] BTF2-BS2 Ag-8m C-4inorg C-4org Cl-36 Cs-35 Cs-37 H-3 I-29 Mo-93 Nb-93m Nb-94 Ni-59 Ni-63 Pd-7 Se-79 Sn-26 Sr-9 Tc Time [yr, AD] Figure Far-field release rate from 2BTF. 67
65 BTF2-BS2 C-4org Total -5 Dose [Sv/yr] Time [yr, AD] Figure Dose from release of radionuclides from 2BTF to today's biosphere. Dose [Sv/yr] BTF2-BS2 Ag-8m C-4inorg C-4org Cl-36 Cs-35 I-29 Mo-93 Ni-59 Se-79 Tc-99 Total Time [yr, AD] Figure Dose from release of radionuclides from 2BTF to a mire area. 68
66 Dose [Sv/yr] BTF2-BS2 Ag-8m C-4inorg C-4org Cl-36 Cs-35 I-29 Mo-93 Nb-93m Nb-94 Ni-59 Ni-63 Pd-7 Se-79 Sn-26 Tc-99 Zr-93 Total Time [yr, AD] Figure Dose from release of radionuclides from 2BTF to a well Degraded barriers Fracture zone 6 intersects approximately half way into 2BTF as for BTF and BMA. The development and the effect of such a degradation of 2BTF are therefore foreseen to be the same as for BTF. The maximum total dose is estimated to be 2-7 Sv/yr for the reasonable biosphere development. 5.5 BLA Since no barriers have been accounted for in the migration model for BLA, the radionuclides can be transported momentarily from the waste to the surrounding rock. Consequently, a high release rate of radionuclides is obtained instantaneously (see Figure 5-37). The nuclides dominating the release a very short period of time after repository closure are shortlived nuclides like 6 Co, 63 Ni, 9 Sr and 37 Cs. The releases of most of these nuclides decrease rapidly and after 7 years the nuclides dominating the release are inorganic 4 C, 59 Ni and 99 Tc. The dose for the reasonable biosphere development from radionuclide release from BLA is shown in Figure 5-38 and Figure The latter figure shows a detail of the dose during the first years. The release obtained directly after repository closure results in a total dose of approximately -8 Sv/yr, dominated by 37 Cs. After about 3 years inorganic 4 C is the dominating nuclide until about 7 AD. From 7 AD the dose is dominated by 239 Pu and 24 Pu. At 8 AD the dose increase markedly and reaches its maximum, 2-7 Sv/yr. The far field is a more important barrier for release of radionuclides from BLA than for release from the other repository parts. As shown in Figure 5-37 there is a significant release of radionuclides in BLA from the near field from the very beginning, and all 69
67 nuclides reach its maximum release rate within about years from repository closure. When the nuclides are transported through the far-field rock the maximum release rate is reduced. How strong the effect is depends on the nuclide s half-life and its ability to sorb within the far-field rock. The maximum release rate of inorganic 4 C from the far field is less than a factor two lower than that from the near field. The corresponding factor is 3 for 59 Ni and for 63 Ni, 9 Sr and 99 Tc. For 239 Pu and 24 Pu a reduction of three orders of magnitude is obtained, for 37 Cs four orders of magnitude and for 6 Co five orders of magnitude. Transport through the far field also delays the release to the biosphere. Comparing the release curves from the near field (see Figure 5-37) and the far field (see Figure 5-4) for a specific nuclide this is evident. The far-field release of inorganic 4 C and 59 Ni resembles that from the near field to begin with and the time when the maximum release rate is obtained is roughly the same for the near field and the far field. However, when the maximum release rate has been obtained the reduction in far-field release rate with time is moderate in comparison to that from the near field. The far-field release rate of inorganic 4 C and 59 Ni therefore exceeds that from the near field as from 4 AD. Other nuclides are transported more slowly through the far field. The release of 99 Tc, for example, is increasing with time and is of the same order of magnitude as for inorganic 4 C and 59 Ni around 8 AD, with a maximum release rate obtained at2 AD. Several other nuclides, e.g. 239 Pu and 24 Pu, behave in the same way. The far field is neglected in the base scenario. However, the extended release in time obtained from the far field in comparison to that from the near field of BLA, indicates that a higher dose could have been obtained if the dose was based on the release from the far field. The dose obtained from a far-field release to the reasonable biosphere has therefore been estimated for 59 Ni, 99 Tc, 239 Pu and 24 Pu. The obtained dose is shown in Figure 5-4. The dose from the far-field release of 59 Ni exceeds that obtained from the near-field release from 4 AD. When nuclides are released to a lake (5 AD 8 AD) the dose is between one and two orders of magnitude higher. When the recipient changes to agricultural land the difference in dose between near-field and far-field release is even larger, up to four orders of magnitude. The K d -value for sorption of 99 Tc on the rock is higher than for 59 Ni. Accordingly, it takes longer time before the dose from the far-field release exceeds that from the nearfield release (6 AD). In the beginning of the agricultural period (8 AD) the dose from the far-field and near-field release increase to the same maximum level about 2-9 Sv/yr. Thereafter the dose from the near-field release decrease markedly while the dose from the far-field release remains at almost the same level. Plutonium has even better sorption characteristics. The dose obtained from the far-field release of 239 Pu and 24 Pu is therefore lower than that obtained from the near-field release. BLA is the repository part giving the highest dose when the nuclides are released to today's biosphere (see Figure 5-42). The maximum total dose is about -8 Sv/yr. This dose is obtained directly after repository closure from release of 37 Cs. Besides the instant peak in dose, the maximum total dose is less than - Sv/yr. 239 Pu and 24 Pu are the two dominating nuclides in terms of dose when released from BLA to a mire area. The maximum total dose is 3-6 Sv/yr which is obtained 45 AD (see Figure 5-43). Around 4 AD 99 Tc is also one of the dominating nuclides but its 7
68 contribution is reduced rapidly with time. The third most important nuclide in terms of dose is 79 Se, but it gives a dose that is about one order of magnitude lower than the two plutonium isotopes. When nuclides in BLA are released to a downstream well a dose exceeding -4 Sv/yr are obtained instantaneously (maximum total dose is 2-4 Sv/yr). 239 Pu and 24 Pu dominate the dose for the whole time period studied (see Figure 5-44). Initially, 99 Tc gives an important contribution to the total dose as well. Near-field release[bq/yr] Time [yr, AD] BLA-BS 2 Ag-8m Am-24 C-4inorg C-4org Cd-3m Cl-36 Co-6 Cs-35 Cs-37 Eu-52 Eu-54 H-3 Ho-66m I-29 Mo-93 Nb-94 Ni-59 Ni-63 Pd-7 Pu-238 Pu-239 Pu-24 Pu-242 Se-79 Sm-5 Sn-26 Sr-9 Tc-99 Zr-93 Figure Near-field release rate from BLA. 7
69 Dose [Sv/yr] BLA-BS Am-24 C-4inorg C-4org Cl-36 Co-6 Cs-35 Cs-37 Eu-54 I-29 Nb-94 Ni-59 Ni-63 Pu-238 Pu-239 Pu-24 Pu-242 Se-79 Sr-9 Tc-99 Total Time [yr, AD] Figure Dose from release of radionuclides from BLA to reasonable biosphere based on near-field release. Dose [Sv/yr] BLA-BS Am-24 C-4inorg C-4org Cl-36 Co-6 Cs-35 Cs-37 Eu-54 I-29 Nb-94 Ni-59 Ni-63 Pu-238 Pu-239 Pu-24 Pu-242 Se-79 Sr-9 Tc-99 Total Time [yr, AD] Figure Dose from release of radionuclides from BLA to reasonable biosphere during the time period 2 AD to 3 AD based on near-field release. 72
70 Far-field release [Bq/yr] BLA-BS 2 Ag-8m Am-24 C-4inorg C-4org Cd-3m Cl-36 Co-6 Cs-35 Cs-37 H-3 Ho-66m I-29 Mo-93 Nb-93m Nb-94 Ni-59 Ni-63 Pd-7 Pu-239 Pu-24 Pu-242 Se-79 Sn-26 Sr-9 Tc-99 Zr-93 Time [yr, AD] Figure 5-4. Far-field release rate from BLA Ni-59 Tc-99 Pu-239 Pu-24-8 Dose [Sv/yr] Time [yr, AD] Figure 5-4. Comparison of dose from release of radionuclides from BLA to reasonable biosphere. Based on release from a) near field (solid line) and b) far field (dashed line). 73
71 Dose [Sv/yr] BLA-BS Am-24 C-4inorg Co-6 Cs-37 Eu-54 Ni-63 Pu-238 Sr-9 Total Time [yr, AD] Figure Dose from release of radionuclides from BLA to today's biosphere based on near-field release. Dose [Sv/yr] BLA-BS Ag-8m C-4inorg Cl-36 Cs-35 Ho-66m I-29 Mo-93 Nb-94 Ni-59 Pu-239 Pu-24 Pu-242 Se-79 Sn-26 Tc-99 Zr-93 Total Time [yr, AD] Figure Dose from release of radionuclides from BLA to a mire area based on near-field release. 74
72 Dose [Sv/yr] BLA-BS Ag-8m C-4inorg C-4org Cl-36 Cs-35 Ho-66m I-29 Mo-93 Nb-93m Nb-94 Ni-59 Ni-63 Pd-7 Pu-238 Pu-239 Pu-24 Pu-242 Se-79 Sn-26 Tc-99 Zr-93 Total Time [yr, AD] Figure Dose from release of radionuclides from BLA to a well based on near-field release. 75
73 6 Results - Other scenarios The results for scenarios not included in the base scenario are summarised in this chapter. Four scenarios are studied. These are the influence of: initially degraded barriers chemicals in waste permafrost human intrusion (drilling of a well into the repository). 6. Initially degraded barriers In the main case within the base scenario it is assumed that the properties of the technical barriers fulfil the specifications. A case in which the barriers are degraded thousand years after repository closure is also investigated in the base scenario. But what happens if the properties of barriers and waste are not as good as assumed already at repository closure? A case in which there are one or several large fractures in the concrete structure in BMA already at repository closure has therefore been investigated. The fractures are formed close to fracture zone 6 that intersects the vault. It is the same scenario as the case with degraded barriers within the base scenario except for that there are fractures already at repository closure. The main effect of an initial fracture through the concrete encapsulation in room 2 of BMA is a significant increase in water flow through that room and changed release paths from BMA. Initially the result is a decreased near-field release rate compared to the base case, but the higher water flow rate through room 2 causes the release to increase faster. For some nuclides it takes tens of years or less before the release rate with an initial fracture exceeds that for an intact structure. For other nuclides it takes hundreds of years. The increase in release rate during the first thousand years is a factor five or less. For organic 4 C for example the increase is a factor three at most. After 3 AD the water flow is identical to the case in which the structure is assumed to be degraded after years from repository closure, see section Between 3 AD and 4 AD small differences in nuclide release rate is obtained and for longer times the two cases are almost identical. The total dose for release from an initially degraded BMA to the reasonable biosphere is estimated to be somewhat higher during the first thousand years after repository closure than for the case with degraded barriers after years (compare near-field release rate in Figure 6- and Figure 5-9). Later only small differences will be obtained. The effect of an initially degraded barrier in BTF or 2BTF on the maximum total dose for a reasonable biosphere will be the same as when the barrier is assumed to be degraded after years, see Section An initial fracture in the concrete bottom of the Silo does not affect the water flow rate through the Silo as long as the bentonite barriers are intact. The case with an initially degraded Silo has therefore not been studied. 77
74 Near-field release [Bq/yr] BMA-AS-IS 2 Ag-8m Am-24 C-4inorg C-4org Cl-36 Cs-35 Cs-37 H-3 Ho-66m I-29 Mo-93 Nb-93m Nb-94 Ni-59 Ni-63 Pd-7 Pu-239 Pu-24 Pu-242 Se-79 Sn-26 Sr-9 Tc-99 Zr-93 Time [yr, AD] Figure 6-. Near-field release rate from BMA with an initially degraded room 2. Far-field release [Bq/yr] BMA-AS-IS Ag-8m C-4inorg C-4org Cl-36 Cs-35 Cs-37 H-3 I-29 Mo-93 Nb-93m Nb-94 Ni-59 Ni-63 Pd-7 Se-79 Sn-26 Sr-9 Tc-99 Zr Time [yr, AD] Figure 6-2. Far-field release rate from BMA with an initially degraded room 2. 78
75 6.2 Chemicals The waste contains chemicals that may act as complexing agents for radionuclides. The waste also contains cellulose, which through alkaline degradation can form the strong complexing agent iso-saccarinic acid (ISA). Presence of complexing agents may reduce the nuclide s ability to sorb on different barrier materials within the repositories. In this study, this has been analysed by reducing the K d value in concrete/cement, bentonite, sand/bentonite and gravel of trivalent, tetravalent and pentavalent ions (SKB, 2a). All other data are identical to the main case within the base scenario. Since no sorption is accounted for in the migration model for BLA, no analysis has been made for this repository part. The main part of the nuclides dominating the near-field release rate and/or the dose in reasonable biosphere for the main case in the base scenario for Silo, BMA, BTF and 2BTF are not affected by chemicals. The exception is 59 Ni, 63 Ni, 94 Nb, 99 Tc, 26 Sn and different plutonium isotopes. Other nuclides are also affected but they give a limited contribution to the total dose. The release of radionuclides from Silo and BMA has also been calculated for a combined effect of chemicals and a degraded barrier after thousand years. No calculations have been made for BTF and 2BTF. Instead, based on the results for the case with chemicals and intact barriers and the knowledge of the effect of water flow through a degraded BTF and 2BTF, the effect of chemicals together with degraded barriers has been estimated. The results for each repository part are presented graphically in the next sections. The release rate from near field and far field is calculated for all 3 modelled nuclides. However, nuclides foreseen to be insignificant in terms of contribution to the total dose in recipient are not included in the biosphere modelling Silo Intact barriers The main difference for the near-field release between the main case (Figure 5-) and this case is that the release rates of 59 Ni and 99 Tc approaches that of organic 4 C when influenced by chemicals, Figure 6-3. Also, more nuclides reach a release rate of between 3 and 5 Bq/yr. For the reasonable biosphere development 99 Tc becomes the dominating nuclide from 8 AD and onwards. However, the maximum total dose is the same as for the main case, dominated by organic 4 C that is not influenced by chemicals. The maximum total dose from release to today s biosphere is also the same dominated by organic 4 C. For release to mire area on the other hand, the dose corresponding to the release of 59 Ni and 99 Tc increase and is about the same as for 79 Se (not influenced by chemicals) (see Figure 6-7). The total dose from 6 AD and onwards, and thus also the maximum total dose, is therefore increased by approximately a factor three. The maximum total dose from release to a well is obtained initially at 4 AD dominated by organic 4 C not influenced by chemicals. The total dose after that is increased by two to three times, mainly due to increase in dose from 99 Tc. 99 Tc becomes the dose dominating nuclide from about AD. 79
76 Near-field release [Bq/yr] Silo-AS-K Ag-8m C-4inorg C-4org Cl-36 Cs-35 Cs-37 H-3 I-29 Mo-93 Nb-93m Nb-94 Ni-59 Ni-63 Pd-7 Pu-239 Pu-24 Se-79 Sn-26 Sr-9 Tc-99 Zr Time [yr, AD] Figure 6-3. Near-field release rate from an intact Silo affected by chemicals. Dose [Sv/yr] Silo-AS-K C-4org Cl-36 Cs-35 I-29 Mo-93 Ni-59 Se-79 Tc-99 Total Time [yr, AD] Figure 6-4. Dose from release of radionuclides from an intact Silo affected by chemicals to the reasonable biosphere (calculations performed for dominating nuclides only). 8
77 Far-field release [Bq/yr] Silo-AS-K Ag-8m C-4inorg C-4org Cl-36 Cs-35 H-3 I-29 Mo-93 Nb-93m Nb-94 Ni-59 Ni-63 Pd-7 Se-79 Sn-26 Sr-9 Tc-99 Zr Time [yr, AD] Figure 6-5. Far-field release rate from an intact Silo affected by chemicals Silo-AS-K C-4org Total -5 Dose [Sv/yr] Time [yr, AD] Figure 6-6. Dose from release of radionuclides from an intact Silo affected by chemicals to today s biosphere (calculations performed for dominating nuclides only). 8
78 Dose [Sv/yr] Silo-AS-K Ag-8m C-4org Cl-36 Cs-35 I-29 Mo-93 Ni-59 Se-79 Tc-99 Total Time [yr, AD] Figure 6-7. Dose from release of radionuclides from an intact Silo affected by chemicals to a mire area (calculations performed for dominating nuclides only). Dose [Sv/yr] Silo-AS-K Ag-8m C-4org Cl-36 Cs-35 I-29 Mo-93 Ni-59 Se-79 Tc-99 Total Time [yr, AD] Figure 6-8. Dose from release of radionuclides from an intact Silo affected by chemicals to a well (calculations performed for dominating nuclides only). 82
79 Degraded barriers The release rates of many of the nuclides in the waste in the Silo, e.g. 59 Ni and 99 Tc, are affected both by chemicals and by degraded barriers. The near-field release rate of 59 Ni and 99 Tc for this case, shown in Figure 6-9, is about one order of magnitude higher than the case with only chemicals discussed previously in this section. Organic 4 C dominating the total dose for the reasonable biosphere is, however, considered to be unaffected by chemicals. The maximum total dose from release to the reasonable biosphere is about -5 Sv/yr at 5 AD given by organic 4 C, identical to that obtained for the case with degraded barriers after years, see Section After 8 AD, the total dose is dominated by 99 Tc. When the release occur to a mire area after 4 AD, the maximum total dose is estimated to be 7-6 Sv/yr, predominantly given by 79 Se. If the nuclides are released to a well, the total dose is approximately constant in time, with a maximum dose of 3-4 Sv/yr. The dose is initially dominated by organic 4 C, followed by 99 Tc from about 6 AD. Dose in today s biosphere has not been estimated for this case, since the dose is expected to be low. Near-field release [Bq/yr] Silo-BS6 Ag-8m C-4inorg C-4org Cl-36 Cs-35 Cs-37 H-3 I-29 Mo-93 Nb-93m Nb-94 Ni-59 Ni-63 Pd-7 Pu-239 Pu-24 Pu-242 Se-79 Sn-26 Sr-9 Tc-99 Zr Time [yr, AD] Figure 6-9. Near-field release rate from Silo affected by chemicals and being degraded from 3 AD. 83
80 Dose [Sv/yr] Silo-BS6 Ag-8m C-4org Cl-36 Cs-35 I-29 Mo-93 Nb-94 Ni-59 Pu-239 Pu-24 Se-79 Sn-26 Tc-99 Zr-93 Total Time [yr, AD] Figure 6-. Dose from release of radionuclides from Silo affected by chemicals and being degraded from 3 AD to the reasonable biosphere (calculations performed for dominating nuclides only). Far-field release [Bq/yr] Silo-BS6 Ag-8m C-4inorg C-4org Cl-36 Cs-35 H-3 I-29 Mo-93 Nb-93m Nb-94 Ni-59 Ni-63 Pd-7 Pu-239 Pu-24 Se-79 Sn-26 Sr-9 Tc-99 Zr Time [yr, AD] Figure 6-. Far-field release rate from Silo affected by chemicals and being degraded from 3 AD. 84
81 Dose [Sv/yr] Silo-BS6 Ag-8m C-4org Cl-36 Cs-35 I-29 Mo-93 Nb-94 Ni-59 Pd-7 Pu-239 Pu-24 Pu-242 Se-79 Sn-26 Tc-99 Zr-93 Total Time [yr, AD] Figure 6-2. Dose from release of radionuclides from Silo affected by chemicals and being degraded from 3 AD to a mire area (calculations performed for dominating nuclides only). Dose [Sv/yr] Silo-BS6 Ag-8m C-4org Cl-36 Cs-35 I-29 Mo-93 Nb-93m Nb-94 Ni-59 Ni-63 Pd-7 Pu-239 Pu-24 Pu-242 Se-79 Sn-26 Tc-99 Zr-93 Total Time [yr, AD] Figure 6-3. Dose from release of radionuclides from Silo affected by chemicals and being degraded from 3 AD to a well (calculations performed for dominating nuclides only). 85
82 6.2.2 BMA Intact barriers The release rate of 59 Ni and 99 Tc from the near field increases and exceeds that of organic 4 C from about 34 AD and 39 AD, respectively (see Figure 6-4). The release rate of these two nuclides ( 8 Bq/yr) is approximately constant in time from about 4 AD. The total dose for the reasonable biosphere development is determined by the release of organic 4 C up to 7 AD and since 4 C is not influenced by chemicals the dose is unchanged. From 8 AD and onwards the total dose increased about an order of magnitude when the effect of chemicals is accounted for in comparison to the main case within the base scenario (compare Figure 6-5 and Figure 5-4). The influence on dose in today s biosphere is negligible (compare Figure 6-7 and Figure 5-6). If the recipient is a mire area the total dose will increase two to three times from 4 AD and onwards. This is caused by the increased release of 59 Ni, 99 Tc, 239 Pu and 24 Pu (compare Figure 6-8 and Figure 5-7). The dose in well is also higher when chemicals are accounted for. A total dose of about.2.3 msv/yr is obtained between 4 AD and 2 AD. 99 Tc is the dose dominating nuclide but 59 Ni, 94 Nb, 239 Pu and 24 Pu also give a dose exceeding the total dose for the main case within the base scenario from about 5 AD. Near-field release [Bq/yr] BMA-AS-K 2 Ag-8m Am-24 C-4inorg C-4org Cd-3m Cl-36 Co-6 Cs-35 Cs-37 H-3 Ho-66m I-29 Mo-93 Nb-93m Nb-94 Ni-59 Ni-63 Pd-7 Pu-238 Pu-239 Pu-24 Pu-242 Se-79 Sn-26 Sr-9 Tc-99 Zr-93 Time [yr, AD] Figure 6-4. Near-field release rate from an intact BMA affected by chemicals. 86
83 Dose [Sv/yr] BMA-AS-K Ag-8m C-4inorg C-4org Cl-36 Cs-35 I-29 Mo-93 Nb-93m Nb-94 Ni-59 Pu-239 Pu-24 Pu-242 Se-79 Sn-26 Tc-99 Zr-93 Total Time [yr, AD] Figure 6-5. Dose from release of radionuclides from an intact BMA affected by chemicals to the reasonable biosphere (calculations performed for dominating nuclides only). Far-field release [Bq/yr] BMA-AS-K Ag-8m C-4inorg C-4org Cl-36 Cs-35 Cs-37 H-3 I-29 Mo-93 Nb-93m Nb-94 Ni-59 Ni-63 Pd-7 Pu-239 Pu-24 Pu-242 Se-79 Sn-26 Sr-9 Tc-99 Zr Time [yr, AD] Figure 6-6. Far-field release rate from an intact BMA affected by chemicals. 87
84 BMA-AS-K C-4org Total -5 Dose [Sv/yr] Time [yr, AD] Figure 6-7. Dose from release of radionuclides from an intact BMA affected by chemicals to today s biosphere (calculations performed for dominating nuclides only). Dose [Sv/yr] BMA-AS-K Ag-8m Am-24 C-4inorg C-4org Cl-36 Cs-35 I-29 Mo-93 Nb-94 Ni-59 Ni-63 Pd-7 Pu-239 Pu-24 Pu-242 Se-79 Sn-26 Tc-99 Zr-93 Total Time [yr, AD] Figure 6-8. Dose from release of radionuclides from an intact BMA affected by chemicals to a mire area (calculations performed for dominating nuclides only). 88
85 Dose [Sv/yr] BMA-AS-K Ag-8m Am-24 C-4inorg C-4org Cl-36 Cs-35 Ho-66m I-29 Mo-93 Nb-93m Nb-94 Ni-59 Ni-63 Pd-7 Pu-239 Pu-24 Pu-242 Se-79 Sn-26 Tc-99 Zr-93 Total Time [yr, AD] Figure 6-9. Dose from release of radionuclides from an intact BMA affected by chemicals to a well (calculations performed for dominating nuclides only). Degraded barriers The combined effect of chemicals and degraded barriers has a smaller impact on the results for BMA than for the Silo. Comparing the near-field release rate for this case (Figure 6-2) with the case affected by chemicals (Figure 6-4) it is seen that there is a small increase in the release rate of 59 Ni and 99 Tc between 3 AD and 4 AD for the combined effect. From 5 AD, however, the release rate is approximately the same for the two cases. For other nuclides, e.g. 66m Ho, 239 Pu, 24 Pu and 24 Am, there is a larger difference. The release rates of 239 Pu and 24 Pu are at most one order of magnitude higher for the case with the combined effect. This is obtained around 5 AD. The difference decreases with time and around 2 AD the release rate of 239 Pu and 24 Pu are more or less the same for the two cases. As was stated in Chapter 5, the near-field release rate of organic 4 C is almost unaffected by the increase in water flow caused by degradation, and is not affected by chemicals. Accordingly, the nearfield release rate of organic 4 C for the combined effect of chemicals and degraded barriers is identical to that for degraded barriers (see Section 5.2.2). The total dose for release of radionuclides from BMA to the reasonable biosphere will initially to a large extent be the same as for the case with chemicals and intact barriers discussed in the previous section. The total dose up to 8 AD is equivalent to that obtained for degraded barriers, see Section 5.2.2, since the dominating nuclides, organic 4 C and inorganic 4 C, are not affected by chemicals. For longer times, after 8 AD, 239 Pu and 24 Pu result in the highest dose. An increase in total dose from 8 AD and onwards of less than a factor two in comparison to that shown in Figure 6-5 is obtained. 89
86 If the nuclides are released to a mire area instead, the dose corresponding to 79 Se, 239 Pu and 24 Pu will predominantly dominate the dose. Dose from release to a well is dominated by 99 Tc, 239 Pu and 24 Pu. The maximum total dose for release to mire area is about -5 Sv/yr and for release to a well about 9-4 Sv/yr. Dose in today s biosphere has not been estimated for this case. The dose is expected to be low based on the results from the case with increased water flow rate through BMA discussed in Chapter 5 and the effect of chemicals in an intact BMA discussed above. Near-field release [Bq/yr] Time [yr, AD] BMA-BS6 2 Ag-8m Am-24 C-4inorg C-4org Cd-3m Cl-36 Co-6 Cs-35 Cs-37 H-3 Ho-66m I-29 Mo-93 Nb-93m Nb-94 Ni-59 Ni-63 Pd-7 Pu-238 Pu-239 Pu-24 Pu-242 Se-79 Sn-26 Sr-9 Tc-99 Zr-93 Figure 6-2. Near-field release rate from BMA affected by chemicals and being degraded from 3 AD. 9
87 Dose [Sv/yr] BMA-BS6 Ag-8m C-4inorg C-4org Cl-36 Cs-35 I-29 Mo-93 Nb-93m Nb-94 Ni-59 Pu-239 Pu-24 Pu-242 Se-79 Sn-26 Tc-99 Zr-93 Total Time [yr, AD] Figure 6-2. Dose from release of radionuclides from BMA affected by chemicals and being degraded from 3 AD to the reasonable biosphere (calculations performed for dominating nuclides only). Far-field release [Bq/yr] BMA-BS6 Ag-8m C-4inorg C-4org Cl-36 Cs-35 Cs-37 H-3 I-29 Mo-93 Nb-93m Nb-94 Ni-59 Ni-63 Pd-7 Pu-239 Pu-24 Pu-242 Se-79 Sn-26 Sr-9 Tc-99 Zr Time [yr, AD] Figure Far-field release rate from BMA affected by chemicals and being degraded from 3 AD. 9
88 Dose [Sv/yr] BMA-BS6 Ag-8m C-4inorg C-4org Cl-36 Cs-35 I-29 Mo-93 Nb-94 Ni-59 Ni-63 Pd-7 Pu-239 Pu-24 Pu-242 Se-79 Sn-26 Tc-99 Zr-93 Total Time [yr, AD] Figure Dose from release of radionuclides from BMA affected by chemicals and being degraded from 3 AD to a mire area (calculations performed for dominating nuclides only). Dose [Sv/yr] BMA-BS6 Ag-8m C-4inorg C-4org Cl-36 Cs-35 I-29 Mo-93 Nb-93m Nb-94 Ni-59 Ni-63 Pd-7 Pu-239 Pu-24 Pu-242 Se-79 Sn-26 Tc-99 Zr-93 Total Time [yr, AD] Figure Dose from release of radionuclides from BMA affected by chemicals and being degraded from 3 AD to a well (calculations performed for dominating nuclides only). 92
89 6.2.3 BTF Intact barriers The results for the near-field release rate of nuclides affected by chemicals in BTF are given in Figure The release rate of 59 Ni and 99 Tc exceeds that of organic 4 C from about 48 AD. The release rate of these two nuclides is about one order of magnitude lower than from BMA. The main effect of chemicals on the dose is caused by the increased release of 59 Ni, 99 Tc, 239 Pu and 24 Pu. This causes the maximum total dose for release to a mire area to increase by a factor two in comparison to the main case within the base scenario discussed in Section 5.3., even though 79 Se still dominates the total dose (see Figure 6-29). The maximum dose for release to the reasonable biosphere (Figure 6-26) or a well (Figure 6-3) increases marginally in comparison to the main case, to today s biosphere (Figure 6-28) not at all. However, in contradiction to the main case, the total dose in the well is almost constant from about 4 AD to 2 AD when the effect of chemicals is accounted for (see Figure 6-3). Near-field release [Bq/yr] BTF-AS-K 2 Ag-8m Am-24 C-4inorg C-4org Cl-36 Co-6 Cs-35 Cs-37 H-3 I-29 Mo-93 Nb-93m Nb-94 Ni-59 Ni-63 Pd-7 Pu-239 Pu-24 Pu-242 Se-79 Sn-26 Sr-9 Tc-99 Zr-93 Time [yr, AD] Figure Near-field release rate from an intact BTF affected by chemicals. 93
90 Dose [Sv/yr] BTF-AS-K Ag-8m C-4inorg C-4org Cl-36 Cs-35 I-29 Mo-93 Nb-93m Nb-94 Ni-59 Pu-239 Pu-24 Pu-242 Se-79 Sn-26 Tc-99 Total Time [yr, AD] Figure Dose from release of radionuclides from an intact BTF affected by chemicals to the reasonable biosphere (calculations performed for dominating nuclides only). Far-field release [Bq/yr] BTF-AS-K Ag-8m C-4inorg C-4org Cl-36 Cs-35 H-3 I-29 Mo-93 Nb-93m Nb-94 Ni-59 Ni-63 Pd-7 Pu-239 Pu-24 Se-79 Sn-26 Sr-9 Tc-99 Zr Time [yr, AD] Figure Far-field release rate from an intact BTF affected by chemicals. 94
91 BTF-AS-K C-4org Total -5 Dose [Sv/yr] Time [yr, AD] Figure Dose from release of radionuclides from an intact BTF affected by chemicals to today s biosphere (calculations performed for dominating nuclides only). Dose [Sv/yr] BTF-AS-K Ag-8m Am-24 C-4inorg C-4org Cl-36 Cs-35 I-29 Mo-93 Nb-94 Ni-59 Pu-239 Pu-24 Pu-242 Se-79 Sn-26 Tc-99 Zr-93 Total Time [yr, AD] Figure Dose from release of radionuclides from an intact BTF affected by chemicals to a mire area (calculations performed for dominating nuclides only). 95
92 Dose [Sv/yr] BTF-AS-K Ag-8m Am-24 C-4inorg C-4org Cl-36 Cs-35 I-29 Mo-93 Nb-93m Nb-94 Ni-59 Ni-63 Pd-7 Pu-239 Pu-24 Pu-242 Se-79 Sn-26 Tc-99 Zr-93 Total Time [yr, AD] Figure 6-3. Dose from release of radionuclides from an intact BTF affected by chemicals to a well (calculations performed for dominating nuclides only). Degraded barriers In Section it was stated that the water flow through BTF with part of the vault being degraded locally increases up to a factor six. However, the total water flow through the whole vault increases with no more than a factor two in comparison to an intact barrier. In accordance with the discussion in Section 5.3.2, a combined effect of chemicals and degraded barriers in BTF could give a total dose for the reasonable biosphere that is not more than a factor two higher than that for the case with chemicals and intact barriers. The total dose is expected to be dominated by organic and inorganic 4 C until 8 AD and from that by 99 Tc BTF Intact barriers The near-field release rate for nuclides affected by chemicals from an intact 2BTF is shown in Figure Ni and 99 Tc gives the highest near-field release rate from about 35 AD. The effect of chemicals in 2BTF on dose in recipients is to a large extent the same as for BTF discussed in Section The increase in dose in the reasonable biosphere development is however larger than for BTF. The maximum dose is in this case mainly achieved from 99 Tc at 8 AD and is 4-7 Sv/yr. 96
93 Near-field release [Bq/yr] BTF2-AS-K 2 Ag-8m Am-24 C-4inorg C-4org Cd-3m Cl-36 Co-6 Cs-35 Cs-37 H-3 I-29 Mo-93 Nb-93m Nb-94 Ni-59 Ni-63 Pd-7 Pu-239 Pu-24 Pu-242 Se-79 Sn-26 Sr-9 Tc-99 Zr-93 Time [yr, AD] Figure 6-3. Near-field release rate from an intact 2BTF affected by chemicals. Dose [Sv/yr] BTF2-AS-K Ag-8m C-4inorg C-4org Cl-36 Cs-35 I-29 Mo-93 Nb-93m Nb-94 Ni-59 Pu-239 Pu-24 Pu-242 Se-79 Sn-26 Tc-99 Zr-93 Total Time [yr, AD] Figure Dose from release of radionuclides from an intact 2BTF affected by chemicals to the reasonable biosphere (calculations performed for dominating nuclides only). 97
94 Far-field release [Bq/yr] BTF2-AS-K Ag-8m C-4inorg C-4org Cl-36 Cs-35 Cs-37 H-3 I-29 Mo-93 Nb-93m Nb-94 Ni-59 Ni-63 Pd-7 Pu-239 Pu-24 Se-79 Sn-26 Sr-9 Tc-99 Zr Time [yr, AD] Figure Far-field release rate from an intact 2BTF affected by chemicals BTF2-AS-K C-4org Total -5 Dose [Sv/yr] Time [yr, AD] Figure Dose from release of radionuclides from an intact 2BTF affected by chemicals to today s biosphere (calculations performed for dominating nuclides only). 98
95 Dose [Sv/yr] BTF2-AS-K Ag-8m Am-24 C-4inorg C-4org Cl-36 Cs-35 I-29 Mo-93 Nb-94 Ni-59 Pu-239 Pu-24 Pu-242 Se-79 Sn-26 Tc-99 Zr-93 Total Time [yr, AD] Figure Dose from release of radionuclides from an intact 2BTF affected by chemicals to a mire area (calculations performed for dominating nuclides only). Dose [Sv/yr] BTF2-AS-K Ag-8m Am-24 C-4inorg C-4org Cl-36 Cs-35 I-29 Mo-93 Nb-93m Nb-94 Ni-59 Ni-63 Pd-7 Pu-239 Pu-24 Pu-242 Se-79 Sn-26 Tc-99 Zr-93 Total Time [yr, AD] Figure Dose from release of radionuclides from an intact 2BTF affected by chemicals to a well (calculations performed for dominating nuclides only). 99
96 Degraded barriers The results for chemicals and degraded barriers in 2BTF are to a large extent foreseen to be the same as for the same case for BTF. However, the total dose for the reasonable biosphere development is expected to be dominated by organic 4 C for a shorter period of time, but will be followed by 99 Tc for 2BTF as well. The maximum dose will probably be determined by 99 Tc at 8 AD as in the case with chemicals and intact barriers. 6.3 Permafrost The climate is foreseen to be colder in the future, and thus permafrost could be obtained in the region. It has been estimated that this could happen earliest in 7 AD (SKB, 2b). To get a rough estimate of the consequence of permafrost, it is assumed that the repository is a frozen system from repository closure until 2 AD when the permafrost period is assumed to have ended. No radionuclides have been released before 2 AD, but radioactive decay for years has caused the initial inventory to be reduced. All materials within the repository are mechanically degraded. The water flow is therefore homogeneously distributed within each repository part, and the radionuclides are transported out with the total flow in the repository part. The magnitude of the water flow rate is chosen to be the highest flow obtained within the hydrogeology modelling of SFR (Holmén and Stigsson, 2a). Sorption has been accounted for all barrier materials that are included in the near-field models. The release is calculated as an instant release at 2 AD and the dose is calculated for the recipient that is representative for today s biosphere conditions. The result in terms of total dose from each repository part is shown in Figure Organic 4 C dominates the dose for the Silo, BMA, BTF and 2BTF. For BLA the dose dominating nuclides are inorganic 4 C, 239 Pu and 24 Pu. Since there is a significant dilution in the recipient (Öregrundsgrepen), the dose is very low. The total dose for SFR is -9 Sv/yr. E-2 E-3 E-4 Total dose [Sv/yr] E-5 E-6 E-7 E-8 E-9 E- E- SILO BMA BTF 2BTF BLA Figure Total dose at 2 AD for permafrost scenario.
97 6.4 Human intrusion A human intrusion scenario has been analysed in which a well is sunk directly into the gravel backfill in each repository part. Long-term effects have not been considered. Instead, the dose to man obtained at the time when the well is sunk is evaluated. This scenario can not be realised until the coastline has past the repository, i.e. from 3 AD. Here, the scenario has been analysed assuming the well is sunk at 3 AD, 4 AD or 5 AD. In the calculations it is assumed for each repository part that the nuclide concentration in the well water is the same as the highest concentration in any part of the gravel backfill when the well is sunk. The concentrations are obtained from the migration calculations for the main case within the base scenario. The nuclide concentrations has been transformed into a dose using ingestion dose conversion factors (EU, 996) and assuming a water consumption rate of 6 l/yr. The total dose for each repository part for the defined intrusion scenario is shown in Figure The highest total dose is obtained from a well in BLA if the well is sunk at 3 AD. If the well is sunk at 4 AD or 5 AD on the other hand, a well in the Silo will result in the highest total dose. The dose dominating nuclide in BLA is 24 Pu whereas 4 C dominate in the other repositories. E- E-2 3 AD 4 AD 5 AD Total dose [Sv/yr] E-3 E-4 E-5 E-6 SILO BMA BTF 2BTF BLA Figure Total dose for the analysed human intrusion scenario.
98 7 Summary of results The consequences of migration of radionuclides from SFR have been analysed for a base scenario. The base scenario describes the expected evolution of the repository s near field. Three different cases are defined within the base scenario. Intact barriers (main case) and degraded barriers after years are discussed in this report. The third case, gas influenced nuclide transport, is analysed in Moreno et al. (2). Uncertainties in the biosphere development are taken into account by evaluating the consequences of releases to a reasonable biosphere, to today s biosphere, to a mire area and to a well. Besides the base scenario, the effect of initially degraded barriers and the effect of the presence of materials in the waste that drastically deteriorate the possibility for nuclides to sorb on the barriers are analysed. In addition, a permafrost scenario and a human intrusion scenario are analysed. In this last chapter, a conclusive summary of the results from the modelling of migration of radionuclides and corresponding doses in the biosphere is made. The main part of this chapter is devoted to the results for the base scenario, and then mainly the main case. Other scenarios are discussed more briefly. The maximum dose for all investigated cases is summarised in Table Base scenario 7.. Intact barriers The total dose from release of radionuclides from an intact SFR with a reasonable biosphere development is shown in Figure 7-. The total dose is initially dominated by the release of 37 Cs from BLA. From about 225 AD to 4 AD the dose is dominated by the release of organic 4 C from BTF and BMA. Between 4 AD and 8 AD organic 4 C from the Silo dominates the dose. The dominating pathway for exposure from 37 Cs as well as from organic 4 C is, during this whole time period, consumption of fish. The maximum total dose from SFR, 4-6 Sv/yr, is obtained when the recipient is changed from coast to a lake at 5 AD. The dose from organic 4 C is reduced significantly when the recipient is changed from a lake to agricultural land at 8 AD. Instead, 239 Pu and 24 Pu in BLA dominate the dose. The reason for the drastically decrease in dose from organic 4 C is the fact that carbon is not taken up in vegetation by roots. The exposure in the agricultural land model (which for most radionuclides is a product of root uptake) is therefore much lower. The uptake of carbon in fish is very large in the lake model comparing to most other nuclides making this contrast even larger. The most important pathways for exposure from 239 Pu and 24 Pu is inhalation of contaminated dust. 3
99 Silo BMA BTF 2BTF BLA Total Dose [Sv/yr] Time [yr, AD] Figure 7-. Total dose from release of radionuclides from SFR to the reasonable biosphere. An alternative to the reasonable biosphere development (coast, lake and agricultural land) is the development of mire. A mire can be formed at 4 AD earliest (Kautsky, 2). The total dose from release to a mire area from an intact SFR is shown in Figure 7-2. Initially the total dose is dominated by the release of 239 Pu and 24 Pu from BLA, but the dose from radionuclides from BMA increases with time and exceeds that for BLA from 54 AD. The dose from radionuclides in BMA is completely dominated by the release of 79 Se. The total dose is more or less constant in time with a maximum of 6-6 Sv/yr around 47 AD. The dose gained from exposure from 239 Pu and 24 Pu is due to inhalation of contaminated dust from the mire area. In contrast, the exposure from 79 Se is mainly through consumption of cereals and also through consumption of milk. 79 Se is to a large extent retained on the solid phase of the peat. This in combination with a large uptake by vegetation makes the potential of exposure large compared to other nuclides when a mire is chosen as a recipient. 4
100 Silo BMA BTF 2BTF BLA Total Dose [Sv/yr] Time [yr, AD] Figure 7-2. Total dose from release of radionuclides from SFR to a mire area. Release to a well has also been analysed. It is assumed that the well has a capacity of 2.37 m 3 /day and that it can be sunk no earlier than 4 AD. Furthermore, the hydrogeological calculations show that the well may be placed so that either the release from all vaults or the release from the Silo will end up in the well (Holmén and Stigsson, 2a). The consequence of a release from an intact SFR to a well is shown in Figure Pu and 24 Pu in BLA dominates the total dose for release from the vaults and organic 4 C dominate the release from the Silo. The maximum total dose for release from the vaults is 4-4 Sv/yr and from the Silo 5-5 Sv/yr. The dominating pathway for exposure from 239 Pu and 24 Pu is inhalation of contaminated dust from a garden plot, which is irrigated with the well water. For exposure from organic 4 C consumption of water is the most important exposure pathway followed by consumption of root crops and milk. 5
101 Dose [Sv/yr] BMA BTF 2BTF BLA Total vaults Silo Time [yr, AD] Figure 7-3. Total dose from release of radionuclides from SFR to a well. Release to today s biosphere results in a maximum dose of -8 Sv/yr obtained shortly after repository closure. With the exception of this instant release the maximum release rate is less than 6 - Sv/yr Degraded barriers Degraded barriers lead to a higher flow rate of water through the repository, and thus an increased release rate for some nuclides. The effect of a degraded barrier in Silo and BMA years after repository closure on total dose for the reasonable biosphere development is shown in Figure 7-4. The maximum total dose for a degraded Silo increases with a factor of three in comparison to intact barriers (9-6 Sv/yr vs 3-6 Sv/yr). From 8 AD and onwards this ratio increases to about an order of magnitude. It is the same nuclides that dominate the dose for both cases. The main difference between an intact and a degraded barrier in BMA is that the release rate of inorganic 4 C increases up to a factor 2 with the higher water flow rate, and that 239 Pu and 24 Pu become two of the dose dominating nuclides from 8 AD and onwards. For an intact BMA organic 4 C dominates the dose until 8 AD (see Figure 5-4). However, when BMA has degraded after years organic and inorganic 4 C give about equal contributions to the maximum total dose at 5 AD (see Figure 5-2). From that point, the dose from organic 4 C decreases why inorganic 4 C becomes the dose dominating nuclide between 55 AD and 8 AD. The maximum total dose for a degraded BMA is -6 Sv/yr which is a factor two higher than for an intact barrier in BMA. Based on results from the hydrogeology modelling (Holmén and Stigsson, 2a) it is estimated that the total dose for BTF and 2BTF should not increase with more than a factor two in comparison to the main case. 6
102 The total release from vaults and Silo will give a maximum total dose for the reasonable biosphere of -5 Sv/yr. For the alternative recipients the maximum total dose will be -8 Sv/yr (today s biosphere) and < 2-5 Sv/yr (mire area), respectively. Release to a well from all vaults will give a maximum total dose of no more than 5-4 Sv/yr or from the Silo 2-4 Sv/yr Degraded Silo Intact Silo Degraded BMA Intact BMA -5 Dose [Sv/yr] Time [yr, AD] Figure 7-4. Comparison of total dose for a reasonable biosphere from release of radionuclides in Silo and BMA when the repository is a) intact and b) degraded. 7.2 Initially degraded barriers A calculation made for an initial fracture through the concrete encapsulation in room 2 of BMA shows that slightly higher near-field release rates can be obtained during the first years after repository closure compared to the release rates obtained when the fracture arises years after closure. The release rates for the two cases are almost the same after years. Thus, it is estimated that the maximum total dose will be the same regardless of if there is an initial fracture or if it arises after years. This will also be the case for a fracture through BTF or 2BTF. An initial fracture in the concrete bottom of the Silo is not foreseen to affect release rates from the Silo as long as the bentonite barriers are intact. 7.3 Chemicals This scenario analyses the effect of a reduced possibility for nuclides to sorb on the barriers. The most important effect of chemicals is a significant increase in near-field release rate of 59 Ni, 99 Tc, 239 Pu and 24 Pu. 59 Ni and 99 Tc give a significant contribution to the dose for release to the reasonable biosphere (especially when the recipient is agricultural land), mire area and well. The maximum dose for the reasonable biosphere 7
103 development is obtained at 5 AD, dominated by organic 4 C from the Silo. At 8 AD the dose is dominated by 99 Tc from BMA at almost the same level as the maximum dose. Release to a well is dominated by the release from BMA. The maximum total dose is 4-4 Sv/yr dominated by 99 Tc, 239 Pu and 24 Pu. Dose obtained in mire area by release from a repository uninfluenced by chemicals is entirely dominated by 79 Se. The same nuclide dominate the dose in mire area also for the scenario Chemicals but several other nuclides (e.g. 59 Ni, 99 Tc, 239 Pu and 24 Pu) add to the total dose. Today s biosphere is to a large extent unaffected by chemicals. Since sorption is not accounted for in BLA in any of the studied cases, no analysis of the effect of chemicals in BLA has been made. The same result is therefore used for BLA when estimating the total dose for SFR with and without the effect of chemicals. There is an increase in total dose for the reasonable biosphere from 8 AD and onwards and for the wells, which mainly is caused by the higher release rate of 99 Tc. The dominating pathway for exposure from this nuclide is in both recipients the consumption of vegetables. Unfortunately, a too high translocation factor was used in the biosphere modelling of 99 Tc by mistake. This is only of importance when the well is used as recipient and the calculated doses are estimated to be about 2 % too high Reasonable Today's biosphere Mire area Well (vaults) Well (silo) Dose [Sv/yr] Time [yr, AD] Figure 7-5. Comparison of total doses for different biospheres from release of radionuclides from an intact SFR a) with (solid line) and b) without (dashed line) the effect of chemicals. 8
104 The combined effect of chemicals and degraded barriers after years in Silo and BMA gives a maximum dose for the reasonable biosphere of 9-6 Sv/yr and 4-6 Sv/yr, respectively. The corresponding dose for release to a mire area is 7-6 Sv/yr (Silo) and -5 Sv/yr (BMA), and for release to a well 3-4 Sv/yr (Silo) and 9-4 Sv/yr (BMA). 7.4 Far field Transport through the far field (geosphere) delays the release of radionuclides to the biosphere. How effective the far field rock is as a barrier varies from nuclide to nuclide, but is also dependent on the effectiveness of the barriers in the near field. The influence of the far field on the release rate of the majority of the dose dominating nuclides is in general small. The far field has the largest effect on the release of short-lived nuclides like 3 H, 63 Ni, 9 Sr, 8m Ag and 37 Cs. However, these nuclides have a limited influence on the maximum total dose for the different repository parts, with the exception of BLA. The far field has a larger effect on the release of radionuclides from BLA to the biosphere than for the other repository parts. This is due to the limited technical barrier system in BLA. The far field delays the release, which for the cases with unchanged biosphere with time implies a lower dose. However, for the reasonable biosphere development the delay implies that the dose obtained for some nuclides is higher when the far filed is included. 7.5 Permafrost The analysis of the permafrost scenario gives a total dose that is less than -9 Sv/yr assuming a recipient corresponding to today s biosphere. This dose is a factor ten lower than the maximum total dose for release to today s biosphere within the base scenario. 7.6 Human intrusion The human intrusion scenario is represented by a case in which a well is sunk directly into one of the vaults or the Silo. It is assumed that someone drinks the water that is pumped out from the gravel backfill in each repository part. No dilution effects have been accounted for. The resulting doses are -2 Sv/yr (Silo), 5-3 Sv/yr (BMA), 9-3 Sv/yr (BTF), -3 Sv/yr (2BTF) and 3-2 Sv/yr (BLA). 9
105 7.7 Summary of doses The maximum doses obtained for the different cases studied are compiled in Table 7-. Table 7-. Maximum dose for the investigated cases. Maximum total dose [Sv/yr] Case Silo BMA BTF 2BTF BLA Total Biosphere Base scenario Intact barriers Reasonable biosphere development Mire area > 4 AD a) Well >4 AD Today s biosphere Degraded barriers Other scenarios Initially degraded barriers Chemicals intact barriers Chemicals degraded barriers < b) < b) c). -5 Reasonable biosphere development <. -6 b) <. -6 b) c) < b) Mire area > 4 AD <. -4 b) < b) c) < a,b) Well >4 AD < -9 b) < 6. - b). -8 c). -8 Today s biosphere < b) < b) c). -5 Reasonable biosphere development <. -6 b) <. -6 b) c) < b) Mire area > 4 AD <. -4 b) < b) c) < a,b) Well >4 AD < -9 b) < 6. - b). -8 c). -8 Today s biosphere c) Reasonable biosphere development c). -5 Mire area > 4 AD c) a) Well >4 AD c). -8 Today s biosphere < b) < b) c). -5 Reasonable biosphere development < b) < b) c) < b) Mire area > 4AD < b) < b) c) <. -3 a,b) Well >4 AD Permafrost Today s biosphere Intrusion well in Drinking well water repository a) Total maximum dose for vaults b) Estimated doses for BTF och 2BTF c) Base scenario valid for this case also, since BLA has no barriers
106 References Andersson J., Hermansson J., Elert M., Gylling B., Moreno L. and Selroos J-O. (998) Derivation and treatment of the flow wetted surface and other geosphere parameters in the transport models FARF3 and COMP23 for use in safety assessment, SKB report R-98-6, Swedish Nuclear Fuel and Waste Management Co, Stockholm. Bergström U., Edlund O., Evans S. and Röjder B. (982) BIOPATH - A computer code for calculation of the turnover of nuclides in the biosphere and the resulting doses to man. Studsvik AB, Nyköping, Sweden, Studsvik report STUDSVIK/NW-82/26. Bergström U., Nordlinder S. and Aquilonius K. (995) Assessment model validity document. BIOPATH/PRISM: codes for calculating turnover of radionuclides in the biosphere and dose to man. SKB report AR 95-9, Swedish Nuclear Fuel and Waste Management Co, Stockholm. BIOMOVS (996) Biosphere modelling for dose assessment of radioactive waste repositories. Final Report of the Complementary Studies Working Group. Swedish Radiation Protection Institute, Stockholm, BIOMOVS II Technical Report No. 9. Davis P.A., Zach R., Stephens M.E., Amiro B.D., Bird G.A., Reid J.A.K., Sheppard M.I., Sheppard S.C. and Stephenson M. (993) The disposal of Canada s Nuclear Fuel Waste: The Biosphere Model BIOTRAC, for Postclosure Assessment. AECL Research, Whiteshell Laboratories, Pinawa, Manitoba, Report AECL 72, COG-93-. Eriksson L., Hermasson H., Elert M., Lindgren M. and Widén H. (999) FARF3 Version. - Including the capability of nuclide specific diffusivity coefficients, SKB report TS-99-5, Swedish Nuclear Fuel and Waste Management Co, Stockholm. EU (996) Rådets direktiv 96/29/Euratom av den 3 maj, 996, Published in the European community's official journal, L 59, June 29, 996 (in Swedish). Fanger G., Skagius K. and M. Wiborgh (2) Project SAFE Complexing agents in SFR, SKB report R--4, Swedish Nuclear Fuel and Waste Management Co, Stockholm. Firestone R B (998) Table of Isotopes, 8 th ed., 998 Update, Ed. C M Baglin, John Wiley & Sons, Inc., New York. Gardner, R. H., Röjder, B. and Bergström, U. (983) PRISM - A systematic method for determining the effect of parameter uncertainties on model predictions. Studsvik AB, Sweden (Studsvik Report STUDSVIK/NW-83/555). Holmén J.G. and Stigsson M. (2a) Project SAFE - Modelling of future hydrogeological conditions at SFR, Forsmark, SKB report R--2, Swedish Nuclear Fuel and Waste Management Co, Stockholm. Holmén J.G. and Stigsson M. (2b) Details of predicted flow in deposition tunnels at SFR, Forsmark, SKB report R--2, Swedish Nuclear Fuel and Waste Management Co, Stockholm. Höglund L. O. (2) Project SAFE - Modelling of long-term concrete degradation processes in the Swedish SFR repository, SKB report R--8, Swedish Nuclear Fuel and Waste Management Co, Stockholm.
107 Karlsson S., Bergström U. and Meili M. (2) Models for dose assessments. Models adapted to the SFR-area, Sweden, SKB Technical report TR -4, Swedish Nuclear Fuel and Waste Management Co, Stockholm. Kautsky U. (ed.) (2) The biosphere today and tomorrow in the SFR area. A summary of knowledge for the SAFE project, SKB report R--27, Swedish Nuclear Fuel and Waste Management Co, Stockholm. Lindgren M. and Pers K. (99) Radionuclide release and dose from the SFR repository during the inland period, SKB report SFR 9-8, Swedish Nuclear Fuel and Waste Management Co, Stockholm. Moreno L, Skagius K, Södergren S and Wiborgh M. (2) Project SAFE Gas related processes in SFR, SKB report R--, Swedish Nuclear Fuel and Waste Management Co, Stockholm. Neretnieks I., Arve S., Moreno L., Rasmuson A. and Zhu M. (987) Degradation of concrete and transport of radionuclides from SFR - repository for low- and intermediate level nuclear waste, SKB report SFR 87-, Swedish Nuclear Fuel and Waste Management Co, Stockholm. Norman S. and Kjellbert N. (99) FARF3- A far field radionuclide migration code for use in the PROPER package, SKB Technical report TR 9-, Swedish Nuclear Fuel and Waste Management Co, Stockholm. Pettersson M. and Elert M. (2) Project SAFE Characterisation of bitumenised waste in SFR, SKB report R--26, Swedish Nuclear Fuel and Waste Management Co, Stockholm. Riggare P. and Johansson C. (2) Project SAFE - low and intermediate level waste in SFR-. Reference waste inventory, SKB report R--3, Swedish Nuclear Fuel and Waste Management Co, Stockholm. Romero L. (995) The near-field transport in a repository for high-level nuclear waste, Ph.D Thesis, TRITA-KET R2, The Royal Institute of Technology, Stockholm. Romero L., Thompson A., Moreno L., Neretnieks I., Widén H. and Boghammar A. (999) COMP23/NUCTRAN User's Guide, SKB report R-99-64, Swedish Nuclear Fuel and Waste Management Co, Stockholm. Savage D., Stenhouse M., and M. Benbow (2) Evolution of near-field physicochemical characteristics of the SFR repository, SKI Report :49, Swedish Nuclear Power Inspectorate, Stockholm. SKB (2a) Project SAFE - Compilation of data for radionuclide transport analysis, SKB report R--4, Swedish Nuclear Fuel and Waste Management Co, Stockholm. SKB (2b) Project SAFE Scenario and system analysis, SKB Report R--3, Swedish Nuclear Fuel and Waste Management Co, Stockholm. SSI (998) Statens strålskyddsinstituts föreskrifter om skydd av människors hälsa och miljön vid slutlig omhändertagande av använt kärnbränsle och kärnavfall (Swedish Radiation Protection Institute s Code of Statutes), SSI FS 998:, SSI, Stockholm. Wiborgh M., Bengtsson A., Pers K. and Lindgren M. (987) Radionuclide release from the near field in SFR, SKB report SFR 87-, Swedish Nuclear Fuel and Waste Management Co, Stockholm. 2
108 Appendix A: Check of screening of nuclides
109 The inventory for SFR comprises 59 radionuclides (Riggare and Johansson, 2) but only 42 of these are considered to be of importance for the safety assessment (SKB, 2). However, in order to reduce the time needed for calculation of radionuclide release and dose, the number of nuclides studied was reduced to 3. The inventory for 24 Pu was included in 24 Am, which simplifies the calculations and give a reasonable description of the release of both nuclides. This implies that calculations were performed for 29 nuclides. Based on experience of the influence of sorption on the radionuclide release from other studies of for example SFR and SFL 3-5 totally 2 nuclides were excluded since they were expected to give a negligible contribution to the calculated total dose. The 2 nuclides that were excluded from the calculations are 232 U, 234 U, 235 U, 236 U, 238 U, 237 Np, 242m Am, 243 Am, 243 Cm, 244 Cm, 245 Cm and 246 Cm. In this Appendix this expectation is checked. The steps in the check are: Looking at the initial inventory and influence of chain decay. If, during the studied time period, significant contribution from mother(s) is achieved the whole contribution were included as initial inventory. Based on the sorption data reference nuclides were chosen. The calculated dose from the reference nuclide in relation to the total dose for the different calculation cases and biospheres are used to estimate whether the actual nuclide contribute to the total dose or not. A relative dose was calculated, i.e. the dose calculated from ingestion of the initial inventory (including the contribution from mother) for the nuclide in comparison to the reference nuclide. Possible difference in uptake mechanisms in the biosphere of the actual nuclide and the reference nuclide was controlled by comparison between dose conversion factors from SR 97. The influence of chain decay is negligible for most of the 2 nuclides, since they are either mothers or daughters to long-lived mothers. This concerns 232 U, 235 U, 238 U, 242m Am, 243 Am, 243 Cm, 244 Cm, 245 Cm and 246 Cm. For three nuclides the contribution from mothers must be included. For 234 U contribution from 238 Pu results in a 2 % higher initial inventory if all the decay of the mothers is included in the initial inventory. For 236 U the contribution from the mother is totally 6 % during all time. The contribution to 237 Np is 5 % for the tunnels and 4 % for the Silo. The choice of reference nuclide is based on sorption data, see Table A-. As can be seen in the table uranium and neptunium have sorption data equal to plutonium in concrete/cement as well as in sand/gravel. This implies that 24 Pu is chosen as reference for BMA, BTF and 2BTF. Although no sorption is accounted for in BLA, 24 Pu is chosen as reference also for this tunnel. The sorption in bentonite is, however, lower for uranium and neptunium than plutonium why another reference nuclide must be chosen for the Silo. In order not to overestimate the sorption capacity 26 Sn is chosen. Sorption data for curium is equal to americium and hence 24 Am is suitable as reference nuclide both for curium and americium nuclides, but since the half-life of 24 Am is shorter than for some of these nuclides it is only used as reference for 242m Am, 243 Cm and 244 Cm. For the three remaining nuclides 243 Am, 243 Cm and 246 Cm the reference nuclide was chosen to be 93 Zr, even though the sorption is less in all barriers. The performed A:
110 radionuclide release calculations show a negligible contribution from the reference nuclides 26 Sn, 24 Am and 93 Zr on the total dose rate for all repository parts and biospheres. The reference nuclide 24 Pu contributes to the total dose rate for BLA when the recipient is a well, but not for any of the other repository parts or biospheres studied. The calculated relative dose, i.e. the dose calculated from dose conversion factors for ingestion (Table A- (EU, 996)) and the initial inventory (including the contribution from mother) for the nuclide in comparison to the reference nuclide, are shown in Table A-2. As can be seen in the table 234 U, 236 U, 238 U and 237 Np in the Silo exceed the dose from the reference nuclide. However, the choice of 26 Sn as reference nuclide implies that the sorption in the barriers is underestimated. The dose from 26 Sn from the Silo is small in comparison to the total dose and hence also the nuclides compared to 26 Sn have negligible influence on the total dose. For BLA the nuclides compared to 24 Pu show several orders of magnitude lower relative dose and hence even if 24 Pu contribute to the total dose in a well these nuclides will not. The relative dose for 243 Am and 245 Cm indicate a higher dose than the dose from the reference nuclide 93 Zr. Again, the reference nuclide sorbs less in all barriers and in the performed radionuclide release calculations for 93 Zr the dose only exceeds / in the cases with influence of chemicals and for BMA with degraded barriers. The influence of chemicals is however less for americium and curium than for zirconium. This implies that 243 Am may contribute to some extent to the total dose and therefore a radionuclide release calculation for BMA for the case with chemicals and degraded barriers was performed. No biosphere calculations were performed, but comparison to 239 Pu and 93 Zr shows that it may be possible that the dose from 243 Am is only one order of magnitude less than the total dose and hence would contribute marginally to the total dose. The dose conversion factors used in SR97 (Nordlinder et al, 999) for different ecosystems, coast, open coast, agricultural soil, peat and small peat was used to check that the uptake mechanisms in the biosphere for the reference nuclide and actual nuclide are similar. This comparison showed that the change in dose conversion factor compared to the reference nuclide is within a factor of thirty for all nuclides and ecosystems. The consequence of an increase of a factor 3 if one of the 2 nuclides is released to an ecosystem that implies higher relative dose than for the reference nuclide will not lead to a dose that contribute to the total dose, except maybe for 243 Am. This implies that the exclusion of these 2 nuclides does not influence the total dose, except for 243 Am that maybe would contribute marginally to the dose in some case for BMA. A:2
111 Table A-. Dose conversion factors (Sv/Bq) and distribution coefficients (m 3 /kg) Nuclide Half life (yr) Dose conversion factor, ingestion (Sv/Bq) Concrete/ Cement Distribution coefficients (m 3 /kg) Sand/ Bentonite gravel bentonite/ sand /9 Zr Sn Pu Am U U U U U Np Am-242m Am Cm Cm Cm Cm Table A-2. Calculated relative doses for all repository parts. Nuclide Reference nuclide Relative dose compared to "reference" nuclide Silo BMA BTF BTF2 BLA U-232 Tunnels: Pu Silo: Sn-26 U-234 Tunnels: Pu Silo: Sn-26 U-235 Tunnels: Pu Silo: Sn-26 U-236 Tunnels Pu Silo: Sn-26 U-238 Tunnels: Pu Silo: Sn-26 Np-237 Tunnels: Pu Silo: Sn-26 Am-242m Am Am-243 Zr Cm-243 Am Cm-244 Am Cm-245 Zr Cm-246 Zr A:3
112 References EU (996) Rådets direktiv 96/29/Euratom av den 3 maj, 996, Published in the European community's official journal, L 59, June 29, 996 (in Swedish). Nordlinder S., Bergström U. and Mathiasson L. (999) Ecosystem specific dose conversion factors for Aberg, Beberg and Ceberg, SKB Technical report TR-99-5, Swedish Nuclear and Fuel Waste Management Co, Stockholm, Sweden. Riggare P. and Johansson C. (2) Project SAFE Low and Intermediate Level Waste in SFR-, SKB report R--3, Swedish Nuclear and Fuel Waste Management Co, Stockholm, Sweden. SKB (2) Project SAFE Compilation of data for radionuclide transport analysis, SKB report R--4, Swedish Nuclear and Fuel Waste Management Co, Stockholm, Sweden. A:4
113 Appendix B: Discretization in near field models Schematic figures of the discretizations used for the near field models used for the different repository parts.

114 B:
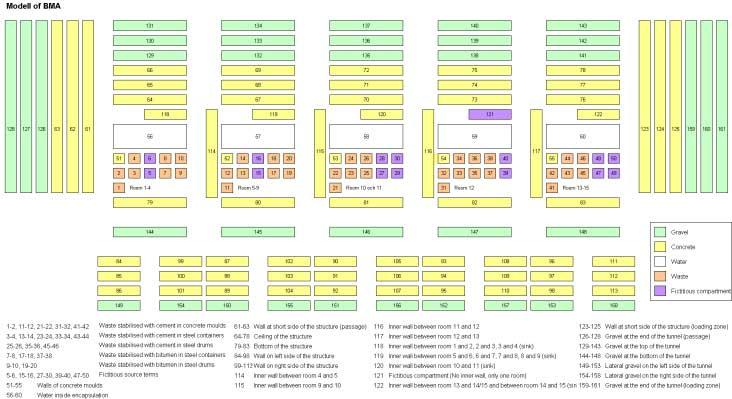
115 B:2
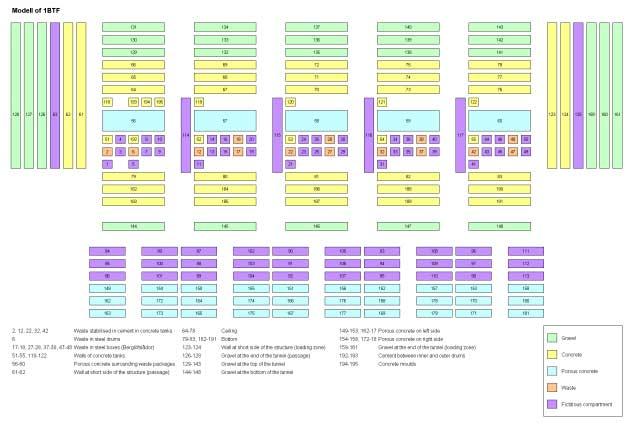
116 B:3
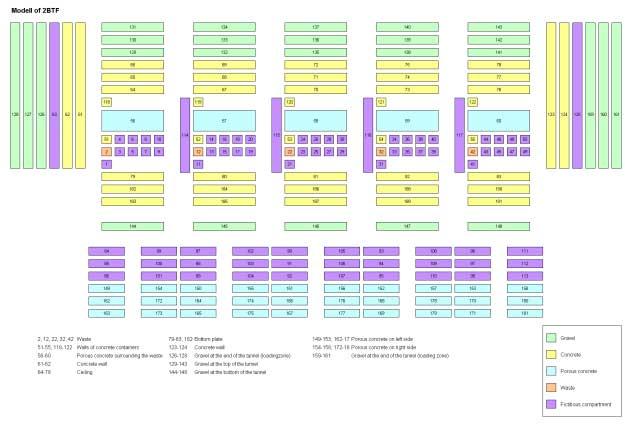
117 B:4
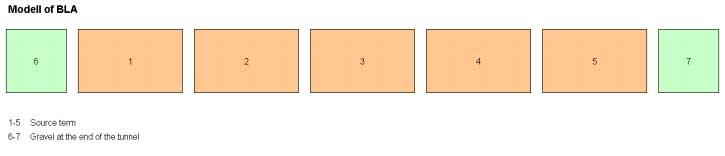
118 B:5
Klimatpåverkan och de stora osäkerheterna - I Pathways bör CO2-reduktion/mål hanteras inom ett osäkerhetsintervall
 Klimatpåverkan och de stora osäkerheterna - I Pathways bör CO2-reduktion/mål hanteras inom ett osäkerhetsintervall Vi måste förstå att: Vårt klimat är ett mycket komplext system Många (av människan påverkade)
Isolda Purchase - EDI
 Isolda Purchase - EDI Document v 1.0 1 Table of Contents Table of Contents... 2 1 Introduction... 3 1.1 What is EDI?... 4 1.2 Sending and receiving documents... 4 1.3 File format... 4 1.3.1 XML (language
Isometries of the plane
 Isometries of the plane Mikael Forsberg August 23, 2011 Abstract Här följer del av ett dokument om Tesselering som jag skrivit för en annan kurs. Denna del handlar om isometrier och innehåller bevis för
12.6 Heat equation, Wave equation
 12.6 Heat equation, 12.2-3 Wave equation Eugenia Malinnikova, NTNU September 26, 2017 1 Heat equation in higher dimensions The heat equation in higher dimensions (two or three) is u t ( = c 2 2 ) u x 2
Grass to biogas turns arable land to carbon sink LOVISA BJÖRNSSON
 Grass to biogas turns arable land to carbon sink LOVISA BJÖRNSSON Project funding and reporting, Thomas Prade & Mikael Lantz (2016) Grass for biogas - Arable land as carbon sink. Report 2016:280. Energiforsk,
Stiftelsen Allmänna Barnhuset KARLSTADS UNIVERSITET
 Stiftelsen Allmänna Barnhuset KARLSTADS UNIVERSITET National Swedish parental studies using the same methodology have been performed in 1980, 2000, 2006 and 2011 (current study). In 1980 and 2000 the studies
Viktig information för transmittrar med option /A1 Gold-Plated Diaphragm
 Viktig information för transmittrar med option /A1 Gold-Plated Diaphragm Guldplätering kan aldrig helt stoppa genomträngningen av vätgas, men den får processen att gå långsammare. En tjock guldplätering
A study of the performance
 A study of the performance and utilization of the Swedish railway network Anders Lindfeldt Royal Institute of Technology 2011-02-03 Introduction The load on the railway network increases steadily, and
Module 6: Integrals and applications
 Department of Mathematics SF65 Calculus Year 5/6 Module 6: Integrals and applications Sections 6. and 6.5 and Chapter 7 in Calculus by Adams and Essex. Three lectures, two tutorials and one seminar. Important
Information technology Open Document Format for Office Applications (OpenDocument) v1.0 (ISO/IEC 26300:2006, IDT) SWEDISH STANDARDS INSTITUTE
 v1.0 (ISO/IEC 26300:2006, IDT) SWEDISH STANDARDS INSTITUTE") SVENSK STANDARD SS-ISO/IEC 26300:2008 Fastställd/Approved: 2008-06-17 Publicerad/Published: 2008-08-04 Utgåva/Edition: 1 Språk/Language: engelska/english ICS: 35.240.30 Information technology Open Document
SVENSK STANDARD SS-ISO/IEC 26300:2008 Fastställd/Approved: 2008-06-17 Publicerad/Published: 2008-08-04 Utgåva/Edition: 1 Språk/Language: engelska/english ICS: 35.240.30 Information technology Open Document
Collaborative Product Development:
 Collaborative Product Development: a Purchasing Strategy for Small Industrialized House-building Companies Opponent: Erik Sandberg, LiU Institutionen för ekonomisk och industriell utveckling Vad är egentligen
The Arctic boundary layer
 The Arctic boundary layer Interactions with the surface, and clouds, as learned from observations (and some modeling) Michael Tjernström Department of Meteorology & the Bert Bolin Center for Climate Research,
Adding active and blended learning to an introductory mechanics course
 Adding active and blended learning to an introductory mechanics course Ulf Gran Chalmers, Physics Background Mechanics 1 for Engineering Physics and Engineering Mathematics (SP2/3, 7.5 hp) 200+ students
Rastercell. Digital Rastrering. AM & FM Raster. Rastercell. AM & FM Raster. Sasan Gooran (VT 2007) Rastrering. Rastercell. Konventionellt, AM
 Rastrering. Rastercell. Konventionellt, AM") Rastercell Digital Rastrering Hybridraster, Rastervinkel, Rotation av digitala bilder, AM/FM rastrering Sasan Gooran (VT 2007) Önskat mått * 2* rastertätheten = inläsningsupplösning originalets mått 2
Rastercell Digital Rastrering Hybridraster, Rastervinkel, Rotation av digitala bilder, AM/FM rastrering Sasan Gooran (VT 2007) Önskat mått * 2* rastertätheten = inläsningsupplösning originalets mått 2
Sanering av Oskarshamns hamn. Oskarshamn harbour - The environmental problem. As Cd Cu Pb Zn. dioxins Hifab AB 1
 Oskarshamn harbour - The environmental problem As Cd Cu Pb Zn.and dioxins 2011-06-17 Hifab AB 1 Concentration of dioxins in sediments (ng TEQ/kg TS)
Schenker Privpak AB Telefon VAT Nr. SE Schenker ABs ansvarsbestämmelser, identiska med Box 905 Faxnr Säte: Borås
 Schenker Privpak AB Interface documentation for web service packageservices.asmx 2012-09-01 Version: 1.0.0 Doc. no.: I04304b Sida 2 av 7 Revision history Datum Version Sign. Kommentar 2012-09-01 1.0.0
The Municipality of Ystad
 The Municipality of Ystad Coastal management in a local perspective TLC The Living Coast - Project seminar 26-28 nov Mona Ohlsson Project manager Climate and Environment The Municipality of Ystad Area:
The Finite Element Method, FHL064
 The Finite Element Method, FHL064 Division of Solid Mechanics Course program, vt2, 20 Course description The finite element method (FEM) is a numerical method able to solve differential equations, i.e.
Beijer Electronics AB 2000, MA00336A, 2000-12
 Demonstration driver English Svenska Beijer Electronics AB 2000, MA00336A, 2000-12 Beijer Electronics AB reserves the right to change information in this manual without prior notice. All examples in this
Webbregistrering pa kurs och termin
 Webbregistrering pa kurs och termin 1. Du loggar in på www.kth.se via den personliga menyn Under fliken Kurser och under fliken Program finns på höger sida en länk till Studieöversiktssidan. På den sidan
Kundfokus Kunden och kundens behov är centrala i alla våra projekt
 D-Miljö AB bidrar till en renare miljö genom projekt där vi hjälper våra kunder att undersöka och sanera förorenad mark och förorenat grundvatten. Vi bistår dig som kund från projektets start till dess
Hållbar utveckling i kurser lå 16-17
 Hållbar utveckling i kurser lå 16-17 : Jag tillhör akademin / My position is in the School of Jag tillhör akademin / My position is in the School of Humaniora och medier / Humanities and Media Studies
FÖRBERED UNDERLAG FÖR BEDÖMNING SÅ HÄR
 FÖRBERED UNDERLAG FÖR BEDÖMNING SÅ HÄR Kontrollera vilka kurser du vill söka under utbytet. Fyll i Basis for nomination for exchange studies i samråd med din lärare. För att läraren ska kunna göra en korrekt
SWESIAQ Swedish Chapter of International Society of Indoor Air Quality and Climate
 Swedish Chapter of International Society of Indoor Air Quality and Climate Aneta Wierzbicka Swedish Chapter of International Society of Indoor Air Quality and Climate Independent and non-profit Swedish
Materialplanering och styrning på grundnivå. 7,5 högskolepoäng
 Materialplanering och styrning på grundnivå Provmoment: Ladokkod: Tentamen ges för: Skriftlig tentamen TI6612 Af3-Ma, Al3, Log3,IBE3 7,5 högskolepoäng Namn: (Ifylles av student) Personnummer: (Ifylles
Schenker Privpak AB Telefon 033-178300 VAT Nr. SE556124398001 Schenker ABs ansvarsbestämmelser, identiska med Box 905 Faxnr 033-257475 Säte: Borås
 Schenker Privpak AB Interface documentation for web service packageservices.asmx 2010-10-21 Version: 1.2.2 Doc. no.: I04304 Sida 2 av 14 Revision history Datum Version Sign. Kommentar 2010-02-18 1.0.0
Kursplan. EN1088 Engelsk språkdidaktik. 7,5 högskolepoäng, Grundnivå 1. English Language Learning and Teaching
 Kursplan EN1088 Engelsk språkdidaktik 7,5 högskolepoäng, Grundnivå 1 English Language Learning and Teaching 7.5 Higher Education Credits *), First Cycle Level 1 Mål Efter genomgången kurs ska studenten
SVENSK STANDARD SS-EN ISO 19108:2005/AC:2015
 SVENSK STANDARD SS-EN ISO 19108:2005/AC:2015 Fastställd/Approved: 2015-07-23 Publicerad/Published: 2016-05-24 Utgåva/Edition: 1 Språk/Language: engelska/english ICS: 35.240.70 Geografisk information Modell
Resultat av den utökade första planeringsövningen inför RRC september 2005
 Resultat av den utökade första planeringsövningen inför RRC-06 23 september 2005 Resultat av utökad första planeringsövning - Tillägg av ytterligare administrativa deklarationer - Variant (av case 4) med
Support Manual HoistLocatel Electronic Locks
 Support Manual HoistLocatel Electronic Locks 1. S70, Create a Terminating Card for Cards Terminating Card 2. Select the card you want to block, look among Card No. Then click on the single arrow pointing
Eternal Employment Financial Feasibility Study
 Eternal Employment Financial Feasibility Study 2017-08-14 Assumptions Available amount: 6 MSEK Time until first payment: 7 years Current wage: 21 600 SEK/month (corresponding to labour costs of 350 500
Installation Instructions
 Installation Instructions (Cat. No. 1794-IE8 Series B) This module mounts on a 1794 terminal base unit. 1. Rotate keyswitch (1) on terminal base unit (2) clockwise to position 3 as required for this type
Signatursida följer/signature page follows
 Styrelsens i Flexenclosure AB (publ) redogörelse enligt 13 kap. 6 och 14 kap. 8 aktiebolagslagen över förslaget till beslut om ökning av aktiekapitalet genom emission av aktier och emission av teckningsoptioner
Grafisk teknik IMCDP IMCDP IMCDP. IMCDP(filter) Sasan Gooran (HT 2006) Assumptions:
 Sasan Gooran (HT 2006) Assumptions:") IMCDP Grafisk teknik The impact of the placed dot is fed back to the original image by a filter Original Image Binary Image Sasan Gooran (HT 2006) The next dot is placed where the modified image has its
IMCDP Grafisk teknik The impact of the placed dot is fed back to the original image by a filter Original Image Binary Image Sasan Gooran (HT 2006) The next dot is placed where the modified image has its
COPENHAGEN Environmentally Committed Accountants
 THERE ARE SO MANY REASONS FOR WORKING WITH THE ENVIRONMENT! It s obviously important that all industries do what they can to contribute to environmental efforts. The MER project provides us with a unique
Dokumentnamn Order and safety regulations for Hässleholms Kretsloppscenter. Godkänd/ansvarig Gunilla Holmberg. Kretsloppscenter
 1(5) The speed through the entire area is 30 km/h, unless otherwise indicated. Beware of crossing vehicles! Traffic signs, guardrails and exclusions shall be observed and followed. Smoking is prohibited
Styrteknik: Binära tal, talsystem och koder D3:1
 Styrteknik: Binära tal, talsystem och koder D3:1 Digitala kursmoment D1 Boolesk algebra D2 Grundläggande logiska funktioner D3 Binära tal, talsystem och koder Styrteknik :Binära tal, talsystem och koder
Ansökan om tillstånd enligt kärntekniklagen
 Ansökan om tillstånd enligt kärntekniklagen Toppdokument Ansökan om tillstånd enligt Kärntekniklagen för utbyggnad och fortsatt drift av SFR Bilaga Begrepp och definitioner Begrepp och definitioner för
Regional Carbon Budgets
 Regional Carbon Budgets Rapid Pathways to Decarbonized Futures X-CAC Workshop 13 April 2018 web: www.cemus.uu.se Foto: Tina Rohdin Kevin Anderson Isak Stoddard Jesse Schrage Zennström Professor in Climate
CUSTOMER READERSHIP HARRODS MAGAZINE CUSTOMER OVERVIEW. 63% of Harrods Magazine readers are mostly interested in reading about beauty
 79% of the division trade is generated by Harrods Rewards customers 30% of our Beauty clients are millennials 42% of our trade comes from tax-free customers 73% of the department base is female Source:
TN LR TT mg/l N b) 2,6-Dimethylphenole
 2,6-Dimethylphenole") TN LR TT 0.5-14 mg/l N b) 2,6-Dimethylphenole 283 Instrument specific information The test can be performed on the following devices. In addition, the required cuvette and the absorption range of the photometer
TN LR TT 0.5-14 mg/l N b) 2,6-Dimethylphenole 283 Instrument specific information The test can be performed on the following devices. In addition, the required cuvette and the absorption range of the photometer
Gradientbaserad Optimering,
 Gradientbaserad Optimering, Produktfamiljer och Trinitas Hur att sätta upp ett optimeringsproblem? Vad är lämpliga designvariabler x? Tjockleksvariabler (sizing) Tvärsnittsarean hos stänger Längdmått hos
Övning 5 ETS052 Datorkommuniktion Routing och Networking
 Övning 5 TS5 Datorkommuniktion - 4 Routing och Networking October 7, 4 Uppgift. Rita hur ett paket som skickas ut i nätet nedan från nod, med flooding, sprider sig genom nätet om hop count = 3. Solution.
RADIATION TEST REPORT. GAMMA: 30.45k, 59.05k, 118.8k/TM1019 Condition D
 RADIATION TEST REPORT PRODUCT: OP47AYQMLL Die Type: 147X FILE: OP47_LDR.xlsx DATE CODE: 95 GAMMA: 3.45k, 59.5k, 118.8k/TM119 Condition D GAMMA SOURCE: Co6 DOSE RATE: 8.6mRad(si)/s FACILITIES: University
Support for Artist Residencies
 1. Basic information 1.1. Name of the Artist-in-Residence centre 0/100 1.2. Name of the Residency Programme (if any) 0/100 1.3. Give a short description in English of the activities that the support is
Radionuclide transport and dose calculations for the safety assessment SR-PSU
 ISSN 1404-0344 Tänd ett lager: SKB TR-14-09 P, R eller TR. ID 1442446 Revised edition Radionuclide transport and dose calculations for the safety assessment SR-PSU Svensk Kärnbränslehantering AB October
1. Compute the following matrix: (2 p) 2. Compute the determinant of the following matrix: (2 p)
 2. Compute the determinant of the following matrix: (2 p)") UMEÅ UNIVERSITY Department of Mathematics and Mathematical Statistics Pre-exam in mathematics Linear algebra 2012-02-07 1. Compute the following matrix: (2 p 3 1 2 3 2 2 7 ( 4 3 5 2 2. Compute the determinant
UMEÅ UNIVERSITY Department of Mathematics and Mathematical Statistics Pre-exam in mathematics Linear algebra 2012-02-07 1. Compute the following matrix: (2 p 3 1 2 3 2 2 7 ( 4 3 5 2 2. Compute the determinant
Swedish adaptation of ISO TC 211 Quality principles. Erik Stenborg
 Swedish adaptation of ISO TC 211 Quality principles The subject How to use international standards Linguistic differences Cultural differences Historical differences Conditions ISO 19100 series will become
CHANGE WITH THE BRAIN IN MIND. Frukostseminarium 11 oktober 2018
 CHANGE WITH THE BRAIN IN MIND Frukostseminarium 11 oktober 2018 EGNA FÖRÄNDRINGAR ü Fundera på ett par förändringar du drivit eller varit del av ü De som gått bra och det som gått dåligt. Vi pratar om
SAMMANFATTNING AV SUMMARY OF
 Detta dokument är en enkel sammanfattning i syfte att ge en första orientering av investeringsvillkoren. Fullständiga villkor erhålles genom att registera sin e- postadress på ansökningssidan för FastForward
EASA Standardiseringsrapport 2014
 EASA Standardiseringsrapport 2014 Inför EASA Standardiseringsinspektion hösten 2016 Presentatör Johan Brunnberg, Flygteknisk Inspektör & Del-M Koordinator Sjö- och luftfartsavdelningen Enheten för operatörer,
Module 1: Functions, Limits, Continuity
 Department of mathematics SF1625 Calculus 1 Year 2015/2016 Module 1: Functions, Limits, Continuity This module includes Chapter P and 1 from Calculus by Adams and Essex and is taught in three lectures,
Tentamen i Matematik 2: M0030M.
 Tentamen i Matematik 2: M0030M. Datum: 203-0-5 Skrivtid: 09:00 4:00 Antal uppgifter: 2 ( 30 poäng ). Examinator: Norbert Euler Tel: 0920-492878 Tillåtna hjälpmedel: Inga Betygsgränser: 4p 9p = 3; 20p 24p
The test can be performed on the following devices. In addition, the required cuvette and the absorption range of the photometer are indicated.
 TN HR TT b) i) 5-140 mg/l N 2,6-Dimethylphenole 284 Instrument specific information The test can be performed on the following devices. In addition, the required cuvette and the absorption range of the
Webbreg öppen: 26/ /
 Webbregistrering pa kurs, period 2 HT 2015. Webbreg öppen: 26/10 2015 5/11 2015 1. Du loggar in på www.kth.se via den personliga menyn Under fliken Kurser och under fliken Program finns på höger sida en
Grafisk teknik IMCDP. Sasan Gooran (HT 2006) Assumptions:
 Assumptions:") Grafisk teknik Sasan Gooran (HT 2006) Iterative Method Controlling Dot Placement (IMCDP) Assumptions: The original continuous-tone image is scaled between 0 and 1 0 and 1 represent white and black respectively
Grafisk teknik Sasan Gooran (HT 2006) Iterative Method Controlling Dot Placement (IMCDP) Assumptions: The original continuous-tone image is scaled between 0 and 1 0 and 1 represent white and black respectively
Utfärdad av Compiled by Tjst Dept. Telefon Telephone Datum Date Utg nr Edition No. Dokumentnummer Document No.
 Utfärdad av Compiled by Tjst Dept. Telefon Telephone David Andersson BUM 733 684 Stämpel/Etikett Security stamp/label ÅTDRAGNINGSMOMENT TIGHTENING TORQUE Granskad av Reviewed by Göran Magnusson Tjst Dept.
Pharmacovigilance lagstiftning - PSUR
 Pharmacovigilance lagstiftning - PSUR Karl Mikael Kälkner Tf enhetschef ES1 EUROPAPARLAMENTETS OCH RÅDETS DIREKTIV 2010/84/EU av den 15 december om ändring, när det gäller säkerhetsövervakning av läkemedel,
Accomodations at Anfasteröd Gårdsvik, Ljungskile
 Accomodations at Anfasteröd Gårdsvik, Ljungskile Anfasteröd Gårdsvik is a campsite and resort, located right by the sea and at the edge of the forest, south west of Ljungskile. We offer many sorts of accommodations
SWETHRO. Gunilla Pihl Karlsson, Per Erik Karlsson, Sofie Hellsten & Cecilia Akselsson* IVL Svenska Miljöinstitutet *Lunds Universitet
 SWETHRO The Swedish Throughfall Monitoring Network (SWETHRO) - 25 years of monitoring air pollutant concentrations, deposition and soil water chemistry Gunilla Pihl Karlsson, Per Erik Karlsson, Sofie Hellsten
This exam consists of four problems. The maximum sum of points is 20. The marks 3, 4 and 5 require a minimum
 Examiner Linus Carlsson 016-01-07 3 hours In English Exam (TEN) Probability theory and statistical inference MAA137 Aids: Collection of Formulas, Concepts and Tables Pocket calculator This exam consists
Sammanfattning hydraulik
 Sammanfattning hydraulik Bernoullis ekvation Rörelsemängdsekvationen Energiekvation applikationer Rörströmning Friktionskoefficient, Moody s diagram Pumpsystem BERNOULLI S EQUATION 2 p V z H const. Quantity
PRESTANDADEKLARATION. Nr 0015 SV
 PRESTANDADEKLARATION Nr 0015 SV 1. Produkttypens unika identifikationskod: fischer Anchor bolt FBN II, FBN II A4 2. Avsedd användning/avsedda användningar: Produkt Avsedd användning/användningar Kraftkontrollerat
F ξ (x) = f(y, x)dydx = 1. We say that a random variable ξ has a distribution F (x), if. F (x) =
 = f(y, x)dydx = 1. We say that a random variable ξ has a distribution F (x), if. F (x) =") Problems for the Basic Course in Probability (Fall 00) Discrete Probability. Die A has 4 red and white faces, whereas die B has red and 4 white faces. A fair coin is flipped once. If it lands on heads,
Problems for the Basic Course in Probability (Fall 00) Discrete Probability. Die A has 4 red and white faces, whereas die B has red and 4 white faces. A fair coin is flipped once. If it lands on heads,
Profilinformation Flygteknink 2019, Ingo Staack
 Profilinformation 2019 Flygteknik Roland Gårdhagen Ingo Staack Aeronautical Engineering Masterprofil Flygteknik Profilinformation Flygteknink 2019, Ingo Staack 1 2019-03-14 3 Från koncept till prototyp
Senaste trenderna från testforskningen: Passar de industrin? Robert Feldt,
 Senaste trenderna från testforskningen: Passar de industrin? Robert Feldt, robert.feldt@bth.se Vad är på gång i forskningen? (ICST 2015 & 2016) Security testing Mutation testing GUI testing Model-based
Grafisk teknik. Sasan Gooran (HT 2006)
") Grafisk teknik Sasan Gooran (HT 2006) Iterative Method Controlling Dot Placement (IMCDP) Assumptions: The original continuous-tone image is scaled between 0 and 1 0 and 1 represent white and black respectively
Grafisk teknik Sasan Gooran (HT 2006) Iterative Method Controlling Dot Placement (IMCDP) Assumptions: The original continuous-tone image is scaled between 0 and 1 0 and 1 represent white and black respectively
Kurskod: TAMS28 MATEMATISK STATISTIK Provkod: TEN1 05 June 2017, 14:00-18:00. English Version
 Kurskod: TAMS28 MATEMATISK STATISTIK Provkod: TEN1 5 June 217, 14:-18: Examiner: Zhenxia Liu (Tel: 7 89528). Please answer in ENGLISH if you can. a. You are allowed to use a calculator, the formula and
Hur fattar samhället beslut när forskarna är oeniga?
 Hur fattar samhället beslut när forskarna är oeniga? Martin Peterson m.peterson@tue.nl www.martinpeterson.org Oenighet om vad? 1.Hårda vetenskapliga fakta? ( X observerades vid tid t ) 1.Den vetenskapliga
6 th Grade English October 6-10, 2014
 6 th Grade English October 6-10, 2014 Understand the content and structure of a short story. Imagine an important event or challenge in the future. Plan, draft, revise and edit a short story. Writing Focus
Writing with context. Att skriva med sammanhang
 Writing with context Att skriva med sammanhang What makes a piece of writing easy and interesting to read? Discuss in pairs and write down one word (in English or Swedish) to express your opinion http://korta.nu/sust(answer
Syns du, finns du? Examensarbete 15 hp kandidatnivå Medie- och kommunikationsvetenskap
 Examensarbete 15 hp kandidatnivå Medie- och kommunikationsvetenskap Syns du, finns du? - En studie över användningen av SEO, PPC och sociala medier som strategiska kommunikationsverktyg i svenska företag
PORTSECURITY IN SÖLVESBORG
 PORTSECURITY IN SÖLVESBORG Kontaktlista i skyddsfrågor / List of contacts in security matters Skyddschef/PFSO Tord Berg Phone: +46 456 422 44. Mobile: +46 705 82 32 11 Fax: +46 456 104 37. E-mail: tord.berg@sbgport.com
Uttagning för D21E och H21E
 Uttagning för D21E och H21E Anmälan till seniorelitklasserna vid O-Ringen i Kolmården 2019 är öppen fram till och med fredag 19 juli klockan 12.00. 80 deltagare per klass tas ut. En rangordningslista med
Boiler with heatpump / Värmepumpsberedare
 Boiler with heatpump / Värmepumpsberedare QUICK START GUIDE / SNABBSTART GUIDE More information and instruction videos on our homepage www.indol.se Mer information och instruktionsvideos på vår hemsida
School of Management and Economics Reg. No. EHV 2008/220/514 COURSE SYLLABUS. Fundamentals of Business Administration: Management Accounting
 School of Management and Economics Reg. No. EHV 2008/220/514 COURSE SYLLABUS Fundamentals of Business Administration: Management Accounting Course Code FE3001 Date of decision 2008-06-16 Decision-making
Preschool Kindergarten
 Preschool Kindergarten Objectives CCSS Reading: Foundational Skills RF.K.1.D: Recognize and name all upper- and lowercase letters of the alphabet. RF.K.3.A: Demonstrate basic knowledge of one-toone letter-sound
2.1 Installation of driver using Internet Installation of driver from disk... 3
 &RQWHQW,QQHKnOO 0DQXDOÃ(QJOLVKÃ'HPRGULYHU )RUHZRUG Ã,QWURGXFWLRQ Ã,QVWDOOÃDQGÃXSGDWHÃGULYHU 2.1 Installation of driver using Internet... 3 2.2 Installation of driver from disk... 3 Ã&RQQHFWLQJÃWKHÃWHUPLQDOÃWRÃWKHÃ3/&ÃV\VWHP
Aborter i Sverige 2008 januari juni
 HÄLSA OCH SJUKDOMAR 2008:9 Aborter i Sverige 2008 januari juni Preliminär sammanställning SVERIGES OFFICIELLA STATISTIK Statistik Hälsa och Sjukdomar Aborter i Sverige 2008 januari juni Preliminär sammanställning
Bridging the gap - state-of-the-art testing research, Explanea, and why you should care
 Bridging the gap - state-of-the-art testing research, Explanea, and why you should care Robert Feldt Blekinge Institute of Technology & Chalmers All animations have been excluded in this pdf version! onsdag
Analys av säkerhet efter förslutning. Fredrik Vahlund
 Analys av säkerhet efter förslutning Fredrik Vahlund 50 Presentationens upplägg Analys av långsiktig säkerhet Syfte Bakgrund Förutsättningar Metodik Resultat Total risk Kravuppfyllelse mot SSM:s riskkriterium
SVENSK STANDARD SS :2010
 SVENSK STANDARD SS 8760009:2010 Fastställd/Approved: 2010-03-22 Publicerad/Published: 2010-04-27 Utgåva/Edition: 2 Språk/Language: svenska/swedish ICS: 11.140 Sjukvårdstextil Sortering av undertrikå vid
Windlass Control Panel v1.0.1
 SIDE-POWER Windlass Systems 86-08950 Windlass Control Panel v1.0.1 EN Installation manual Behåll denna manual ombord! S Installations manual SLEIPNER AB Kilegatan 1 452 33 Strömstad Sverige Tel: +46 525
Är passivhus lämpliga i fjärrvärmeområden?
 Är passivhus lämpliga i fjärrvärmeområden? Leif Gustavsson Energiting Sydost 2011 5 maj 2011 Linnéuniversitetet, Växjö Världens primärenergianvändning 2007 ( 500 Exajoul) Olja 34% Kol 26% Gas 21% Totalt
Kursutvärderare: IT-kansliet/Christina Waller. General opinions: 1. What is your general feeling about the course? Antal svar: 17 Medelvärde: 2.
 Kursvärdering - sammanställning Kurs: 2AD510 Objektorienterad programmering, 5p Antal reg: 75 Program: 2AD512 Objektorienterad programmering DV1, 4p Antal svar: 17 Period: Period 2 H04 Svarsfrekvens: 22%
Understanding Innovation as an Approach to Increasing Customer Value in the Context of the Public Sector
 Thesis for the degree of Licentiate of Philosophy, Östersund 2014 Understanding Innovation as an Approach to Increasing Customer Value in the Context of the Public Sector Klas Palm Supervisors: Håkan Wiklund
Arbetstillfällen 100 000.
 2 3 4 Arbetstillfällen 100 000. 5 6 7 Vissa anspråk ställs I de internationella direktiv och konventioner Sverige antingen är ålagt att följa eller frivilligt valt att följa. Här har jag listat några exempel
EBBA2 European Breeding Bird Atlas
 Methodology Sergi Herrando, Verena Keller, Petr Voříšek et al. objectives 1. To document breeding evidence for all bird species at a resolution of 50x50 km 2. To estimate abundance for all bird species
FORSKNINGSKOMMUNIKATION OCH PUBLICERINGS- MÖNSTER INOM UTBILDNINGSVETENSKAP
 FORSKNINGSKOMMUNIKATION OCH PUBLICERINGS- MÖNSTER INOM UTBILDNINGSVETENSKAP En studie av svensk utbildningsvetenskaplig forskning vid tre lärosäten VETENSKAPSRÅDETS RAPPORTSERIE 10:2010 Forskningskommunikation
Methods to increase work-related activities within the curricula. S Nyberg and Pr U Edlund KTH SoTL 2017
 Methods to increase work-related activities within the curricula S Nyberg and Pr U Edlund KTH SoTL 2017 Aim of the project Increase Work-related Learning Inspire theachers Motivate students Understanding
Measuring child participation in immunization registries: two national surveys, 2001
 Measuring child participation in immunization registries: two national surveys, 2001 Diana Bartlett Immunization Registry Support Branch National Immunization Program Objectives Describe the progress of
Biblioteket.se. A library project, not a web project. Daniel Andersson. Biblioteket.se. New Communication Channels in Libraries Budapest Nov 19, 2007
 A library project, not a web project New Communication Channels in Libraries Budapest Nov 19, 2007 Daniel Andersson, daniel@biblioteket.se 1 Daniel Andersson Project manager and CDO at, Stockholm Public
Questionnaire for visa applicants Appendix A
 Questionnaire for visa applicants Appendix A Business Conference visit 1 Personal particulars Surname Date of birth (yr, mth, day) Given names (in full) 2 Your stay in Sweden A. Who took the initiative
Manhour analys EASA STI #17214
 Manhour analys EASA STI #17214 Presentatör Johan Brunnberg, Flygteknisk Inspektör & Del-M Koordinator Sjö- och luftfartsavdelningen Operatörsenheten Sektionen för teknisk operation 1 Innehåll Anmärkningen
Surfaces for sports areas Determination of vertical deformation. Golvmaterial Sportbeläggningar Bestämning av vertikal deformation
 SVENSK STANDARD SS-EN 14809:2005/AC:2007 Fastställd/Approved: 2007-11-05 Publicerad/Published: 2007-12-03 Utgåva/Edition: 1 Språk/Language: engelska/english ICS: 97.220.10 Golvmaterial Sportbeläggningar
Examensarbete Introduk)on - Slutsatser Anne Håkansson annehak@kth.se Studierektor Examensarbeten ICT-skolan, KTH
on - Slutsatser Anne Håkansson annehak@kth.se Studierektor Examensarbeten ICT-skolan, KTH") Examensarbete Introduk)on - Slutsatser Anne Håkansson annehak@kth.se Studierektor Examensarbeten ICT-skolan, KTH 2016 Anne Håkansson All rights reserved. Svårt Harmonisera -> Introduktion, delar: Fråga/
Examensarbete Introduk)on - Slutsatser Anne Håkansson annehak@kth.se Studierektor Examensarbeten ICT-skolan, KTH 2016 Anne Håkansson All rights reserved. Svårt Harmonisera -> Introduktion, delar: Fråga/
Beslut om bolaget skall gå i likvidation eller driva verksamheten vidare.
 ÅRSSTÄMMA REINHOLD POLSKA AB 7 MARS 2014 STYRELSENS FÖRSLAG TILL BESLUT I 17 Beslut om bolaget skall gå i likvidation eller driva verksamheten vidare. Styrelsen i bolaget har upprättat en kontrollbalansräkning
Consumer attitudes regarding durability and labelling
 Consumer attitudes regarding durability and labelling 27 april 2017 Gardemoen Louise Ungerth Konsumentföreningen Stockholm/ The Stockholm Consumer Cooperative Society louise.u@konsumentforeningenstockholm.se
Custom-made software solutions for increased transport quality and creation of cargo specific lashing protocols.
 Custom-made software solutions for increased transport quality and creation of cargo specific lashing protocols. ExcelLoad simulates the maximum forces that may appear during a transport no matter if the
Datasäkerhet och integritet
 Chapter 4 module A Networking Concepts OSI-modellen TCP/IP This module is a refresher on networking concepts, which are important in information security A Simple Home Network 2 Unshielded Twisted Pair