Intelligent, socially oriented technology III:
|
|
|
- Ulla Ulrika Hedlund
- för 6 år sedan
- Visningar:
Transkript
1 Intelligent, socially oriented technology III: Projects by teams of master level students in cognitive science and engineering Editors Christian Balkenius Agneta Gulz Magnus Haake Mattias Wallergård
2 Balkenius, C., Gulz, A., Haake, M. and Wallergård, M. (Eds.) Intelligent, socially oriented technology III: Projects by teams of master level students in cognitive science and engineering. Lund University Cognitive Studies, 168. ISSN ISRN LUHFDA/HFKO SE Copyright 2017 The Authors
3 Table of Contents Designing and Implementing an Associative Learning Model for a Teachable Agent... 5 Johan Bäckström, Kristian Månsson, Maria Persson, Elin Sakurai & Fredrik Karåker Sundström Pedagogical Agents and Source Criticism in the Educational Software Watchers of History Agata Janiszewska, Natali Ljunggren, Silje Mari Lundal, Oskar Holmberg & Joel Pålsson En studie av framtidens virtuella klassrum Alexander Cobleigh, Clara Mauritzson & Maja Rudling Semantisk Chunking I En Virtuell Värld Alexander Nicodemus Tagesson, Gustav Ryrlén, Minh Vuong Pham & Therese Kustvall Larsson Smart Interaction in the Internet of Things Eva-Maria Ternblad, Lisa Silfversten, Niclas Lövdahl & Nabiel Elshiewy Tre-Stegsmodellen Amanda Eliasson, Erica Jostrup, Jacob Hegelund & Alexander Christerson Westerberg Nudging You in the Right Direction A Peripheral Interaction Project August Alfredsson, Bo Elovson Grey, Adrian Hansson & Ludvig Åkesson Augmented Reality as a User Interface for the Internet of Things Henrik Edlund, Sandra Olsson, Maximilian Roszko & Johan Sverdberg Designing Mental States in a Humanoid Robot Hannes Sandberg, Marcus Liljenberg, Max Eriksson & Markus Lindberg Implementing Natural Gazing Behaviour in a Social Robot Simon Holk, Sara Lindgren, Rasmus Olofzon & Julia Rosén Are You Looking at Me? Erik Andersson, Hanna Andréason, Björn Holmstedt, Filip Olsson & Filip Ström
4
5 Designing and Implementing an Associative Learning Model for a Teachable Agent Johan Bäckström, Kristian Månsson, Maria Persson, Elin Sakurai & Fredrik Karåker Sundström This paper contains a report of the project performed during the courses MAMN10 and MAMN15 at Lund University. The purpose of the project was to implement changes in the Teachable Agent (TA) software, Guardians of History, in order to make the users, i.e. the students, find the game s test setting more engaging. It was concluded that in order to fulfil this task, a redesign of the learning model for the TA was required. The redesigned model consists of a list of so-called knowledge fragments which are simple associations between concepts, with a weight. The list is updated every time the student plays through a learning activity. This redesign allowed for two test setting implementations. Firstly, a redesign of the game s initial test setting. The new design required the student to pay more attention to what the TA was answering, as well as, having the student help the TA when it became uncertain. Secondly, a new test setting unrelated to the initial one. It was designed with game show as its conceptual model. Therefore, the student s TA is competing against other characters in a new environment with a dragon posing as the host. This added a competing property of the game, which the game lacked before the implementation, despite the game being a TA software. The paper explains the design choices made, as well as, presents the end result. In addition, the paper contains a theoretical background and a discussion analysing the end result in sense of covering the requirements of the project as well as in the field of opportunities for further development and research. 1 Introduction The report describes a project carried out for the research Educational Technology Group (ETG), consisting of cognitive and computer scientists from Lund and Linköping Universities. ETG does research on educational technology based on di erent cognitive and learning theories, largely through the development of educational software and research on the developed material. The project took place as a part of the two-part course (MAMN10 and MAMN15) in Cognitive Science and Computer Science at Lund University. This paper aims to report on the work done for both courses. The report may give a staggered impression due to including both courses. Therefore, it includes some pointers to which element was part of the first course or the second. The authors of this report (sometimes referred to as we or the project group) consists of one graduate student in Cognitive Science and four graduate students in Information and Communication Technology. The project presented and discussed in this paper is a part of an ongoing research project named Guardians of History (GoH), which is an attempt to implement the Teachable Agent (TA) paradigm for 5th grade history in Sweden. From the perspective of the student, also known as the player or the user, the game consists of carrying out a number of assignments given by the game character Professor Chronos. The student does this by embarking on time travels and gather information by engaging in dialogues with historical characters while exploring different historical environments. Afterwards the student must go through a number of activities to piece together these historical events. All this is done to teach the Time Elf, the TA, what it needs to learn in order take over from Chronos as the guardian of history. Much of the learning process consists of di erent types of feedback given to the student when she carries out activities and puts the TA to the test. The main goal of the project was to make the testing of the TA more engaging for the student. After an initial outline of the theoretical framework, details of GoH and its relation to di erent theoretical concepts is presented. The design and implementation section discusses the goals and tasks of the project, the design choices made and how these relates to theory and the current GoH implementation. The report is concluded with a general discussion where ideas for further research and development are discussed. 2 Theoretical Framework Learning by teaching as a concept has been around for a long time and it s e ects was noted as early as AD 65 by Seneca the Younger. He wrote in a letter to Lucilius homines dum docent discunt or humans learn while they teach (Seneca the younger, see Gummere et al., 2006, 7.9). It has also been discussed by influential thinkers such as Vygotsky and Bruner (see for instance Wood, Bruner & Ross, 1976). The concept of learning by teaching provides the student with learning strategies, strengthens cognitive abilities, such as memorising, organising and reflection, as well as reaching a deeper understanding of the topic. The concept of a teachable virtual agent is however new, and may provide the solution to the problem of utilising learning by teaching in a school setting (Kirkegaard, 2016). This section will begin with a presentation of and a discussion about one of the first implementations of this concept, called Betty s Brain (BB). It was developed by research groups at Vanderbilt and Stanford Universities. Much of the research surrounding teachable agents is done on BB and much of the literature referenced in this report are based on research using BB.
. The better the students perform in constructing these maps, the better Betty s results in answering quizzes becomes.")

6 Teachable Agents In the Teachable Agent implementation that is BB, the students are tasked with building the brain of Betty, the TA, by constructing conceptual maps of concepts in STEM-subjects (Science, Technology, Engineering and Mathematics). The better the students perform in constructing these maps, the better Betty s results in answering quizzes becomes. These concept maps are at the heart of BB (see figure 1). The student constructs these maps by drawing relations between key concepts of the domain. Blocks contains the concepts and lines represent relations between them in the visual representation. The map constitutes chains of inferences. At any time the student can ask Betty questions about these inferences. The student then follows the chain of inferences that Betty makes to reach the answer. Betty can also make spontaneous inferences to self-regulate her learning. Betty are put to the test by a sort of game show where she competes with other Betties. Other characters in the game includes a Mr. Davis, which creates questions dynamically to continually gauge the inference map created. By doing so, the student is guided towards improving the map, and by extension her own understanding of the topic. Applying these principles to BB, the first and fourth principle are met, as the student has a clear visual representation of the inference maps and is therefore able to follow these whenever Betty is making inferences to reach an answer. Furthermore, the learning environment does provide all the materials needed for accomplishing the learning tasks and thus fulfilling the third principle. Finally, the second principle is met by making Betty check her understanding by making inferences under certain conditions where the conclusions does not seem to make sense to her (Blair et al., 2006). Another example of an TALE is SimStudent with APLUS (SS). In SS the student is tasked with teaching a TA rules for solving algebraic equations. The TA in SS is built upon the principle of using productions to solve algebraic equations step-by-step. The TA tries to solve an equation and asks the student for help if it does not have a suitable production rule for the situation. The TA makes a guess and the student either approves the guess or provides a calculation for that step. The TA then infers a production rule for that situation (see figure 2) (Matsuda et al., 2013). Interestingly, SS does not meet the principle of an explicit and well-structured mind of the TA. The student must therefore somehow ascribe, perceive or infer the cognitive abilities of the TA in SS. Figure 1: Betty s Brain concept map. (Betty s Brain 2016) The four core principles of TAs according to Blair et. al. (2006) are that the TA is able to take independent action and reason freely, so that the student gets feedback about the thought processes that the TA goes through when answering a question. Secondly, the student is provided guidance to good learning behaviour. That is, that the TA constantly guides the student towards monitoring their own thinking, a skill that young students need to learn, and o er good learning strategies. The third principle is that the environment (i.e. the Teachable Agent Learning Environment or TALE) need to provide learning resources for the student to use to teach their TA, as well as, providing goals and challenges. It also provides additional guidance to achieve the learning goals. Lastly, the TALE needs to provide an explicit and wellstructured visual representation of the mind of the TA, to help the students to externalize and organize their own thinking processes. Figure 2: 2013). SimStudent with APLUS (Matsuda et al., The Protégée E ect and Metacognition How does this learning by teaching function? And how does it function particularly in a TALE? Chase et. al. (2009) coined the protégée e ect; the students in this kind of environment makes greater e ort towards to learn for their TA than they do for themselves. Their research has shown three factors that may contribute to this phenomena: i) an ego-protective bu er ii) adoption of incremental learning theory for their TA and iii) a sense of responsibility. The ego-protective bu er functions as a shield for the student s ego, as negative feedback and failed learning attempts can be blamed elsewhere. The students may 2
7 also blame failed learning attempts on their abilities as a teacher, which shields their own intellects; the failure is not due to their own intellects or some other internal property of the students. Moreover, the students have to adapt an incrementalist theory about intellectual capacity in order for their e orts towards teaching their TA to be meaningful, i.e. that learning is a process of gradual increment of knowledge and skill and that neither of those is a static property. This stands in contrast to the, in more or less extent held, belief that one s intellectual abilities or intelligence is a fixed property. It can be hard for students to grasp the mechanisms behind their own learning. If the TAs progress in learning is made obvious to the student, the learning mechanisms involved become disclosed and so the student learns about general learning processes which they then can apply on their own learning. An interesting find by Chase et al. (2009) was that the students made greater e ort towards performing well in their learning tasks with TA than without even before they received any type of feedback. This can be explained by the fact that a social bond is created between the student and the TA. The student expressed a certain kind of responsibility towards their TA, similar to that of a coach towards a player or indeed a teacher and a pupil. Other studies have shown that the TA helps children use and develop their metacognitive skills (Schwartz et al., 2009). The TA does this in two ways; firstly it helps to alleviate the cognitive load on the student. When reasoning about one s own thoughts while at the same time partaking in a learning activity, the cognitive strain can hinder both learning as well as the metacognitive reasoning, especially if the task at hand is di cult. The TA externalises the students cognition and makes it easier to monitor, also, the TA is responsible for the problem-solving which frees up the cognitive resources of the student. Secondly, there is a motivational mechanism. Metacognition can be strenuous and di cult which can and indeed does lead to avoidant behaviour in some circumstances. Good enough is often enough to get by. When the student takes the role as teacher this behaviour changes as the teacher has the responsibility for their respective student s performance. This increases the student s motivation for metacognitive reasoning. Metacognitive skills has been shown to be of great importance to learning and while some of these skills are developed organically through and with other cognitive abilities during child development, others can and needs to be trained. Especially the self-monitoring and selfregulation behaviours needed for successful learning behaviour (Schneider, 2008). So what does it take for the student to ascribe cognitive agency to the TA? Some research shows that 5thgraders have an understanding of the computer and the TA as not having any real cognitive properties, but that they do play pretend and that this behaviour is quite enough for the positive learning and metacognitive e ects to take place. The students clearly held the TAs responsible for their successes and failures and even showed affection for their TAs. This suspension of disbelief is thus one of the main motivating factors for learning with TAs (Schwartz et al., 2009). Even young children (3-6 year olds) that according to other psychological measurements only has achieved limited metacognititve skills, like theory of mind, has been shown to be able to engage in and reflect around the cognitive abilities and its learning in a TALE (Haake et al., 2015). Self-regulation is also an important aspect of metacognition and a TALE can aid when the student practice this particular skill. Self-regulation is the skill of monitoring one s own thought and making sure that the thought processes produces desired results. Research on BB (Schwartz et. al. 2009) shows that a self-regulating TA does indeed support learning. A conclusion is that it does so by stimulating self-regulative thinking. Thus, a productive feature of the TA could be to support self-regulative thinking processes. In BB, for example, this functionality is implemented through Betty s spontaneous reasoning and remarking that a conclusion does not make sense. Feedback and Competitive Elements Feedback is of central importance in any learning context. Therefore, applicable available research and theories for feedback should always be taken into consideration when analysing, implementing or designing a learning environment. Feedback can be analysed according to many di erent dimensions. Shute (2007) analyses feedback through four dimensions: complexity, timing, object of feedback, and learner skill and/or knowledge. According to Shute feedback should aim to be formative, i.e. it should be information communicated to the learner that is intended to modify the learner s thinking or behaviour for the purpose of improving learning. Moreover, the feedback should promote goal-oriented behaviour, avoid to interrupt any ongoing attempts by the user, not be presented before any learner attempts, never guide the learner all the way to the target. In addition, it should be given either immediately for novice learners and/or for di cult tasks. Also with increasing delay as the learner progresses in her learning as it promotes transfer. Lastly, ideal feedback is always given in a multi-modal fashion. According to Matsuda et al. (2013) there is no clear cut e ect of competitive elements, such as a game show setting, in a TALE. The extrinsic, the desire to win the game, and intrinsic, the commitment to teaching the TA, motivations of the student increases when exposed to a game show setting as an competitive element in a TALE. According to his research however, this did not in turn a ect the tutor learning, in neither positive nor negative direction. Competitive elements might hence not a ect the learning process directly, but may increase the motivation to partake in the learning activities. 3 Guardians of History The Guardians of History (GoH) is an ongoing attempt to implement a TALE for teaching history to Swedish 5th-graders. GoH is built as a web application with the meteor framework and is thus able to run on any platform with a web browser and a large enough screen. It 3


8 also supports both mouse pointer and touch screen interaction. GoH is part of an ongoing research programme on teachable agents at ETG. The TA and the Other Characters The TA in GoH is the Time Elf. The student s task is to teach the Elf about history by going on missions, each mission consist of time travels to important historical times and places where the user speaks to historical figures. Afterwards, the student test its knowledge and simultaneously teaches the TA through the di erent learning activities in the classroom. All the missions are provided by the character Professor Chronos. The professor also provides the main feedback through the learning process and the progress towards the learning goals. Additional guidance and information, during the game, is provided through text boxes. Chronos and the Time Elf can also provide information and guidance through a walkie-talkie that appears on the screen under certain circumstances. The other characters in the game are historical ones. The player interacts with these through pre-determined multiple choice text boxes. The historical characters provides the student with the majority of the learning material. Figure 3: An example of GoH s sorting activity. Learning Activities and Testing In GoH there are three types of learning activities: sorting, timeline and concept map. The sorting activity consists of sorting cards with proposition in correct bins (see figure 3). The timeline activity consists of pairing two concepts and placing the pair on a timeline (see figure 4). Lastly, the concept map tasks the student with connecting a concept with other concepts with a correct type of relation (see figure 5). All feedback is given by the correcting machine that displays the correct answers that the student gives. Several of the missions have sub-goals and the student are not able to proceed to the next one until a su cient number of correct answers in the activity is obtained. A mission consists of a series of time-travels and learning activities to be performed in specific order, the order depends on the mission. The missions are usually concluded by testing of the TA by professor Chronos at his o ce. The testing procedure is straightforward. Chronos asks the TA a question and the TA replies (see figure 6). The student clicks or taps the screen for the next question and answer until there are no more questions. The number of questions and how many correct answers that are required to pass the test are dependent on the mission. The questions are based directly on the associations that the student makes in the learning activities. This makes the knowledge model something akin to a list of propositions with two or three constituents depending on from which learning activity the knowledge has been established. We will call this kind of proposition a knowledge fragment. The list of knowledge fragments are updated, and overwritten, each time the student is done with an activity and has used the correction machine. The TA answers according to these knowledge fragments, which Figure 4: An example of GoH s timeline activity. Figure 5: An example of GoH s concept map activity. means that the TA only has knowledge from the latest learning activity session. Di erences Between GoH and BB One striking and important di erence between BB and GoH lies in the di erence between the knowledge models of the respective TAs. BB has a very explicit and logical inference map which is easy to read and follow. It is 4
9 Chronos. It is the only opportunity the user has to get a sense of the TA s progress. However, the test was found not to be engaging enough, in the sense that the student does not partake in any meaningful way, that is; it can only observe passively as the TA answers the questions. Therefore, students might skip through the steps too fast if they are impatient or just simply ignore the process altogether. This can lead to the student missing the important feedback about the learning progress of the TA. The group was thus tasked with making an overhaul of the testing of the TA. The main goal of the redesign of the test setting was to make the student find the setting more engaging and, therefore, becoming more receptive towards the feedback. Figure 6: GoH s initial test setting. also deterministic in the sense that the inferences always succeeds and that BB never forgets nor makes random errors. And while Betty can display some self-regulative behaviour, her certainty is always absolute, i.e. the associations between the concepts always holds as they are stated. Thus the map as it is constructed is in some sense absolute. The TA in GoH on the other hand has a much shallower knowledge model. It only consists of the list of knowledge fragments as described in the section above. It also lacks any visual representation. The monitoring of the TA s progression is provided through guidance that is not directly dependant on the TA s knowledge and learning. Another key di erence is how the learning progresses, from the viewpoint of the student. In BB Betty is subjected to quizzes that she answers according to her inferential knowledge model, and some guidance is provided during the construction of this model. Thus, the progression is akin to building a machine that is capable of performing a task. In GoH the progress is made through doing missions and passing tests, none of which are directly correlated to the knowledge and learning of the TA. Furthermore, the regulative and guiding function is played by Chronos, but how does the Time Elf implement the four principles outlined in the theoretical framework? Prima facie: not generally. The TA does not make any independent action or reasoning, it only guides the student to di erent activities. It could be said that the Time Elf provides guidance to good learning behaviour, but it is questionable if that is perceived as a function of the TA or the TALE taken as a whole. The third principle of TALEs, that the TALE should provide resources for learning, is however indeed implemented in both BB as well as GoH. Lastly, GoH does not provide any competitive elements, and this stands in contrast to most other TALEs. In BB the TAs are tested in a game show setting and is pitted against other TAs. 4 Design and Implementation The only direct source of feedback about the TA s knowledge is provided by the test in the o ce of professor Tasks and Requirements The solution to the problem presented was to make the test more interactive. Either by adding some kind of mechanism to the current test or by making a new kind of test altogether. Therefore, the tasks were as follows: Redesigning the current test to be more engaging for the student And/or designing a new test altogether Implementation of the new test setting The main target for these tasks was to create a new demonstration version of GoH. It would be used for demonstration purposes and to provide proof of concept. Early in the design process the decision was made to redesign the TA s learning mechanisms, this because of two reasons. Firstly, the flexibility of the implementation. As the TA was implemented before this project started, its only learning mechanism was built on the last facts the student had provided in one of the learning activities. This was clearly not enough for it to display a minimal necessary array of behaviours in the test setting. In order to make the test more engaging for the student, it was concluded that an necessary condition was that the TA should be able to act in a broader array of interesting and engaging ways. The second reason was that in order to aid the student in ascribing cognitive abilities to the TA, and therefore feel that there is more at stake, we reasoned that an more realistic, or at the least more flexible, learning model was needed. Thus, the first overarching requirement was an implementation of this learning model. From the implementation of the new learning model came the need for more learning activities. The learning activities were deemed too few and far between for any meaningful nuances of the TA s knowledge to occur. Hence, the second requirement: to implement more learning opportunities for the TA. The third requirement consists of using the new learning model of the TA in the test. This leads to the choice between keeping the structure of the current test and implementing some new mechanisms to keep the student engaged in the activity, or completely redesigning the test. The decision was made to keep the structure of the test for the first part of the project and devote the second part of the project for a complete redesign of the test setting. The complete redesign of the test setting was 5


10 made in order to utilise the new learning model to make the test more challenging and engaging for the player. A game show setting that is visually and thematically in line with GoH in general was deemed to give the most increase in the engagement of the students. This design is in line with and was inspired by BB. Development Methodology Initially boiler plating for a structured approach was done. For instance, in anticipation of the employment of an agile method a virtual board with the four familiar columns: To do, Ongoing, For review, and Done was created. This was to be used with either Scrum or Kanban. However, as the design and development process unfolded, it became clear that considered the time constraint, the comparatively limited scope of the tasks, and the small size of the group, that an informal ad-hoc approach was more e cient. An established methodology would require additional overhead while providing little or no added value in terms of overview or feedback. All necessary reviewing and planning could be done with physical meetings and supervision from the ETG. A project manager was elected halfway through the project to coordinate meetings and manage workload. Half of the team focused on conceptual design and prototyping, while the other produced code and implementation. is a direct and explicit link between the learning activity and the questions asked to the TA. This link is the only knowledge that the TA possesses. As mentioned, this knowledge model was deemed inadequate for the purpose of designing a more interesting test. The model developed adds a kind of intermediate step between the learning activity and the test. It utilises the knowledge fragments by collecting them in a list and adding weights to them in a simple associative model. So for instance every time the concepts Pestilence rules and Dogs and cats spread the disease are connected in the concept map activity and the correcting machine has been run, some weight is added to the pair. The weights in this list are percentages of how certain the TA is about a fact. For example, when the concepts Gallilei and first telescope is coupled and put in the 1550s-slot in the timeline activity, as shown in figure 7, the triplet is saved in the database with the weight 20. The visualisation of the numbers is not part of the interface. Overview of Tools GoH is developed with the meteor.js framework which is a collection of open source technologies for web application development together with some boilerplating with the aim to make the usage of these techonolgies easier and more e cient. The main components of the framework is node.js which is a client-server web technology that uses javascript as language, connected with a Mongodb database. Code repository and version control was managed through a Git server where everyone in the group had full access. Tests and development was done locally on each computer as the meteor framework allows for a local development server, as well as, a local Mongodb database server. The project only utilised one main branch and no formal or structured approach to testing was implemented. Figure 7: An example of a timeline association. Development of the Learning Model of the TA As noted above, the learning model of the TA consists of holding the belief of the last fact presented by the student in a learning activity. The TA s knowledge has the form of pairs or triplets of concepts that are organised according to the type of learning activity in which they were presented. For instance, the coupling of the concept Émilie du Châtelet with the concept translated the Principia that is put in the 1700s-slot could, in the timeline activity, yield the question When did Émilie du Châtelet translate the Principia? in the test setting. Another example is from the sorting activity, where the sorting of the concept Was not allowed to take over her late husband s position put in the box Maria Margarete Kirch could yield the question What scientist was not allowed to take over her late husband s position?. Hence, there Figure 8: An example of the implemented walkie-talkie activity. The fact that the learning activities did not provide enough occasions for the weights to be set was concluded. If the weights were to be set high in the first go in the learning activities the resulting test session would be the equivalent as when using the earlier implementation. This was solved by using the walkie-talkie functionality. 6


11 Therefore, occasionally, when the player enters a room, the TA asks the student a question (see figure 8) with multiple choice answers. The question is based on the list of knowledge fragments, it reinforces, decreases or makes a new fragment based on the student s answer. The first iteration of the walkie-talkie functionality only had support for the walkie-talkie to appear in one room in the TALE. Applying the New Model to the Test Setting Application of the new model required implementation of two functionalities. The first one is the fetching of the questions and mapping of these to the knowledge model of the TA. The questions already implemented were used as they were and the mapping of the questions to the knowledge fragments was straight forward. The TA now answers with the knowledge fragment that has the greatest weight. If a question is asked that is not in the list of beliefs held the TA answers that it does not know the answer. Secondly, if the TA has a weight that is below a threshold it becomes uncertain. This is shown to the student by some question marks over the head of the TA (as seen in figure 9). Further, if the knowledge fragment is below an even lower threshold the TA asks the student for help. The student is prompted with a question with multiple choices (see figure 10) similar to that in the walkie-talkie interaction. If the TA is too uncertain, she is not allowed to continue the test. This happens after three such incidents, and is shown to the player with Chronos getting irritated and aborts the test. Chronos urges the student to repeat the learning process, in other words, to repeat the learning activities. Figure 10: Demonstration of when the TA s asked for help. After the initial prototyping an adaptation of a game show setting was adopted. The TA is faced with competing against two other agents. The other agents are pseudo-randomly generated and given similar knowledge as the TA of the player. One of the opponents is given significantly lower weight of the knowledge fragment as to pose a minor challenge, while the other is given almost as good or even better knowledge than the TA and is thus a greater challenge to overcome. Kilgharrah, the dragon game character, acts as the game show host. Figure 9: Visualising the TA s behaviour when uncertain. Development of the New Test Setting After the design and development of the new learning model and the new test mechanics, the conceptualisation of the complete redesign of the new test setting was straightforward. Initial lo-fi prototyping revealed that the basic assumptions of the initial development was sound. The main focus of the prototyping was the look and feel of the test setting rather than its mechanics. To match the design of GoH i general, a fantasy theme was sketched and drawn. Figure 11: An example of the first question type in the implemented test setting. There is two kinds of questions, and in resemblance to the usual test setting, these questions are based on the TA s knowledge fragments. The first type (see figure 11) has the same logic as the usual test setting; the dragon takes turns asking the agents questions and the agents are supposed to answer. The second type consists of three pictures, where two of the pictures belong to the same theme (see figure 12). The TA is supposed to, in order to answer correctly, select the picture that do not belong to the theme. In both cases, if the agent in question is uncertain, i.e. the value of the fragment is below a certain threshold, the TA asks her teacher for help. The teacher can only help its TA three times during the test. 7

12 usually not allowed to progress to the test at Chronos o ce unless the correcting machine in the learning activities confirms enough correct answers. This means that the connection between the associative knowledge of the TA and the results of the learning activities might not reflect the test result in the same way. Opportunities for Research Figure 12: An example of the second question type in the implemented test setting. A gate-keeping function was also added. At the end of a mission when the student has unlocked the test, she is prompted with a question whether she is confident that the TA is capable of passing the test. The student is given the choice of either answering herself or asking the TA. The response of the TA is contingent on how the weights are set. If the answer is negative, the student has to do an additional time travel or learning activity. Pilot Testing Beyond the common debugging and verification of met requirements, a pilot test with a class of Swedish 6th graders was performed. The class was comfortable with educational technology and everyone was equipped with a mobile device as their standard everyday learning tool. The pilot test was performed in conjunction with another pilot test were the older, non-associative implementation of the TA was used. We wanted to investigate whether the student noticed any di erence between the two. The methods for data collection were logging of interactions, a questionnaire and observation. However, the results of this study were deemed inconclusive. 5 General Discussion In this section some general remarks about the implementation will be discussed, as well as, some ideas for further research and development. Also, we will assess whether the main tasks and overarching goals were fulfilled, and to what degree. Some Remarks About the End Result The goal of making the test more engaging was achieved by making the student see that the TA can be uncertain of some answers and that the student has to help when that happens. To certainly know if the students actually finds the test more engaging or not, some research on this is required, but the task stemming from this goal is achieved. Moreover, one major issue with the redesigned test setting is that the student already has all the necessary feedback from the correcting machine. The student is One of the principles of BB and according to Blair et. al. TALEs, in general, is the explicit visual representation of the learned knowledge of the TA. However, it remains an open question if the same ascription of cognitive agency to the TA by the student can be invoked through other means. In the new implementation of the TA for GoH the student has no visual representation of the knowledge of the TA, the student has to make do with more subtle, and dare we to say, realistic social cues. If one were to implement some kind of explicit visual representation of the knowledge of the TA, e.g. by a bar graph or a simple list of numbers, then a comparison could be made with more subtle and social representation of the knowledge of the TA, regarding the student s learning behaviour. There is a lingering interested question of what it takes for a student in a TALE setting to suspend disbelief and ascribe knowledge to the TA that is not answered in the referenced literature. Furthermore, as repetition is one of the most central aspects of declarative knowledge acquisition, one can wonder how much of this is needed for learning. This is something that could be explored using GoH as an experimental tool. A statistical model could be constructed from data using di erent weights for the TA, to investigate a possible correlation. Lastly, the game show setting has the same content and very similar types of questions as the test setting with no competitive element. This provides research opportunities for investigating the competitive element of TALEs, as one can compare the interaction performed during the usual test setting with the new one. Ideas for Further Research As the concept of virtual TAs is new, not much research and development has been done on di erent TAs. An overview and comparison between di erent TAs and how well the facilitate learning by teaching would perhaps indicate what kind of mechanisms that are at play for different TAs and TALEs. This would in turn show what aspects of the di erent TAs that can be tweaked to make for an optimal learning environment. Another area for research, connected to the previous one, is what it takes for students to ascribe cognitive properties to the TA. What kind of properties are more di - cult to stimulate an ascription for? What are the minimal conditions for a suspension of disbelief? GoH, with the new knowledge model, provides yet another cognitive aspect of TAs to explore in this way. Ideas for Further Development One property of a good TA according to Blair et. al. (2006) is to have it to spontaneously reason and comment on whether the conclusions seems to make sense. The TA 8
13 could be given the ability to question some false beliefs held, either if they contradict each other or if false beliefs held are hard-coded to be checked by the TA. This would allow for self-regulative abilities that makes the student more aware of her learning behaviour. To fine tune the weights that are given, i.e. how fast the TA learns, one has to hard-code the numbers. A better solution that would allow for a more flexible approach would be to either allow for configuration in the database, for instance on the user or application level, or to have some kind of graphical interface. This would also allow for a more adaptive TALE in general, as this would have implications on the learning activities and the general set up for the missions as a whole. This would in turn provide opportunities for research on the correlation between how hard it is to teach the TA and how that correlates to the learning of the student. Tutoring in Problem Solving. Journal of Child Psychology and Psychiatry ää Graphics Betty s Brain (2016) bettysbrain.php (Downloaded ) References Blair, K., Schwartz, D. L., Biswas, G., Leelawong, K. (2006) Pedagogical Agents for Learning by Teaching: Teachable Agents Chase, C., Chin, D. B., Oppezzo, M., Schwartz D.L. (2009) Teachable Agents and the Protégé E ect: Increasing the E ort Towards Learning Stanford University School of Education Gummere, R. M., Seneca, L. A. & Corcoran, T. H. (2006). Seneca: in ten volumes (Vol. 1). Retrieved January 17, Kirkegaard, C., (2016). Adding Challenge to a Teachable Agent in a Virtual Learning Environment, Diss., Linköping University Kirkegaard, C., Gulz, A. & Silvervarg, A. (2014). Introducing a Challenging Teachable Agent Department of Computer and Information Science, Linköping University Matsuda, N., Yarzebinski, E., Keiser, V., Raizada, R., Stylianides, G. J., & Koedinger, K. R. (2013). Studying the E ect of Competitive Game Show in a Learning by Teaching Environment. International Journal of Artificial Intelligence in Education, 23(1-4), 1-21 Schneider, W., (2008). The Development of Metacognitive Knowledge in Children and Adolescents: Major trends and Implications for Education, Mind, Brain and Education 2:3, Schwartz, D.L., Chase, C., Chin, D., Oppezzo, M., Kwong, H., Okita, S., Roscoe, R., Hoyeong, J. Wagster, J. & Biswas, G., (2009) Interactive Metacognition: Monitoring and Regulating a Teachable Agent, To appear in D.J. Hacker, J. Dunlosky, & A.C. Graesser (Eds.), Handbook of Metacognition in Education. Shute, V., (2007) Focus on Formative Feedback, Research report, ETS, Princeton Sjödén, B., (2015). What makes good educational software?, Diss., Lund University Timms, M., DeVelle, S., Schwantner, U., Lay, D. (2015). Towards a Model of How Learners Process Feedback, Australian Council for Educational Research, Camberwell Wood, D., Bruner, J. S. & Ross, G (1976) The Role of 9
14
15 Pedagogical Agents and Source Criticism in the Educational Software Watchers of History Agata Janiszewska, Natali Ljunggren, Silje Mari Lundal, Oskar Holmberg, Joel Pålsson In a project devoted to the development of a digital teaching aid for teaching history to year old children, a new pedagogical agent was created, as well as a new module for introducing and teaching the concept of source criticism. The new agent is to be a tutor, a helper and an ally to the user, and its features have been developed in accordance with findings from research on teachable agents, social psychology and cognitive science. As a frame for this character s helping function, we have also designed a so called magic book where the user can find a dictionary as well as hints and questions for helping the students solve the tasks. In addition to designing the new character, source criticism has been incorporated into the learning tool through a new introductory module including several new missions and tasks. In this new module, consisting of three sub modules, the new pedagogical agent teaches the student about the use of sources in the history field. The results of this project consist of the conceptual design of the three sub modules - including a storyboard with sketches of graphics, complete dialogue and tasks - as well as a hi-fi prototype of the first sub module in the form of a web application. A user test of the hi-fi prototype has also been conducted, which provided us with positive and useful feedback from a group of 11 children from the sixth grade. 1 Introduction Watchers of History (Historiens väktare) is a digital teaching aid (DTA) developed by the Educational Technology Group - a group of senior researchers, PhD students and master students from Lund University and Linköping University in Sweden. The idea behind the project was to develop a DTA for teaching history to 4th and 5th grade students. For this purpose, the DTA includes a teachable agent, which is a concept that has previously been used in DTAs within the science, technology, engineering and mathematics (STEM) areas. However, to our knowledge, Watchers of History is the first project where a teachable agent is used within a social science context, namely, in the history field. In accordance with the Swedish national curriculum, and the knowledge demands for 4th, 5th and 6th grade students for the history subject, the DTA focuses on Scandinavian and European history between the 15th and 19th century. The first prototype of Watchers of History was developed in 2012 and since then the project has grown with the incorporation of new modules and features. In our project, which constitutes the scope of this paper, we have continued to evolve this DTA with a focus on two major issues: i) developing a new pedagogical agent, and ii) creating a new module for teaching source criticism. The new character has been developed with the goal of creating a fun and motivating character that also helps the student when he or she encounters a problem, and who would function as a social peer and ally. Source criticism, and especially functional source criticism, is an important part of the latest curriculum published by the National Agency for Education in Sweden, and is something that has been missing from the previously developed modules. In this paper, we will present the methods and theories we have used to develop the new module and the new character - including research on teachable agents, social psychology, cognitive science and formative feedback as well as principles of interaction design. The results that will be presented consists both of a lo-fi prototype with instructions and dialogue for future implementation, and a hi-fi prototype in the form of web application. In addition, we will also present the results from a test of the hi-fi prototype of our new module with the new character included. First, we will give a theoretical introduction to the field of educational technology, pedagogical and teachable agents, as well as formative feedback. We will also explain the background for this project and why it was deemed necessary that a new pedagogical character was developed in Watchers of History. The importance given to incorporating source criticism in the history subject, and especially functional source criticism as described in the latest curriculum, will also be reviewed, to show why it there is a need for including source criticism in Watchers of History. The process of the conceptual design will also be thoroughly described, as well as the development of a high fidelity (hi-fi) prototype. The results of the conceptual design process consist of i) graphical sketches, characteristics and storyline for the new character, ii) a lo-fi prototype with the storyboard, dialogues, tasks and design of graphical material for three sub modules and iii) a web application hi-fi prototype, demonstrating the graphical and interactive aspects of the first sub module of the lo-fi prototype. After describing the design process and our reasons for making the choices we made, we will present the method and results from a user test of the web application hi-fi prototype. Finally, we will give some future directions for the further development of our new module, the new character and Watchers of History as a whole.
16 2 Educational Technology and Theoretical Background Educational technology is a broad research area, dedicated to the development of technological learning tools to be used for facilitating learning in real life learning situations, such as in the classroom, as well as being useful research tools. The field of educational technology thus encompasses a wide variety of subjects, from pedagogy to psychology to computer science. More concretely, educational technology usually involves introducing computers and other electronic devices into the classroom. An example of this could be computer games designed to teach and test knowledge in a specific subject, such as the educational software Betty s Brain, designed to teach natural science (Biswas, Leelawong, Schwartz, Vye, & at Vanderbilt, 2005). These tools are usually meant as a supplement to classical classroom teaching, and the goal of introducing these tools include i) guiding and structuring the students learning with the aid of visual representations, ii) organizing student activity at home and in the classroom, iii) making the students more motivated to learn, as well as iv) attempting to give di erent challenges to students of di erent reading and subject relevant abilities (Blair, Schwartz, Biswas, & Leelawong, 2007; Biswas et al., 2005; Chase, Chin, Oppezzo, & Schwartz, 2009). Some have argued for a view where technology in the classroom is seen as a disadvantage, with new tools seen as distractors rather than aids (Wenglinsky, 1998), but several studies have found positive e ects from educational tools (Chase et al., 2009; Johnson & Lester, 2016). There has been found educational benefits from teaching someone else (Bargh & Schul, 1980), and this learning-byteaching principle is applied in several educational technology tools, such as the digital teaching aid presented here, Watchers of History, where one of its main features is a teachable agent (TA). 2.1 Pedagogical Agents and Teachable Agents A pedagogical agent (PA) is a piece of software that users can relate to on a social level. The PAs often carry human characteristics and their purpose is to facilitate learning through social interaction. There is a multitude of di erent types of PAs such as teachers, assistants and students. A study conducted by (Mabanza & de Wet, 2014) showed that the introduction of a PA in the role of a teacher considerably improved the students results in comparison to a group of students subjected to traditional digital teaching without a PA. Another form of PAs come in the form of so called teachable agents (TAs). In digital teaching aids (DTAs) with TAs, the student using the DTA will first learn something and then teach what they have learned to the TA. Instead of testing the student, the TA is tested, and the benefits of this strategy has been documented in a number of studies ((Blair et al., 2007; Chase et al., 2009)). TAs are to be taught by the user by, for instance, building conceptual maps that will act as the TA s memory and knowledge. The TAs are subsequently tested to validate whether they have been taught correctly. In this way, the students can get a deeper understanding of the material, since they need to reprocess it and restructure it when teaching it to someone else. Another benefit from testing the TA instead of the student, is that it can protect the student s self e cacy by making them attribute mistakes to the TA s learning abilities, rather than to their own ability to learn or understand the task or their own intelligence. In addition to these benefits, there are also positive motivational factors. For instance, in one study, middle school students were eager and willing to retake a test together with the TA several times, so that the TA could join a science club ((Blair et al., 2007)). Results from a study conducted by (Chase et al., 2009), suggest that the mere state of belief can alter motivation and e ort. The participants here were from the 8th grade, and they used a TA software identical in setup to a software called Betty s Brain (further reading in (Leelawong & Biswas, 2008)). The students were split into two groups where one group was told that they were teaching their TAs, and the other group was told that they were using the game to learn for themselves. The study showed that students in the TA-condition spent nearly twice as much time reading about the subject in question than the other group, and also spent significantly more time refining their knowledge maps and quizzing their TA. Moreover, the e ect was most prominent for the low achieving students who performed just as well on the harder questions in a post-test as the high achieving students in the other group. The conclusion of the study presents the existence of a protégé e ect, namely that students are more willing to make the e ort towards learning on behalf of a computerized protégé than for themselves (Chase et al., 2009, p. 348). 2.2 The Need for a New Character In the Watchers of History project there has been a prevalent need for a new PA in addition to the existing TA. More concretely is has been a demand of a character that could fulfill the following purposes: Motivating the student to continue solving problems through the DTA Providing support when needed Making the DTA more enjoyable by adding a friendly and funny character If the student finds a problem too di cult, he or she should be guided in some way and a new PA character could work as a helping hand. This character should be engaging enough to make the student feel that he or she wants to interact with the character. This means giving the student tips on how to perform certain tasks, provide positive encouragement and aid in learning. The new character should also act as a friend and ally, give support by saying motivating things such as I know this is di cult but try to think in a di erent manner such as..., and make the student feel rewarded when a problem has been solved. In other words, the new character should give the student a feeling of teamwork, which in this case is important since Watchers of History is a single player DTA. The above described concept of a new character is a direct application of what the (Mabanza & de Wet, 2014) showed as good practice for this type of software, as described in the previous section. 2
17 2.3 Formative Feedback Feedback is something that is crucial for many areas. The concept of feedback in an interaction design context might be the first one to come to mind, where one tries to make the system as easy and intuitive as possible for the user by making it clear how their actions in a given situation a ect the system. A di erent form of feedback which relates more specifically to learning rather than to interaction design, is what Shute (2008) refers to as formative feedback. Formative feedback is a type of feedback which enhances learning, and that not only marks correct or incorrect answers, but also gives a type of evaluation as well as suggestions for how to improve. To be able to assess one s learning and to be able to improve, feedback from the teacher with more than a mere assessment of whether the answer is right or wrong is often helpful. The research on feedback has been quite fragmented with various conflicting results. In a meta analysis by Shute (2008), it is specified how one should format feedback to be as beneficial as possible for learning. To enhance learning, feedback should: Focus on the task, not the learner Be elaborate but in manageable units Be specific Provide specific learning goals Be unbiased and objective Not be given before the learner has attempted to solve the task Some of these guidelines seem quite obvious, for example that feedback should be unbiased and objective. However, there are some guidelines that are less obvious, yet very important. This includes the finding that feedback should provide specific learning goals and not be given before the learner has attempted to solve the task on their own. Moreover, learning goals are also important to let the learner know what they need to do. Learning goals are also important because they lend focus to the learning in itself, rather than on performance. By concentrating on learning rather than individual performance to learning, the student s self esteem is protected when the learner is making mistakes. This is crucial, as mistakes are an important part of the learning process. Feedback should also not be given too early, as it is important to not disturb the learner s problem solving process (Shute, 2008). In her article, Shute (2008) also mentions some ways of giving feedback that can actually impede the learning process. The most important ones to avoid are the following: Comparing students to each other Threatening the learner s self-esteem To be careful of giving praise and again not to interrupt the learner to give feedback Moreover, as there seems to be a di erence between how low- and high-achieving learners respond to di erent types of feedback, some type of individualization in what feedback the learners get should also be present. When it comes to digital learning aids (DTAs) and other computer programs, giving feedback according to these guidelines can actually be submitted more easily than in person-to-person interaction. Here, the feedback is unbiased and objective, pre-programmed and task-oriented in small manageable chunks, and usually only given after the learner has actively asked for it and after they have attempted to solve the problem on their own. Such tools can also be used to study feedback in new ways, because of the possibility to log mouse clicks from a user s interaction with the software. For example, Cutumisu, Blair, Chin and Schwarz (2015) conducted a study where they let children create posters in a DTA. The children were then able to choose what type of feedback they received. The researchers were able to study the children s process because of the possibilities of using a DTA. As a somewhat counterintuitive result, they found that negative feedback resulted in better learning (Cutumisu, Blair, Chin, & Schwartz, 2015). This could perhaps be related to the finding that too much praise can impede learning by making the student focus on their own achievements and skills rather than the learning process (Shute, 2008). DTAs with TAs are valuable mediums for giving the right type of feedback for learning. The dos and don ts presented in Shute (2008) are important for the learning process, and we have incorporated her findings in our DTA, as will be further discussed in the conceptual design section. 3 Source Criticism In the syllabus for history in Swedish elementary schools, provided as a part of the national curriculum, source criticism has been included as a fundamental part (Skolverket, 2016b). As written in the curriculum: The teaching should stimulate the students curiosity for history and contribute to their development of knowledge about how we can know anything about the past through historical source materials, places and people s stories. Students should, through teaching, also be given the opportunity to develop the ability to ask questions about and evaluate sources that constitute the basis of historical knowledge (Skolverket, 2016b, p.196). 3.1 Functional Source Criticism When it comes to the evaluation of sources, a relatively new term called functional source criticism (FSC) has been established. The term is not explicitly used in the curriculum but its meaning is of great importance for the knowledge demands for many subjects, such as, for instance, history. As explained in an interview with Johan Samuelsson (Mannerheim, 2012), project leader for the development of the National Agency for Education s assessment support in history, the idea of FSC is that a source should be validated in its context, rather than being rejected as 3
18 being a reliable or unreliable source in general. To give an example, a painting depicting a person during the 16th century, painted in the 19th century, is probably not a reliable source for knowledge about how people dressed in the 16th century. However, it can be still be a useful source for obtaining knowledge about what a painting from the 19th century could look like, or for how people of the 19th century thought that people dressed in the 16th century. In the knowledge demands for the history subject for 6th grade students, also featured in the curriculum, the term usefulness ( användbarhet ) is used when talking about sources. In the knowledge demands of the 9th grade, the two terms relevance ( relevans ) and trustworthiness ( trovärdighet ) are instead used in this context. In (Skolverket, 2016a), the later terms are explained in relation to both history (historia), scripture (religionskunskap), biology (biologi), Swedish (svenska) and Swedish as a second language (svenska som andraspråk), as they appear in the knowledge demands for all these subjects. Relevance is said to refer to the extent to which the source is useful in relation to the formulation of the question. A single source can be relevant to answer some questions, but unusable in relation to other questions (Skolverket 2016a, p. 8). The concept of relevance can thus be said to refer to the FSC. Trustworthiness, on the other hand, refers to putting classic source critical questions about the consignor, purpose and tendency of the source (Skolverket 2016a, p. 8). In the document, it is explained that usefulness can be interpreted as a looser term for which the take-o point has been that the usefulness of a source can be evaluated from di erent perspectives, where relevance and trustworthiness are two of those. Thus, relevance and trustworthiness can be important evaluation tools even in the 6th grade, even if a student from the 6th grade could also carry out a simpler reasoning about a source s usefulness by instead using simpler evaluation perspectives such as user friendliness ( användarvänlighet ), referring to the extent to which the information in the source is available for the individual student. However, as the terms relevance and trustworthiness are explicitly used in the knowledge demands for the 9th grade, it is of great importance that teachers address di erent evaluation perspectives early on, allowing the students to evaluate the usefulness of sources from a variety of perspectives. Even though the curriculum provides information about important objectives related to source criticism, it does not provide the teachers with information about how the objectives should be reached, i.e. how it could be implemented in education. As the focus on the importance of source criticism has increased and the concept of FSC has been introduced since the previous syllabus, published at the time of the previous curriculum, Lpf 94, there is also a demand of educational material that illuminates the various aspects of source criticism, and this is still is a scarce commodity. This means that the incorporation of source criticism in general, and FSC in particular, in Watchers of History could be of great importance and benefit for many schools and teachers around the country. 4 Initiating the Design Process Since this project initially consisted of two sub projects of di erent nature, i.e., the development of a new pedagogical agent and the incorporation of source criticism, di erent approaches for di erent parts of the project were used. The two sub projects were developed in parallel. Initially, the projects were separated, but they became interlaced quite early in the design process. 4.1 History Didactics and Source Criticism As none of the project members are experts on history or pedagogics, we were in need of external connoisseurship. Therefore, we consulted Irene Andersson who works as a history didactic teacher at Malmö University and as well as collaborating with the Educational Technology Group to give us important input. Initially, Andersson gave us information about the National Agency for Education s view on source criticism and the fundamentals of the concept of functional source criticism. We were then provided with a summary document made by Andersson, containing keystones and important concepts for teaching history and source criticism at an elementary and middle school level. Andersson also suggested that we studied the most important document in this context; the curriculum for the Swedish elementary school. We studied this, and thereby gained important insight into the syllabus and knowledge demands for teaching history in elementary schools. Andersson continued being a great help and consultant throughout the whole project. 4.2 Prototyping and Implementation To be able to realize our theoretical foundation as a proper DTA module, we needed to use some kind of prototyping, i.e., some intermediate steps between the conceptual work and the final implementation in program code. An essential step was to translate the framework of functional source criticism provided by the curriculum, as well as theories of pedagogical agents and feedback, into actual tasks within the existing framework of Watchers of History. To achieve this, we needed a simple and flexible way of prototyping. A low fidelity (lo-fi) prototyping approach was therefore considered suitable. More concretely, we decided to make a prototype containing sketches of graphical material and dialogue using paper and pencil. As there is still a great leap between such a lo-fi prototype and a finally implemented digital teaching aid, there was also an obvious demand for a more polished prototype, containing fully developed graphical material. Therefore, we decided to also create high fidelity (hi-fi) prototype that could be used for demonstration and testing purposes. From a time saving perspective, the possibility of being able to test the module, including the graphical content, story, tasks, as well as some of the interactive aspects, before the actual implementation in code was considered greatly beneficial. Our insights about the needs for thorough and sophisticated conceptual groundwork led us to focus our time on developing the concept in accordance to the Swedish curriculum, applying findings from research on TAs and 4
19 formative feedback, as well as developing a solid hi-fi prototype, rather than to spend time on the more strictly technical programming issues. To be able to work more e ciently with the two prototypes parallelly, the project group was divided into two sub groups. The first one focused on the fundamental conceptual work, storyboarding and dialogue writing, i.e. developing a lo-fi prototype. The second one used the lo-fi prototype as a blueprint to further develop the interactive aspects, with the end product being a digital hi-fi prototype. 5 Conceptual Design As our module was going to be integrated with the previously existing modules of Watchers of History, an important part of the conceptual design and story writing was to relate it to the already existing overall storyline of DTA. Taking the overall storyline as a starting point, the the conceptual design phase progressed as a nonlinear process, where ideas grew out of brainstorming sessions and were further developed through comprehensive discussions and literature search. The conceptual work proceeded within the lo-fi prototyping group, even though many details were also discussed with the hi-fi prototyping group. This was necessary to make sure that the lofi prototype was feasible for implementation in the hi-fi prototype, as well as for the future program code implementation. 5.1 Watchers of History Storyline Watchers of History is based upon a story about an old professor named Chronos who has been watching and studying history unfolding around him for thousands of years. Now it is finally time for Chronos to retire, so he needs to find a successor. He is considering to choose one of the time elfs who also lives in castle, but to be get this prestigious position, the time elf must first gain comprehensive historical knowledge. The time elf is the teachable agent (TA) in this DTA. The user s mission is therefore to help the time elf become worthy of becoming Chronos successor. To do this, the user travels back in time to specific historical events, obtains knowledge about these events and subsequently teaches what he or she has learnt to the time elf. The time journeys are followed by tests, consisting of di erent sorts of tasks where the the elf is tested by Chronos about what it has learnt from the user. 5.2 Development of the Pedagogical Agent To commence the development of the pedagogical agent, a series of brainstorming sessions were arranged in the project s first weeks. Initially, the function of the new character was discussed and clarified. The initial demands was a character that could motivate the student as well as providing help and support when needed. In an early brainstorming session the idea of finding a way to combine these demands with the teaching of source criticism was launched. Further discussions led up to the idea of letting the character be an archivist living in an archive located in the basement of the castle. This would give a good backdrop for the character being someone that possesses a great amount of historical knowledge, whilst also establishing a place, to store actual historical sources, i.e., in the archive. The new character was thus to be responsible of introducing the user to the concept of source criticism, and the two projects were merged into one. Subsequently, discussions about aspects like the PA s age and gender were raised. When it came to the age factor we wanted the character to be roughly the same age as the contemplated users, i.e. the year old students, so that the users could relate to this character and think of it as a peer. On the other hand, we also wanted it to be as old as possible to justify the character s vast historical knowledge. This contradiction led to a final concept of letting the character be very old (400 years in human years) but to appear and behave as a somewhat mischievous child around the user s age since creatures of its kind mature very slowly. In an early phase of the character development, the idea of letting the character have an androgynous look was raised. The reason was make it possible for both male and female students to identify with the character, as well as to avoid complying to gender stereotypes. Literature and research on gender stereotypes and virtual agents (Gulz, Ahlner, & Haake, 2007), (Gulz & Haake, 2010), as well as studies on how a pedagogical agent s appearance can a ect motivation and learning (Gulz & Haake, 2006) led to a great focus on making conscious choices regarding the pedagogical agent s appearance. For instance, we chose to give the characters glasses since it has been found that this makes people appear intelligent (Terry & Krantz, 1993). The gender aspect was taken into account also when naming the character. We wanted to come up with a name that was gender-neutral, and ended up with naming our new pedagogical agent Nauvo, which is, to our knowledge, not directly associated with being female or male. 5.3 The Start Module of Watchers of History As noted, we also to make the source criticism perspective become a fundamental part of not only our module, but to be present throughout the whole DTA. Therefore, it was decided that our new module would become the start module of Watchers of History. In other words our module would work as a stepping stone, where the user could obtain a critical perspective that, hopefully, could be of great use also in the rest of the DTA. 5.4 The Magic Book During the project we also felt the need for a way to provide the user with help and feedback, such as hints or additional questions related to a particular task. Since the dialogues contain a lot of new and di cult words, we also wanted to create a way of explaining these words and expressions. This led to the idea of introducing a new feature; the magic book. The idea behind the magic book was to address the mentioned demands through an object which would be available for the user throughout the whole DTA. The magic book was going to contain three tabs; one providing help during a particular task, one providing a dictionary with definitions and explana- 5
20 tions of di cult words and expressions, as well as one tab with a personal, customized dictionary with words and definitions that the user has chosen to save. The help functions and feedback in the magic was developed according to the guidelines specified in Shute (2008). Whenever a task is completed, the learner receives a short summary from Nauvo of what they just learned, and the DTA does not give any possibilities for comparing students performance - it even gives very little possibility for students to compare amongst themselves. We also tried to create two di erent feedback levels - one for low achievers and one for high achievers - in the form of help questions that are initially more abstract and subsequently, if the user asks for help again, more concrete and even more guiding. 5.5 Three Sub Modules Early on, we decided to let our module consist of three sub modules, each consisting of time journeys and tasks in line with the already existing overall concept of the DTA. In these travels and tasks, we wanted to emphasize the perspectives of women and children, since male perspectives, including stories of men told by men, has dominated historical writing. The first sub module was to be an introduction of the new character as well as an introduction to the basic concepts of functional source criticism. The second module was going to let the user practice these basic concepts, in addition to introducing more advanced concepts related to functional source criticism. The third sub module was supposed to let the user apply all these concepts in a setup related to the already existing modules of the Watchers of History, by also involving testing of the teachable agent. Further, the idea was to design the tasks, related to the journeys of a sub module, from the basic concept of that particular sub module. 5.6 The First Sub Module As mentioned, the idea of the first sub module was to introduce the new pedagogical agent, as well as introducing the basic concepts of functional source criticism with help from three time journeys and related tasks. In this module, the user learns five fundamental questions that one can use to evaluate a source: Who created the source, Where was the source created?, When was the source created?, Why was the source created?, and For whom was the source created?. These questions are included to teach the children how to evaluate the usefulness of a source by trying to make them contemplate the source s trustworthiness, relevance and objectiveness. The questions are subsequently trained and some additional concepts are introduced, such as the difference between o cial and private sources Meeting the New Pedagogical Agent The new pedagogical agent, Nauvo, is introduced to the user in the castle lobby, which can be seen as the starting point for visiting professor Chronos o ce or entering a new time journey, as well the place to return to after finishing a journey or a task. Since we wanted to use the first time journey as an example for introducing the concept of source criticism, we wanted the meeting with Nauvo to take place after finishing the first time journey. Further, we wanted to let the source criticism introduction take place in the archive, where the historical sources that provide the basis of the time journeys, would be available. After Nauvo has been introduced, the user therefore follows Nauvo from the lobby down into the archive The Introduction of Historical Sources To be able to introduce the concepts of source criticism, we first needed to teach the user what an historical source actually is. We wanted to do this by showing examples of di erent historical sources in di erent formats, so that the user could see that a source can be anything from a written document to a silver coin. The six sources chosen are shown together with a timeline, and the user is asked to place them chronologically on this timeline. The timeline contains the main historical epochs covered in the history education of the 4th, 5th and 6th grade in the swedish school, i.e., the Viking Age (vikingatiden), the Middle Ages (medeltiden), the Great Power period (stormaktstiden), the Age of Liberty (frihetstiden) and the Modern Times (nya tiden). Four of the the sources were found at online museums, libraries, archives and databases and includes the following: a coin from the 10th or 11th century (Nordiska Museet, ), a child s boot from the middle ages (Medeltidsmuseet, ), a map over Sweden from the 17th century (Andreas Bureus, 1626) and a painting from the 18th century (Alexander Roslin, 1769). These sources were supplemented by a runic stone from the 9th century found in the park Lundagård in the city center of Lund (Vallenbergastenen, ca 1050) and a group photography of the project members. This timeline task is presented by Nauvo in the archive Time Journeys and Historical Content Our plan for the first sub module was to create three time journeys that were based on three real historical sources from three di erent centuries. The first source is a travel diary written by a boy named Eric Wilhelm Edholm on his journey from Stockholm to Skåne in In the first time journey, the user thus travels back to 1824 to meet Eric. The second source is a court protocol from a trial in 1484, concerning a girl called Cristin who is accused of murdering her newborn baby. This source was chosen so that the user can obtain knowledge about children s and women s situation in the 15th century, and resulted in a time journey where the user travels back to 1484 to observe the trial. The third source is a painting from 1662 depicting a deceased infant named Carl Gustafsson Horn. This source was chosen to teach the user about the high infant mortality in the 17th century, as well as about how parents often commemorated children in this way. The resulting time journey is one where the user travels back to 1662 and enters the painter s studio, and meets the painter and Carl Gustafsson Horns parents. The time journeys also include little tasks to make them more interesting, such as, for instance helping the painter to add colour to his painting. By choosing these 6
21 sources we were able to introduce the terms private written source and o cial written source, as well as illustrating that not all sources are written. Through using these di erent sources, the students are able to train the fundamental questions on three di erent types of sources and understand that these questions can help one evaluate a number of di erent types of sources. 5.7 The Second Sub Module In the second sub module, we focused on more advanced concepts of source criticism. One of these concepts was interpretation, referring to the fact that di erent sources can reflect di erent interpretations of the same event, with any number of biases and hidden or explicit agendas. In addition, we wanted to give weight to the fact that one source can be interpreted di erently in di erent ages, by di erent people reading it today, and by people from di erent theoretical backgrounds. In addition, the concept of cause and e ect was introduced. With this concept, we wanted to show the connections between causes and e ects in some di erent historical events by, for instance by providing a source and then have the user look at some consequences related to the source. The concepts are explained by Nauvo and are then trained in the task following the journey Time Journeys and Historical Content To be able to teach the concepts of the second sub module, a source containing a clear cause and e ect was chosen. The source was a letter to a governmental agency concerning an ill behaved girl written by her teacher. In the letter, the teacher asks for the girl to be taken away from her parents and placed in a home for ill behaved girls, due to the fact that she has been stealing and skipping class. This source led to the creation of a time journey to a school in Stockholm in After visiting the school and seeing the ill behaved girl and her teacher, the user follows the girl home to see under what conditions some children lived in the city at that time. Here, they see that the girl comes from a poor family, and that her mother does not have much time to take care of her, since she has to work all day. By choosing this source, we wanted to show how one s appraisal of a situation can be biased if only one source is consulted. We also wanted to show that it is important to be critical to sources providing only one person s perspective of the story. The time journey shows at least two di erent appraisals of the girl s behaviour. One perspective, which comes through in the letter, is that the girl is ill behaved because of her bad character. Another perspective, which comes from following the girl home, is that she is ill behaved because she she is not getting the care and attention she needs from her caretakers and that she, for instance, steals out of hunger. 5.8 The Third Sub Module The third, last, sub module was dedicated to the introduction of another more abstract concept of source criticism, namely the concept of comparing di erent sources. In the first task of this sub module, the TA is here set up to fail on on purpose by making it generalize from onesided information by saying, for instance, that all children in Sweden at that time were lonely like the girl in the time journey. The idea of this is to make an educational point by drawing additional attention to how incomplete the information one can gather is when only one source is used. In addition, we wanted to show that there can be functional consequences of not being critical to sources, by making the TA fail the test. To protect the learner s self-esteem it is the TA that fails on the test, and Nauvo subsequently apologizes and takes the blame for the mistake. This was done to not counteract the protective e ects a TA has on the learner s self-esteem. Another important idea of the last sub module was to start using the general structure of the existing modules of Watchers of History. The general structure of our module has been quite di erent from the existing modules, since the first two sub modules were more about learning about source criticism than about teaching the TA. To create a smooth bridge between our modules and the rest of Watchers of History, the last sub module was purposefully structured more alike to the rest of the DTA, with the inclusion of professor Chronos and testing of the TA Time Journeys and Historical Content In this last sub module and it s two last journeys, we did not base the content on a specific source. Instead, we tried to gather some general information about children s conditions in Sweden at the end of the 19th century and made up two stories. As mentioned above, in the first time journey the user sees the conditions of poor and ill behaved in the city who is to be sent to a girl s home. There, the pupils learn about the living conditions, the reasons for them ending up there and what future these girls might have. After the users finish the task where the TA is set up to fail on the test, they are encouraged to take another journey. This second journey takes the user to a large family in the countryside, with a situation very di erent from the ill behaved girl s situation. After visiting the family in the countryside, the TA is supposed to be taught a more nuanced picture of children s conditions in that time, by highlighting the fact that one cannot generalize to a whole population from one single source. The choice of not using one specific and concrete source, was grounded in the fact that we wanted to emulate the structure of the rest of the Watchers of History DTA, where the time journeys are not based on a given, specific source. After this last time journey, the students are expected to have a general, basic understanding of functional source criticism, in addition to historical knowledge gained. 6 The Hi-Fi Prototype The hi-fi prototype was developed using the web based prototype tool InVision. InVision o ers the possibility of connecting screen images by adding links between them. A jump to the next image can be triggered by either clicking on or dragging the mouse over a specified area of the 7


22 image, or by setting a timer. The graphic components, i.e., the backgrounds, characters and additional objects, were mainly created by two graphic designers from the Educational Technology Group, with inspiration from our sketches and explanations of how we wanted it to look. From these components the screen images of the prototype were assembled using Photoshop. As we decided to let the hi-fi prototype cover only the first sub module of the lo-fi prototype, the hi-fi prototype only includes the following parts: First time journey: Eric Wilhelm Edholm s journey. Introducing archivist Nauvo in the castle lobby. Introducing the archive. Introducing the magic book. Figure 1: One of the six non-written historical sources in the timeline task. By clicking on the right place of the timeline the source is moved to the timeline. Feedback is provided in the form of a green tick when the historical source hits the right place on the timeline. Introducing the concept of historical sources, using Eric Wilhelm Edholm s diary. First task: Placing historical sources on a timeline. Introducing the concept of source evaluation. Demonstration the concept of source evaluation by using Eric Wilhelm Edholms s diary. Second time journey: child murder in court Christin accused for Second task: Assembling the court protocol. Third task: Answering questions about the court protocol from Christin s trial. Fourth time journey: The child painter studio. Fourth task: Answering questions about the painting from the child painter. 6.1 Interaction Design During our work we have tried to incorporate adequate interaction concepts to keep the navigation through the DTA intuitive and also to make the learning e ective. In Norman (2013), five fundamental principles of interaction are specified, and in our project we have placed a particular importance on complying to three of these; feedback, a ordances and signifiers. User feedback is an essential concept. As Watchers of History does not contain sound, we have been limited to provide visual feedback. In the timeline task, for instance, feedback is provided in the form of a green tick when the historical source hits the right place on the timeline, as shown in figure 1. We also provide user feedback when introducing the five questions for source validation. Here, we chose to highlight the question over which the user holds the mouse pointer, through giving the color of the text background a darker and stronger tone as shown in 2. At the same time, the correct answer, which can be found in the diary, is highlighted with green rings, also shown in 2. In this way we provide the user with a clear, direct and visible mapping between the question and the answer. Figure 2: Nauvo introducing the five questions used to validate a source, using the Eric Wilhelm Edholm s diary to demonstrate where the answer to these questions could be found. User feedback is provided by highlighting the question over which the user holds the mouse pointer. This is achieved through giving the color of the text background a darker and stronger tone. Also, the correct answer is highlighted with green rings. Two other of these five design principles are a ordance and signifiers (Norman, 2013). Clear a ordance makes the users aware of what actions are available to perform on an object. In Watchers of History, thishelpstheuser understand what he or she can do in a particular room or in a particular scene of the DTA. Signifiers, on the other hand, tells the user where to perform an action to make something happen. A ordance can be created by adding signifiers, which for example could be markers that tell the users where they can click for something to happen. 6.2 Limitations and Simplifications The limited ways of interaction in the InVision prototype prohibited us from incorporating some of the interaction concepts that are planned to be implemented in the final version of this DTA. In the timeline task, for instance, the user is supposed to place the historical sources on the timeline by dragging them, which is something that can 8
23 be achieved in the finished implementation, but not in our hi-fi prototype. Since InVision does not support dragging images around, we decided to use a clicking alternative in the prototype. Another simplification of the prototype, compared to the actual DTA, is due to the fact that a screen image has to be produced for every single possible combination of scenarios. To prototype the timeline feature, for instance, where a source placed on the timeline will stay there until all other images have been deployed, an unreasonable amount of screen would have to be produced. As the purpose of the prototype is to demonstrate the new character, the new content and interaction patterns, we reduced unnecessary work by only allowing one particular sequence when distributing the sources on the timeline. 6.3 Requirements Specification In the future, our project will be implemented in program code to be integrated with the other, already existing, modules of Watchers of History. Tofulfillthis task, the hi-fi and lo-fi prototypes alone will not be su - cient, due to two main reasons. First of all, only the first of our three sub modules has been translated into a hifi prototype, and secondly, the hi-fi prototype itself has limitations and simplifications, as previously explained. Thus, a requirements specification has been made to aid the programmer with implementation. The requirements specification for our module is provided in a separate document available upon request. Regrettably there was not enough time to include the third sub module in the specification and the lo-fi prototype will have to su ce. 7 Testing the Hi-Fi Prototype To evaluate our work, we conducted a user test with participants from our target group. The testing was done at a school in Helsingborg with a group of 11 students from the 6th grade. In this user test, the students went through all the steps in the first sub module (see above for specifications). They were observed while doing so, and were subsequently asked to fill out a survey to express their opinions of the DTA. 7.1 Method The 11 students from the 6th grade were equipped with an ipad each and were instructed to go through the hi-fi prototype. Three members from our project group observed them while they did so, and helped them if they were stuck or had problems using the system. Before they started going through the web application for our first sub module, they were told that they would be asked to answer some questions about it when they had finished. Since the students played through the prototype on ipads, and it was designed on a computer, there were some unforeseen problems due to it not being adjusted to use on an ipad. Firstly, the students were able to swipe left and right, which then led them to the wrong picture, since they would not be linked to the next picture according to where they clicked, but just the next picture in the order they were created for the prototype. We had to instruct them not to swipe, but to click to move on. The second problem was that the ipad marked all clickable options in blue, which looks like an error, and confused some of the children. However, when we explained that this was just because it was a prototype, they were able to move on. When they had played through the whole prototype they were given a survey to complete. To get rich feedback on the di culty level, the content, the magic book, Nauvo and our prototype as a whole, we had designed a short post-survey where the students could express their opinions. The survey consisted of eight questions with set answers where they were supposed to rate our new module and Nauvo on some di erent scales as well as comparing our module with a di erent module they tested the same day. For instance, to see whether Nauvo was perceived to be of one or another gender, we had the children check a box if they thought that Nauvo looked somewhat like a girl, very much like a girl and so on. We also wanted to check if the level was suitable for their age group, so we asked them to rate the tasks on a scale from too easy to too hard. In addition to the set questions, we added five open-ended questions where they could elaborate on their ratings and opinions, and lastly, we added two knowledge questions with multiple choice to test whether they had learned something from going through the module. To clarify which situations the questions were related to, we also added some screenshots from the module. Since our survey was designed for children, we kept the language simple and made sure the survey was not too long. We also used surveys formerly used by the Educational Technology Group to make sure the survey was suited for the age group. The following will discuss the results from the survey. 7.2 Results In the following section, the results from the post-survey will be reviewed Di culty Level of the Concepts When it comes to di culty level it is clear that the tasks were not di cult to understand, which is satisfying. 80 percent of the students rated the di culty level as moderate, and the remaining students rated it as not being di cult at all. When it comes to navigating the DTA and using the system, half of the students responded that it was not di cult and the rest thought it was moderately di - cult. Ideally, most of the students should have found the system easy to operate. The usability of the DTA is thus something that should be evaluated further, but this could also be related to the limitations of the web application prototype as noted above. The students were also asked to give their opinion on the amount of text. We feared that the dialogues contained too much text, but the outcome from this question is positive, since we found that all of the students thought that the amount of text was moderate The Magic Book In the survey, we also included a question about the magic book, but it seems as if this was not used as frequently as we thought it would be. 36 percent never used the book, 9
24 45 percent almost never used it and 18 percent used it a few times. This can be discussed in many di erent ways. One the one hand it can be good that the students were not finding di culties when trying to understand how to operate the system and solve the task. On the other hand those who didn t use the magic book missed a big part in learning since the book was designed not only to provide help when the students were stuck, but also to include Nauvo at di erent steps and provide motivation. The magic book should thus also be evaluated more thoroughly Nauvo When asking students what they thought of Nauvo s appearance the following results were obtained: 36 percent thought he looked mostly like a girl, 27 percent thought he could be both and the remaining 36 percent thought he looked more like a boy. These results are very satisfying and show that we have succeeded in making Nauvos appearance androgynous. In addition to asking for opinions on Nauvo s appearance, we asked whether the students liked Nauvo or not. More than 80 percent of the students had nice things to say about Nauvo. They thought that Nauvo was funny, good and kind. It was also appreciated that Nauvo knows so much about history. By this we can draw the conclusion that one of our main goals with Nauvo has been achieved, meaning that, we make the module more enjoyable by adding a friendly and funny character. The results suggests that Nauvo is engaging enough to make the user feel that he or she wants to interact with the character Things the survey did not evaluate but perhaps should have, is to ask more explicitly if the students were motivated by Nauvo to continue solving tasks and whether they thought he was providing support when they thought they needed it. These are the last main goals we defined before the development of the character (see section 2 above). We included a question about whether they would like to play more as a measure of motivation, as noted below, but we could perhaps have included an explicit question on motivation as well Overall Feedback It is essential for this DTA to be successful that students want to continue playing and learning, something we viewed as a measure of motivation. When asked if they would like to play more, 82 percent of the students replied yes, and only 9 percent replied that they did not want to. These results are satisfying since it means that the overall DTA is likeable and enjoyable, and that it is suitable for the age group. It turns out that the time journeys were the most enjoyable parts of the module, an opinion expressed by 55 percent of the students. 27 percent thought the tasks were the most likeable parts. This is indeed very satisfying, since a lot of time and e ort was put into creating these parts of the module. If the students find the time journeys and the tasks, the most enjoyable parts of the DTA, then we feel that we have succeeded quite well because these parts are the learnings parts. If a student finds learning enjoyable he or she will want to continue learning and then our goal is achieved - which is that the student will learn. This is also confirmed in our last question, where students were quizzed on what they had learned from the test module. 73 percent answered the first control question correctly, and 81 percent answered the second control question correctly. Students were also asked to give propositions for future improvements. These were; more journeys and tasks, sound instead of text (as a choosable feature), animation and other language possibilities. These ideas will be discussed under future directions. Last but not least, it was confirmed that 73 percent thought they had learned more about source criticism using our module compared with a di erent Watchers of History module tested by the Educational Technology Group the very same day. This is not surprising, since our module is specifically aimed at teaching source criticism, but the fact that it did just that let s us know that what we have achieved this goal well. 8 Future Directions We have come a long way in our process, and to aid the future development of our work we would like to conclude with some future directions. 8.1 Nauvo and the Magic Book When designing Nauvo, one of our goals was that Nauvo should be conceived as a peer, perhaps a little bit older, but about the same age as the students. This is something we have worked on clarifying, for instance by making Nauvo appear upside down or in other more goofy positions, but could be made even clearer in future developments of the character. One possibility could be to include some games where Nauvo plays with the student, as well as having Nauvo play hide-and-seek, so that they are always in the frame. Nauvo s home (the archive) could also be adjusted a bit to make it seem more childlike by putting some new and old toys in there in addition to the books and antiques. Another possibility would be to adjust the graphics a bit, and make Nauvo shorter and/or give Nauvo more of a childlike look with a shorter height and perhaps chubbier cheeks. We also want to make Nauvo a natural part of the other modules that have been made previously and/or will be created in the future. One way of doing this could be to have Nauvo in the frame whilst playing hide-andseek. As long as it is not done in a disturbing way, we believe this could enhance Nauvo s mischievous character and make the DTA more engaging. In addition, if the the magic book is implemented in the other modules, this would also assure Nauvo s presence throughout the DTA. When it comes to the magic book, it is also supposed to include dictionaries. We have started working on a dictionary of all the di cult words, but this work is only finished for the first sub module. This means that explanations of all the words and expressions underlined in the lo-fi prototype for the second and third module still needs to be written. To make it easier for the users to remember the new words, we have also discussed the possibility of having icons for some of the words, such as kalesch, and that these icons could be used in playing Memory with the 10
25 TA or with Nauvo as a fun and educational break after finishing a task. As the users embark on new journeys, they could, for instance, collect new words and icons as they go along. These icons would then appear under the tab called My words ( Mina ord ). 8.2 Applying Knowledge from the User Test As described above, we conducted a user test of the first sub module, and the results from this should also be considered in the future development of this DTA and Nauvo. For instance, a more thorough test of the magic book should be conducted, since there were not that many of the students in our study who actually used it. This could be done in a test where the book in some instances pops up automatically. Half of the students in the user test found that the system was di cult to operate. A main reason for this could quite likely be the limitations and simplifications of the hi-fi prototype itself. This means that many of the operational di culties would be solved in the final program implementation. However, it could also be important to focus on making the DTA even more intuitively understandable by further developing its interaction design. We also got useful information from the open-ended questions of our survey, where the students wrote some ideas for improvement. As we have already mentioned, sound and animation could make the DTA less text based and more appealing, and would make the DTA more suitable for students who have di culties with reading long texts. This could be an option one chooses in the di erent travels and tasks, so that students who prefer text can choose that, and students who prefer sound can choose that. Another interesting idea from the students is the idea of creating versions in di erent languages, which would give students a chance to train reading skills in other languages. This could be especially beneficial for students who have more than one mother tongue and/or Swedish as a second language, but who, due to lack of resources or lack of skilled personnel, are not provided with teaching material that lets them practice their language skills in the non-swedish mother tongue. Introducing sound, and perhaps even speech recognition, could indeed make the DTA a lot better suited for children with reading- and writing di culties, as well as children learning Swedish as a second language. However, introducing sound and animation is at this point limited by technical di culties. When it has been possible, we have tried to make the tasks less text dependent, for instance the timeline task, but when it comes to teaching source criticism it was not possible to include all the needed information without showing quite a lot of text. In the future, the DTA could perhaps include sound and animation, both to make it more appealing and fun, as well enabling the possibility of giving more information in a less text-dependent format. giving good feedback to students who are having di culties with the tasks. In the section about formative feedback, it was mentioned that DTAs are good tools for doing research on learning processes. The feedback we have designed in this DTA has di ering characteristics due to being related to tasks of di erent di culty and with di erent content. For instance, in the timeline task we only provide simple correction, whilst in later tasks we also provide hints, help questions, summary feedback in addition to mere corrections. This DTA could thus be used to conduct studies examining which types of feedback that works best for the di erent tasks, and which of the feedback strategies used are most beneficial for the students testing our DTA. 8.4 Implementation and Integration One of the main future activities related to this project is the program implementation phase, i.e. the translating of the hi-fi and lo-fi prototypes into code and the integration of this code with the already existing parts of Watchers of History. This will probably be made by a programmer from the Educational Technology Group. As stated, our hi-fi prototype has many technical limitations that will be solved in the implemented version of the module. This means that the final product will have increased functionality compared to the hi-fi prototype, as is thoroughly described in the requirements specification, which in turn hopefully will increase the overall user experience of our module. 9 Conclusion Over the course of this project, we have managed to create a new character with characteristics that we believe will make Watchers of History more appealing, more social, more motivating and more relatable for children using it. In addition, we have created a new module for introducing source criticism, which could be of great interest and use to teachers and schools. Even though functional source criticism has become an important part of the curriculum for elementary schools, there are still not many available resources for teaching it. The positive results from the user test gives us confidence that our new developments indeed can be applied in schools and enhance students learning and motivation. As described under future directions, there is however still room for improvement and we hope that future developers of Watchers of History will take note of these results and find them helpful. 8.3 Future Tests As noted in the section about the user test, very few of our participants actually used the magic book. The magic book should thus be tested more thoroughly, since we view the help functions in this book to be crucial for 11
26 References Alexander roslin John Jennings Esq., his Brother and Sister-in-Law oil on canvas. part of collection at swedish national museum. (1769). Andreas bureus, map over sweden. (1626). Bargh, J. A., & Schul, Y. (1980). On the cognitive benefits of teaching. Journal of Educational Psychology, 72 (5), 593. Biswas, G., Leelawong, K., Schwartz, D., Vye, N., & at Vanderbilt, T. T. A. G. (2005). Learning by teaching: A new agent paradigm for educational software. Applied Artificial Intelligence, 19 (3-4), Blair, K., Schwartz, D., Biswas, G., & Leelawong, K. (2007). Pedagogical agents for learning by teaching: Teachable agents. Educational Technology - Saddle Brook Then Englewood Cli s NJ, 47 (1), 56. Chase, C. C., Chin, D. B., Oppezzo, M. A., & Schwartz, D. L. (2009). Teachable agents and the protégé effect: Increasing the e ort towards learning. Journal of Science Education and Technology, 18 (4), Cutumisu, M., Blair, K. P., Chin, D. B., & Schwartz, D. L. (2015). Posterlet: A game-based assessment of children s choices to seek feedback and to revise. Journal of Learning Analytics, 2 (1), Gulz, A., Ahlner, F., & Haake, M. (2007). Visual femininity and masculinity in synthetic characters and patterns of a ect. In International conference on a ective computing and intelligent interaction (pp ). Gulz, A., & Haake, M. (2006). Design of animated pedagogical agents a look at their look. International Journal of Human-Computer Studies, 64 (4), Gulz, A., & Haake, M. (2010). Challenging gender stereotypes using virtual pedagogical characters. Gender Issues in Learning and Working with IT: Social Constructs and Cultural Contexts, Johnson, W. L., & Lester, J. C. (2016). Face-to-face interaction with pedagogical agents, twenty years later. International Journal of Artificial Intelligence in Education, 26 (1), Leelawong, K., & Biswas, G. (2008). Designing learning by teaching agents: The betty s brain system. International Journal of Artificial Intelligence in Education (IOS Press), 18 (3), 181. Mabanza, N., & de Wet, L. (2014). Determining the usability e ect of pedagogical interface agents on adult computer literacy training. In M. Ivanović & L. C. Jain (Eds.), E-learning paradigms and applications: Agent-based approach (p ). Springer Berlin Heidelberg. doi: \/978\-3\ -642\-41965\-2\ 6 Mannerheim, F. (2012). Att bedoma källanvandning. resurser-for-larande/kollakallan/ kallkritik/amne/so/so-amnen / kallanvandning (Accessed: ) Medeltidsmuseet, buckle boot for child, part of collection at medeltidsmuseet. ( ). stockholmskallan.stockholm.se/post/ (Accessed: ) Nordiska museet. ( ). year=0&query=mynt&to year=1000. (Accessed ) Norman, D. A. (2013). The design of everyday things: Revised and expanded edition. Basic Books. Shute, V. J. (2008). Focus on formative feedback. Review of Educational Research, 78 (1), Skolverket. (2016a). Att bedöma resonemang om källornas och informationens användbarhet - kommentarmaterial till kunskapskraven för årskurs 6 i biologi, historia, religionskunskap, svenska och svenska som andraspråk. Author. Skolverket. (2016b). Läroplan för grundskolan, förskoleklassen och fritidshemmet 2011 (Tredje upplagan ed.). Author. Terry, R. L., & Krantz, J. H. (1993). Dimensions of trait attributions associated with eyeglasses, men s facial hair, and women s hair length. Journal of Applied Social Psychology, 23 (21), Vallenbergastenen, runic stone located at lundagård in lund, sweden. (ca 1050). Wenglinsky, H. (1998). Does it compute? the relationship between educational technology and student achievement in mathematics. 12
27 En studie av framtidens virtuella klassrum Alexander Cobleigh, Clara Mauritzson, & Maja Rudling Att använda virtual reality (VR) i undervisningen är en möjlighet som blir mer och mer aktuell i och med att den nödvändiga utrustningen blir alltmer allmänt tillgänglig. Men precis hur VR ska användas för att maximalt stötta inlärningen är oklart. I denna rapport beskrivs utvecklingen av VR-miljöer för undervisning. Dels utvecklas en forksningsplattform för framtida studier av virtuella klassrum, och för möjliga studier av reella klassrum och hur olika klassrumsaspekter kan påverka inlärningen. I rapporten beskrivs också en studie som genomförs med hjälp av den utvecklade plattformen. Studien ämnar utforska hur placering i olika virtuella miljöer påverkar inlärning och minne av information i ett muntligt föredrag. Den ena miljön är konstruerad för att lika ett reellt klassrum, medan den andra miljön är skapad för att efterlikna den miljö som föredraget handlar om; glaciärer. Miljöerna, och därmed undervisningsmiljöerna, skiljer sig åt vad gäller omgivning samt visuell presentation av informationen (tvådimensionellt bildspel eller tredimensionella illustrationer av processer). Miljöerna testas på 20 deltaragare som randomiserat placeras i en av de två miljöerna under föredraget. Inlärningen testas med flera specifikt framtagna metoder. Resultaten visar på att deltagarna kommer ihåg mer av informationen i föredraget när de placeras i det vanliga klassrummet. Å andra sidan beskriver deltagarna i glaciärmiljön upplevelsen som generellt mer positiv och minnesvärd. Implikationerna av detta diskuteras. Vi föreslår att VR-miljöer bör används som komplement till vanlig undervisning, snarare än som ersättning. 1 Inledning Allt eftersom tekniken fortsätter att utvecklas och blir en större del av vår vardag är det viktigt att veta vilka aspekter av den som faktiskt gynnar oss och på vilket sätt. I detta projekt har vi haft två målsättningar inom ramen för virtuella miljöer i klassrum. Den första var att konstruera en forskningsplattform där virtual reality (VR) användes för att skapa nya former av experimentella förutsättningar. Genom att skapa ett virtuellt klassrum som liknar verkliga klassrum kan man studera olika aspekter av klassrumsmiljön och hur den påverkar inlärningen. I en virtuell miljö kan man kontrollera aspekter av miljön såsom bakgrundsbrus, ljussättning och hjälpmedel, men även aspekter av agenter i miljön såsom lärarens röstkvalitet, gest-användning eller beteende hos klasskamrater. Detta gör att experiment i en virtuell miljö kan ske på ett mer kontrollerat vis än i verkliga miljöer, men med större ekologisk validitet än i en laboratoriemiljö. Den andra målsättningen i vårt projekt var att utvärdera klassrumsmiljön och samtidigt studera hur VR kan vara till nytta i undervisningen. För att göra detta har vi jämfört vår klassrumsmiljö med en miljö som erbjuder möjlighet att uppleva undervisningsämnet mer direkt. Där vår klassrumsmiljö i så stor grad som möjligt efterliknar ett vanligt, icke-virtuellt klassrum, har vi i den andra miljön försökt dra ännu mer nytta av den virtuella tekniken och dess egenskaper. Virtuellt klassrum som forskningsplattform Lärare och klassrummet är en central scen för informationoch kunskapsförmedling i dagens skola. Det är lätt att se vikten av att studera aspekter av detta för att kunna förbättra undervisning och lärandemiljön för skolbarn. Samtidigt är det svårt att studera verkliga skolmiljöer på ett reliabelt sätt, då miljöerna är notoriskt svåra att kontrollera. Ett alternativ är att studera mindre aspekter av skolmiljön i kontrollerade experiment, och på så sätt separera variabler. Problemet med detta är den bristande ekologiska validiteten; kan vi verkligen säga att vi studerar aspekter av skolmiljön om vi helt separerar dem från varandra? VR kan ses som ytterligare ett verktyg i studier av skolmiljön, där miljömässiga aspekter kan konstrueras och kontrolleras men även kombineras. Upplevelsen blir mer naturlik än i rigida laboratoriemiljöer, och detta ökar den ekologiska validiteten (Ahn et al., 2011) Av den anledningen konstruerade vi en klassrumsmiljö där variabler såsom brus, klasskamrater och olika lärar-aspekter kan manipuleras och kontrolleras. Målet är att denna miljö även i framtiden ska kunna användas som forskningsplattform. Projektet fokuserade därför på dels att konstruera denna miljö, men också att utvärdera dess användbarhet i experiment. Virtuella miljöer i undervisningen VR används redan i dag i bland annat medicinsk och militär undervisning, för att stötta förståelse för processer. På universitetsnivå har det också använts för att simulera klassrum i onlinekurser, men även för att träna förmågor och förstå relevanta fenomen. I en betydligt mer begränsad utsträckning har det också använts i grundskolan (Ludlow, 2015). Fördelen med att använda VR i undervisningen är enligt Diaz, Hincapié, och Moreno (2015) att det uppmuntrar kinestetisk inlärning, stöttar eleverna genom att ge dem möjlighet att utforska 3d-modeller, skapar intresse och engagemang samt underlättar skapandet av kontextuell information. 1
28 Enligt Cognitive theory of multimedia learning (CTML) (Mayer, 2014) och Dual coding theory (Clark & Paivio, 1991) finns två parallella mentala modeller vid inlärning; en visuell och en auditiv. Dessa båda modeller organiserar ny och gammal, auditiv respektive visuell information. Det är först när dessa båda modeller integreras som djupare förståelse för ämnet samt bättre länkning till tidigare kunskap kan uppstå. Enligt CTML minskas mängden cognitive load genom integreringen, som också faciliterar inlagring i långtidsminnet. I enlighet med CTML tänkte vi att inlärningen i den ämnesspecifika miljön skulle kunna underlätta integrering av auditiv och visuell information för fördjupad förståelse. I VR kan vi efterlikna hörsel- och synintryck relativt detaljerat och ett virtuellt klassrum skulle därför kunna stötta skapandet av integrerade syn- och hörselmodeller i stil med dem som beskrivs i CTML. Tversky mfl. (Tversky, Morrison & Betrancourt, 2002) studerade hur animationer stöttar inlärning, och såg att statiska bilder stöttade inlärningen väl så bra. De teoretiserar att animationerna upptar för mycket cognitive load, eftersom de utgör transiell information och att arbetsminnet har för mycket temporala begränsningar. Å andra sidan såg Ayres och Paas (2007) att animationer kan stötta inlärning om de används på rätt sätt, och att de då kan stötta förståelsen för processer bättre än statiska bilder. Författarna menade att animationen då stöttade byggandet av mentala representationer. Enligt Carney och Levin (2002) är animationskvalitet och nivå av realism viktiga faktorer för inlärningsstöd. Höffler (2010) gjorde en meta-analys över studier av spatial förmåga och dess påverkan på inlärning med visualisering. Han kom fram till att spatial förmåga är viktig för byggandet av visualiseringar och att personer med bättre spatial förmåga hade lättare att lära sig av visualiseringsstöd. Han såg också att visualiseringar stöttar personer med sämre spatial förmåga att skapa visuella mentala representationer, och att 3d-visualisering tycks kunna stötta personer med låg spatial förmåga att bättre förstå processer. Höffler menar, tvärtemot Carney och Levin (2002), att det inte fanns några bevis för att hög nivå av realism behövdes (Höffler, 2010). Tidigare forskning ger alltså delvis spridda indikationer. Dels antyds att animationer snarare kan försvåra inlärningen genom att de upptar för mycket arbetsminneskapacitet, men också att de kan stötta integrationen mellan visuell och auditiv information, särskilt för personer med låg spatial förmåga. Det antyds att hög realism i 3d-visualiseringar är centralt, men samtidigt visar Höfflers meta-analys att det inte finns något tillräckligt stöd för det (Höffler, 2010). Det verkar som att olika typer av visualiseringar stöttar olika typer av inlärning. Fördelen med att använda ett virtuellt klassrum i studier av lärandemiljöer är som sagt att det är lätt att kontrollera och därför jämföra olika aspekter i miljön. I vår studie jämförde vi istället två miljöer, och det blir då betydligt svårare att konstruera ett kontrollerat experiment, eftersom så många olika aspekter skiljer sig åt och kan potentiellt påverka resultatet. Vår frågeställning var därför inte exakt vad i en lärandemiljö som påverkar inlärning, utan vi anammade en mer explorativ inställning till studien och ville istället se om, och hur, vi kunde utnyttja den virtuella miljön maximalt för att skapa känsla av närvaro och erfarenhet i en ämnesrelaterad miljö. I konstruktionen av våra virtuella miljöer övervägde vi föroch nackdelar med tredimensionella animationer kontra tvådimensionella bilder som inlärningsstöd. Då tidigare forskning inte gav ett tydligt svar på frågan, beslutade vis oss för att använda olika illustrationer i de två miljöerna. I klassrummet användes ett tvådimensionellt bildspel, på liknande sätt som man ofta gör i skolan i dag. I glaciärmiljön ville vi å andra sidan utnyttja den virtuella miljön mer fritt och beslutade oss därför för att använda tredimensionella illustrationer som visuellt stöd. För att ändå kunna jämföra miljöerna någorlunda beslutade vi oss för att illustrera samma aspekter av föredraget i de båda miljöerna, om än på olika sätt. Vi hade flera, mer eller mindre kvalitativa, mått för att utvärdera upplevelsen och inlärningen i miljöerna. Det mest kvantitativa måttet var ett test med innehållsfrågor på det föredrag som deltagarna fått höra i miljön. Vi hade ett moment där deltagarna fritt fick återberätta vad de lärt sig och kom ihåg av föredraget, som var både kvalitativt och delvis kvantitativt. Vi hade också en semistrukturerad intervju som framförallt fokuserade på upplevelsen av miljöerna, samt en mindre enkät med deskriptiv information om deltagarna och deras erfarenhet av VR. Motivet bakom att ha med fritt återberättande som testmoment var å ena sidan att i ett senare skede kunna använda det för att analysera beteendepåverkan av miljöerna. Om återberättandet transkriberas skulle till exempel språkanvändandet kunna analyseras för att se om deltagarna använde olika många ord eller olika typer av ord i berättandet. En annan, ännu viktigare, motivering till det fria återberättandet var att kunna bedöma deltagarnas inlärning och minne mer kvalitativt. Det skriftliga test vi konstruerat är likt så som test i skolor ofta konstrueras med fokus på detaljer och specifik faktakunskap. I fritt återberättande hoppas vi kunna fånga upp vad deltagarna själva fokuserat på och hur de väljer att beskriva det. En hypotes var att det formella, skriftliga testet skulle vara lättare för deltagarna som placerats i klassrummet, då det är typiskt för hur man är van vid att det går till i skolan och vardagen. Det var också möjligt att deltagarna i klassrummet skulle komma ihåg mer av informationen i både det muntliga 2
29 och skriftliga testet. Enligt bland annat Fox et al. (Fox, Bailenson, & Binney, 2009) kan detta ses som ett mått på hur engagerad deltagaren varit i själva miljön. De menar att ju mer engagerad man är i själva virtuella upplevelsen, desto mindre fokuserade är de på informationen de får höra, på grund av begränsad kognitiv kapacitet. Tvärtom vad man alltså skulle kunna tro så kan sämre resultat på kunskapsprov indikerar en mer engagerande upplevelse. Om detta stämmer tänkte vi oss att deltagarna i glaciärmiljön, som var mer intressant, ny och troligtvis mer engagerande än klassrumsmiljön, borde uppvisa sämre resultat på både det skriftliga och muntliga testet. 2 Metod Beslutsprocess Riktlinjerna initialt för projektet var att skapa ett VR-klassrum för kontrollerade studier av verklighetens kaotiska lärmiljöer. Obligatoriska aspekter var en virtuell lärare, ett klassrum och någonting som läraren lär ut. Utifrån dessa riktlinjer beslutade vi oss för att fokusera på hur kunskapsinlärning kan skilja sig åt beroende på vilken miljö en elev befinner sig i. Inlärning är ett brett begrepp och i början av processen stod vi inför flera vägval. Vi beslutade tidigt att vi ville jämföra två olika miljöer; ett vanligt klassrum och en mer ämnesspecifik miljö. Vi hade flera idéer, som att skapa en miljö inne i ett öga för att förklara hur synintryck processas, att förklara hur celler eller atomer är uppbyggda eller att skapa en miljö under havet eller i rymden. Brainstorming är en klassisk metod att använda för att komma fram till nya idéer eller lösningar. Genom att skriva upp alla idéer på en stor tavla och diskutera för och nackdelar beslöt vi oss för att det var glaciärer som skulle vara vårt huvudämne. Vi baserade beslutet dels på vad vi själva ville konstruera för virtuell miljö, men framförallt på att det skulle vara ett ämne som vi tror testdeltagarna inte skulle ha mycket tidigare erfarenhet av. Detta var viktigt för att minska risken att tidigare kunskaper skulle påverka inlärningen i de olika miljöerna. Vi valde att skapa ett föredrag med relativt basal faktakunskap om glaciärer, utan behov av att förstå mer avancerade processer. Det vi ville studera var hur placeringen i olika virtuella miljöer med dess olika förutsättning påverkar inlärningen och minnet av faktakunskap och valde därför att hålla förutsättningarna relativt enkla. Val av miljö I början av vår process, innan vi hade bestämt temat glaciärer funderade vi på att använda oss utav läsförståelsedelen av svenska högskoleprov som grund för den information läraren skulle prata om, och för att kunna använda oss utav de frågor som högskoleprovet har tillhörande. Tanken med detta var att högskoleprovet är ett kunskapstest om ämnen som elever vanligtvis inte har tidigare expertis inom. På så vis skulle vi kunna minska risken för att välja ett ämne som vissa deltagare har mer kunskap om än andra. Efter att ha tittat runt på olika högskoleprov kom vi dock fram till att detta skulle bli ganska begränsande. Det hade varit svårt att skapa en miljö som handlar om dessa specifika ämnen. Ett exempel var ett prov som handlade om skalbaggar, och det blev problematiskt att skapa 3d-effekter tillhörande detta ämne då det inte är miljön detta prov handlar om utan en liten komponent tagen ur miljön. Högskoleprovet begränsade oss även i den mån att den är i strikt skriftspråksformat - ämnad att läsas av elever. Vi behövde information som skulle fungera bra för uppläsning där eleverna får höra informationen mer talspråks-likt. Genom att vi valde ett eget ämne, glaciärer, kunde vi få båda de komponenter vi behövde. Ett ämne som troligtvis inte många elever har tidigare expertis inom, samt ett ämne där miljön är enkel men går att förändra med många 3d-effekter. När vi själva tog fram information om glaciärer samt skrev egna frågor gällande dem, kunde vi således formulera oss på ett sätt som lämpade sig bättre för uppläsning än vad högskoleprovets innehåll kunde erbjuda. Förutsättningar beroende på miljö Före och under uppbyggnaden av våra två olika miljöer brottades vi med två olika lösningar för hur miljöerna skulle byggas upp. Den ena tanken var att bygga två olika miljöer med precis samma förutsättningar. Det vill säga att skolmiljön skulle ha en muntlig presentation som kompletterades av en bildpresentation (i form av ett klassiskt bildspel) där läraren presenterar information om glaciärer. Glaciärmiljön skulle då på precis samma sätt ha en lärare som presenterar information med en likadan tvådimensionell visuell presentation som bildspelet. Fördelen med detta upplägg hade varit att vi på ett mer kontrollerat sätt kunnat studera endast miljöns påverkan på inlärningen, då eleverna får samma information oberoende av vilken miljö de befinner sig i. Vi hade alltså minskat risken för störfaktorer (confounders), såsom olika inlärning beroende på två- eller tredimensionella illustrationer eller olika mängd visuellt stöd. Nackdelen med detta upplägg hade dock varit att man inte till fullo utnyttjat de aspekter och egenskaper som är inneboende hos en virtuell miljö, effekter som skulle kunnat vara ett hjälpmedel för eleverna för att ta in information. Vår andra tanke gällande uppbyggnaden av miljöerna var därför att skapa olika förutsättningar beroende på vilken miljö eleven befinner sig i. Klassrummet skulle även i denna version innehålla en lärare som presenterar information med tvådimensionellt visuellt bildstöd. På glaciären, däremot, skulle man kunna göra den virtuella miljön så avancerad som möjligt och verkligen utnyttja den teknik som finns till hands. Istället för en tvådimensionell bildpresentation på glaciären 3

30 tänkte vi oss tredimensionella illustrationer av det som läraren berättar presentationen. Fördelen med detta skulle vara att man med hjälp utav dessa illustrationer skulle kunna förtydliga information visuellt för eleven. På så sätt skulle vi försöka att maximalt utnyttja de förutsättningar som en virtuell miljö kunde erbjuda oss. Nackdelen med detta upplägg var dock att det blir svårare att utvärdera miljöernas påverkan på inlärning, då förutsättningarna förändras för eleverna på flera sätt. En annan eventuell nackdel knyter an till Tversky m.fl studie (2002) som visar att tredimensionella illustrationer snarare belastar arbetsminnet än stöttar inlärningen. På så sätt vet vi alltså inte om den ämnesrelaterade miljön faktiskt skulle facilitera inlärning; det hade också kunnat leda till ökade distraktioner. Trots dessa nackdelar beslutade vi oss för det andra alternativet, med fler skillnader mellan klassrummet och glaciären än bara miljön, och därmed för en mer explorativ studie. Inom ramen för projektet blev det rimligare, då vi dels skulle få möjlighet att skapa mer engagerande virtuella miljöer samt att det ändå hade varit svårt att få miljöerna och skillnaderna så pass kontrollerade att vi i slutändan hade kunnat avgöra vad som påverkade en möjlig skillnad i inlärning mellan grupperna. Miljöerna vi skapat var olika vad gäller mängden distraktorer, bakgrundsljud, ljussättning, hur naturlig lärarens roll kändes, samt hur informationen presenterades. Med detta upplägg fick vi alltså mer som skiljde sig åt och kunde kanske bättre studera virtuella klassrum i sin fulla potential, men vi kunde i slutändan inte veta exakt vad som lett till en eventuell skillnad i inlärning. Vi har istället en chans att skapa ett alternativt sätt för inlärning och att testa om detta skulle kunna fungera som ett hjälpmedel för elever och lärare. datorplats med tillhörande MHD (Head-mounted display, VRutrustningen) vilken användes för att ta del av den virtuella miljön, liksom en vägg med envägsspegel, vilket lät oss iaktta deltagaren under de olika delarna av testet. Den HMD som användes i denna studie var konsumentversionen av Oculus Rift (releasedatum 28 mars 2016). De tillhörande handkontrollerna, Oculus Touch, användes ej. Den virtuella miljön var tvåfaldig; testet gick ut på att mäta skillnader i inlärning beroende på vilken av de två miljöerna en testdeltagare befann sig i när de fick lyssna på ett föredrag. Den ena virtuella miljön var ett traditionellt klassrum med bänkar, stolar och bildspel medan den andra var en alternativ miljö, där vi försökt att använda oss av den virtuella tekniken och dess inneboende egenskaper så gott vi kunnat, inom den tidsram vi hade att utveckla den. Bägge virtuella miljöer var uppbyggda i spelmotorn Unita. Skillnaderna mellan miljöerna begränsades genom att använda samma inspelade föredrag i båda scenerna, samt illustrera samma delar av föredragen visuellt om än på olika sätt. Klassrummet Prototyp De virtuella testmiljöerna utgjorde tillsammans en prototyp av en forskningsplattform som kan användas för att utföra olika vetenskapliga experiment i en kontrollerad virtuell miljö som är fri från oönskade distraktioner. Den utvecklades med start i början av september och blev helt färdigställd i slutet av november. Prototypen bestod av två olika virtuella miljöer som var utvecklade parallellt, med ett gemensamt syfte att undersöka inlärning av fakta i olika virtuella miljöer. Testmiljö & utrustning Testningen tog plats i två olika miljöer: en reell och en virtuell. Den reella miljön var den fysiska lokal där testandet utfördes, i vår studie var detta Användbarhets-labbet på Designcentrum i Lund. Testutrustningen bestod av ett bord där intervjuer, skriftliga och muntliga, utfördes både före och efter att deltagaren varit i den virtuella miljön. Det fanns även en Figur 1. Den traditionella klassrumsmiljön Klassrummet var utformat för att spegla den typ av inlärningsmiljö som deltagare känner igen från tidigare utbildning. Det fanns en tavla längst fram i klassrummet, vilket rader med bänkar och stolar var riktade mot. På tavlan såg man ett bildspel som är synkad till den inspelade föreläsningen om glaciärer, som läraren bredvid tavlan ser ut att hålla. Klassrummet innehöll även distraktionsobjekt som deltagaren kunde fästa blicken på: tavlor, böcker på bänkarna samt andra statiska objekt. Väggen till vänster, sett från deltagaren som var placerad i en utav bänkraderna, var fylld med fönster, medan den motsatta väggen hade ett par dörrar. Genom en av dessa trädde läraren in, efter en fördröjning på ca 5 sekunder från att miljön startats. Fördröjningen valdes för att ge deltagaren tillräckligt med tid för att kunna ta in 4

31 klassrummet som en virtuell och ny miljö, och på så vis göra dem bekanta nog för att kunna fokusera på innehållet av föredraget. Tiden för fördröjningen var arbiträr, och kan relativt enkelt förändras om miljön ska användas för annat syfte. Klassrummet som miljö är väldigt statisk, de dynamiska element som finns är bildspelet som ändras i takt till att föreläsningen fortgår samt läraren. Läraren är en enkel 3dmodell med en uppsättning animationer som den loopar tills föreläsningen är över. Glaciären Figur 2. En skärmdump på glaciärmiljön Den andra miljön var en vision av hur ett klassrum skulle kunna se ut och bete sig om den var utformad specifikt för VR. Deltagaren stod på en abstrakt plattform, placerad i mitten av en glaciärliknande miljö. Längre fram på samma plattform står läraren, som, liksom i klassrummet, kom gående in i miljön efter en lika lång fördröjning. Även här fanns fördröjningen för att ge deltagaren möjlighet att utforska den virtuella miljön med blicken innan själva föredraget sattes igång. Istället för klassrummets fortlöpande bildspel fanns tredimensionella modeller och ljud som aktiveras beroende på vilken del av föreläsningen som behandlas. Som ett exempel: när föreläsningen berättar att havsnivån skulle stiga med 70 meter om all glaciäris smälte, så skapade vi en animering där det ser ut som att det omkringliggande vattnet i den virtuella miljön höjs avsevärt, samtidigt som ett porlande ljud spelades upp, för att vidare ge intrycket av rinnande vatten. I glaciärmiljön har vi 7 olika sådana moment med tillhörande animationer, modeller och ljud. Föredrag och lärare Lärarens roll i miljöerna är att förmedla informationen till testdeltagaren. För att få inlärningssituationen mer skolmiljölik valde vi att använda en virtuell agent. För att skapa en virtuell lärare har vi använt oss av programmet Autodesk CharacterGenerator vilket är en mjukvara som hjälper användare att skapa 3d-modeller utav olika karaktärer, i vårt fall en 3d-modell av en lärare. Inledningsvis skapade vi ett föredrag med fakta om glaciärer baserat på två hemsidor ( Föredraget innehöll en mängd ren fakta som radades upp, men på ett sätt som skulle vara någorlunda trevligt att lyssna på och samtidigt likt ett föredrag på till exempel högstadienivå. Föredraget är uppläst från text, men texten är konstruerad på ett relativt talspråkslikt sätt för att underlätta lyssnandet. Samtidigt som föredraget skrevs konstruerade vi innehållsfrågor för att kunna utvärdera hur mycket av föredraget som uppfattats och lagrats i minnet en kort tid efter. En basal form av pilottestning genomfördes genom att fördraget lästes upp för tre personer som sedan fick svara på frågorna muntligt. Deltagarna var två ur gruppen samt en bekant. Det var två kvinnor och en man och åldern på deltagarna var 27, 24 och 23 år. Ingen av deltagarna hade någon särskild tidigare kunskap kring glaciärer. Detta preliminära pilot-test visade att föredraget var på en sådan svårighetsgrad att mellan 50-75% av frågorna kunde besvaras korrekt. Detta tyckte vi var en lagom nivå för att undvika takrespektive golveffekter. För att skapa lärarens röst fick vi tillgång till det ekofria inspelningsrum på Humanistlaboratoriet i Lund. Vi ville spela in rösten i en bra kvalité utan något brus. En av gruppdeltagarna fick läsa upp lärarens röst. För att göra läraren mer realistisk fick vi hjälp utav Magnus Haake som, med hjälp av face-fx, kunde koppla ljudfilerna till läraranimationen för att ge henne en mer realistisk ansiktsoch- läppsynkronisering utav ljudet. Ett alternativ till detta skulle ha varit att konstruera en motion-capturemodellen med verkliga gester baserade på exempelvis gruppmedlemmen som läste in lärarrösten. Vi tog tidigt beslut om att detta inte var nödvändigt för vår frågeställning, då lärarens roll egentligen inte är det centrala i studien. För att få motioncapturemodellen välgjord skulle mycket resurser behöva fokuseras på det, och vi valde därför att använda mer generiska kroppsrörelser och ansikts-synkronisering genom face-fx. Experimentet För att undersöka skillnaden av inlärning i de två olika virtuella miljöerna rekryterades 20 testpersoner. Dessa testpersoner rekryterades genom att direkt tillfråga bekanta. Bland dessa 20 testpersoner slumpades var och en utav dem ut 5
.")
 Usability Lab där hen ostört kunde koncentrera sig på föreläsningen i den virtuella miljön.")

32 till att prova på en utav de två virtuella miljöerna, sammanlagt 10 personer på varje VR-plattform. Testpersonerna fick först fylla i en enkät om deras tidigare erfarenhet utav glaciärer, användning av VR samt kön, ålder och högsta utbildning (Se bilaga A). Dessa frågor valdes ut för att kunna avgöra om eventuella gruppskillnader i resultatet, skulle kunna anses bero på exempelvis skillnader i erfarenhet utav VR och att befinna sig i virtuella miljöer. Under testningen fick testdeltagaren sitta i ett avskärmat rum i IKDC (Ingvar Kamprad Designcentrum) Usability Lab där hen ostört kunde koncentrera sig på föreläsningen i den virtuella miljön. Föreläsningen i den virtuella miljön varade i cirka tre minuter. Därefter testades deltagarna med tre moment under ljudinspelning; fritt återberättande, skriftligt prov och semistrukturerad intervju. Genom ljudinspelningen säkrades det att den information testdeltagaren delade med sig av kunde tolkas även i efterhand. Det första momentet innebar att deltagaren ombads att med egna ord fritt återberätta så mycket hen kom ihåg från den virtuella miljön samt informationen från föreläsaren, vilket vi antecknade och dokumenterade under tiden. Genom det fria återberättandet skulle testdeltagaren inte bli påverkad utav ledord från frågor och testledare, utan fick återberätta det hen mindes från den virtuella miljön. Denna fria återberättning hade sedan stor betydelse för det sammansatta resultatet av testningen. Det andra momentet innebar att deltagaren fick ett skriftligt kunskapstest baserat på informationen från föreläsningen. Testet bestod av sju olika frågor varav fyra utav frågorna hade flervalssvar och tre skulle besvaras med kort skriftligt svar.(se bilaga B) De första fyra frågorna var rena faktafrågor som testade om deltagaren hade uppfattat rätt siffror och svar. De tre sista frågorna kunde testdeltagaren svara mer fritt på, men dessa krävde att testdeltagare förstått konceptet kring processerna och inte bara kunde gissa sig fram till rätt svar. Det sista momentet bestod utav en semistrukturerad intervju där testdeltagaren fick svara på sex olika intervjufrågor. (Se bilaga C) Genom att använda sig utav den semistrukturerade intervjun öppnade det upp för att kunna ställa följdfrågor på det testpersonen svarat och på så sätt kunde man få ut mer av testpersonens tankar kring testet. Genom att kunna ställa allmänna följdfrågor ledde intervjun även till en diskussion mellan testdeltagare och testledare. Tankar som användaren inte tänkt på, eller perspektiv vi som testutformare inte förutsett, kan lättare komma fram när det inte känns lika formellt som en strukturerad intervju. 3 Resultat Kvantitativ data Figur 3. Könsfördelning i glaciärmiljön Figur 4. Tidigare erfarenhet av VR i glaciärmiljön Hälften av deltagarna som fick prova på den virtuella miljön på glaciären var kvinnor och hälften var män. Det var även jämnt fördelat mellan deltagarna gällande antalet som hade provat på någon from av VR tidigare (Oculus Rift, HTC Vive). Medelåldern på testdeltagarna som tilldelades glaciärmiljön var 24. Figur 5. Könsfördelning i klassrumsmiljön Figur 6. Tidigare erfarenhet av VR i klassrumsmiljön 6

33 I den virtuella miljön i klassrummet var det en större andel män än kvinnor som testade, sju män och tre kvinnor. Det skiljde sig även på antalet som tidigare provat på någon from av VR, där 70% gjort det tidigare. Liksom i glaciärgruppen var medelåldern 24 år. För att kvantifiera hur mycket en deltagare fick med i det fria återberättandet skapades en mall där föredraget var uppdelat i 38 påstående(se bilaga D). Om deltagaren nämnde något av påståendena när hen återberättade information gavs ett poäng. Medelvärdet kan ses nedan: Virtuell miljö Medelvärde (poäng) Klassrum 7,2 Glaciär 4,7 Tabell 1. Medelvärde av poängfördelningen mellan de båda grupperna (glaciär eller klassrum) i det fria återberättandet De påståenden som hade störst skillnad i antal svar mellan de båda tillstånden (glaciär och klassrum) kan ses i figur 7. Endast de påstående med en skillnad på minst 2 svarsandelar har tagits med, vilket var sant för 12 utav de 38 påståenden. En stapel med höjd två innebär en skillnad på två personer som har angett påståendet. Den första stapeln i diagrammet visar 2 svarsandelar till klassrumsgruppens fördel, detta innebär att det är två fler i klassrumsmiljön än i glaciärmiljön, som nämnt Påstående 1 De bildas av snö som fallit under flera år under det fria återberättandet. Den största skillnaden kan ses på det 11:e påståendet Rekordet håller ändå Kutiah glaciären i Pakistan. Figur 7. Sammanställning av data från den semistrukturerade intervjun Påstående från vänster: Påstående 1: De bildas av snö som fallit under flera år. Påstående 2: Blå snö som packats till tjocka ismassor. Påstående 3: Det som gör ismassorna till glaciärer är att de kan flytta på sig. (Påstående 9) 30% av havsytan (under istiden). Påstående 15: Mellansteget mellan snö och glaciäris kallas firn. Påstående 16 Det är en typ av hårt packad snö som beter sig som en mellanform mellan snö och is. Påstående 21: Iskristallerna kan bli lika stora som en tennisboll. Påstående 28: Undersidan av glaciären rör sig långsammare. Påstående 32: I perioder kan glaciärer få ett ryck och förflyttas betydligt snabbare än vanligt. Påstående 34: Efter bara två månader hade den stängt av flödet i Russell-fjorden och skapat en uppdämmad sjö. Påstående 35: Rekordet håller ändå Kutiah glaciären i Pakistan. Påstående 36: Under 1953 flyttade den sig mer än 12 kilometer på tre månader, med en snitthastighet på 112 meter per dag. Kvalitativ data Under den semistrukturerade intervjun fick alla testdeltagare svara på sex frågor rörande föreläsningen och upplevelsen av den virtuella miljön. De sex frågorna som ställdes var: 1. Var det svårt eller lätt? 2. Var det något av det du fick höra som förvånade dig? 3. Tycker du att du har lärt dig något nytt? 4. Det här med att vattnet kan stiga så mycket som 70 meter, vad tänkte du om det? 5. Något särskilt du tänkte på? 6. Var det något som irriterade dig? När vi sammanställde enkäterna kunde man se en tydlig skillnad mellan testdeltagarna som deltagit i klassrummet gentemot deltagarna på glaciären. På första frågan Var det svårt eller lätt svarade samtliga tio personer i glaciärgruppen att det var medel eller svårt gentemot testdeltagarna i klassrummet som samtliga svarade medel eller lätt. Deltagarna i glaciärengruppen hade en gemensam nämnare att de upplevde situationen som väldigt rolig och att man kom ihåg föreläsningen i bilder väldigt bra, men däremot var det svårare att komma ihåg den faktiska faktan som läraren berättade. Tvärtemot svarade testdeltagarna i klassrummet att de tyckte att det var ganska lätt, eftersom det inte skiljde sig mycket från en vanlig föreläsning något som testdeltagarna hade stor vana av att gå på. På den andra frågan var det något av det du fick höra som förvånade dig? så var Att glaciärer kan flytta på sig så snabbt ett dominerande svar utifrån båda testgrupper. På den tredje frågan Tycker du att du har lärt dig 7
34 något nytt var det en stor varians på alla testdeltagarnas svar oberoende av grupp, och vi kunde med andra ord inte se något mönster i deltagarnas svar på frågan. På fjärde frågan Det här med att vattnet kan stiga så mycket om 10 meter, vad tänkte du om det var det dominerande svaret både i klassrumsmiljön samt glaciärmiljön att det var väldigt mycket, läskigt och sjukt, med andra ord var det inte betydande för frågan i vilken miljö testpersonen befunnit sig i. Beroende på vilken miljö testdeltagarna befunnit sig i var svaren mycket varierande på den femte frågan Något särskilt du tänkte på?. Testpersonerna som befunnit sig på glaciärmiljön svarade övergripande att de tyckte det var en väldigt rolig samt cool upplevelse och benämnde upplevelsen som uppskattad. Testpersonerna i klassrummet däremot berättade mer om vad de tyckte var irriterande under redovisningen och vad som störde dem. Deras svar gick mycket ihop med sista frågan Var det något som irriterade dig där de främst nämnde att de tyckte det var irriterande att läraren gungade lite fram och tillbaka och att det fanns ett bakgrundsljud som var irriterande. Det som främst irriterade testdeltagarna i glaciärmiljön var att läraren inte var centrerad framför dem utan att hon stod lite snett vid sidan av och att det då var lätt att missa de effekter som kom upp. 4 Diskussion Det var väldigt enkelt att utföra testen när utvecklingen av plattformen var klar. Under testningen av de 20 deltagarna kom i stort sett inga komplikationer fram. För test och vetenskapliga experiment av denna karaktär är det svårt att få en miljö som är mer kontrollerad och fri från utomstående distraktioner än en miljö i VR. Vårt upplägg med begränsad interaktivitet, i princip tillät vi bara huvudrörelser och dessa påverkar inte något förutom vilken riktning deltagaren kollar, innebar att det behövdes väldigt få instruktioner om hur miljön fungerade. Ett test med mer interaktivitet behöver troligen en längre handledning och att mer utvecklingstid går åt till att göra testmiljön så intuitiv som möjligt för att säkerställa att det som testas inte överskuggas av ett komplext och främmande kontrollschema. Å andra sidan gör denna begränsande interaktivitet att den virtuella miljön kan upplevas begränsad och att deltagaren själv inte kan påverka den. I vissa typer av lärande kan interaktiviteten i sig kanske vara en styrka. I vårt testupplägg hade vi minimerat behovet av interaktivitet, genom att deltagaren bara passivt skulle lyssna på ett föredrag. Vi gjorde en jämförelse mellan testdeltagarna i klassrumsmiljön och testdeltagarna i glaciärmiljön vad gäller den semistrukturerade intervjun. Deltagarna som befunnit sig i glaciärmiljön var huvudsakligen positiva och pratade om vilken häftig upplevelse det varit. Det var även en majoritet som nämnde att de kom ihåg hela filmen (föredraget) framför sig med alla 3d-effekter, men att de har svårt för att återge den exakta informationen som 3d-effekterna handlade om. Två utdragna kommentarer från två olika testdeltagare var kommer ihåg saker som visades tydligt med bilder, svårare att komma ihåg exakta ord då det hände så mycket grejer samt kommer ihåg filmen tydligt men inte informationen. Vi kunde även göra en notering under testdeltagarnas återberättande att de pratade mycket om vad de hade sett i miljön, men inte nämnde så mycket om föredraget. En av testdeltagarna sa även Lyssnade inte så noga roligare att kolla runt. Testdeltagarna som vistas i klassrumsmiljön tyckte generellt att det var ganska lätt att svara på frågor i efterhand och kommenterade saker som Det var ganska lätt - vi sitter på föreläsningar hela tiden och Det var inte svårare än vanligt, som vanlig lektion. Deltagarna som placerades i klassrumsmiljön hade också ett bättre poängsnitt på kunskapstestet än deltagarna som vistats i glaciärmiljön. Vad gäller både deltagarnas egna upplevelse såväl som deras faktiska resultat på kunskapstesten antyds alltså här att glaciärmiljön är en häftig upplevelse, men att det är i klassmiljön som det är lättast att ta till sig den faktiska upplästa faktan. I båda miljöerna hade vi ett bakgrundsljud inlagt. Klassrummet hade mumlande röster medan glaciären hade ett blåsande ljud. Från de semistrukturerade intervjuerna noterades dock att det endast var personer som befunnit sig i klassrumsmiljön som lagt märke till detta ljud på ett störande sätt, fyra av tio personer nämnde detta i klassrumsmiljön gentemot noll av tio på glaciären. Kanske kan detta bero på att personer i klassrumsmiljön är vana vid att det generellt sett ska vara tyst under en föreläsning och att de därför irriterade sig på ljudet. Testdeltagarna i glaciärmiljön hade inga tidigare erfarenheter om hur en presentation där ska framföras och hade kanske därför en högre tolerans till omkringliggande ljud. En alternativ förklaring skulle kunna vara att deltagarna i klassrummet lyssnade noggrannare på vad som sades i föredraget, medan de på glaciären mer försökte förstå animationerna och uppleva miljön. Kanske upplevs då ljudet mer som ett störmoment än en del av miljön. Innan vi utförde våra tester på hade vi en uppfattning att glaciärmiljön skulle verka positivt för inlärning av information. Vi trodde att de visuella 3d-objekten skulle stödja inlärningsförmågan och bidra till att personerna lättare skulle komma ihåg informationen. Vi tänkte också att glaciärmiljön skulle uppfattas som roligare, och att ett ökat engagemang från deltagaren skulle kunna leda till faciliterad inlärning. Efter en sammanställning av resultaten kan vi dock se att samtliga kunskapsmått har fått ett bättre utfall för klassrumsmiljön. Det finns flera möjliga förklaringar till detta. Precis som många 8
35 testdeltagare i glaciärmiljön berättade under den semistrukturerade intervjun, så tyckte de att det var en väldigt rolig och cool upplevelse, kanske kan detta ha blivit ett distraktionsmoment som försvårat för dem att kunna ta till sig den teoretiska informationen som presenterades auditivt och att uppmärksamheten istället riktats åt att kolla runt i miljön. I I resultatdelen kan man se att deltagare som befann sig i klassrumsmiljön hade en bättre återberättningsförmåga och fick ett högre medelvärde på antal återberättandepoäng. 11 av 12 av de påståenden som hade störst skillnad i svarsandelar var till fördel för klassrummet. En annan anledning kan också vara att det handlar om en vanesak att befinna sig i en virtuell miljö med 3d-objekt. Deltagargruppen var alla universitetsstudenter med vana av att sitta och lyssna på en presentation framförd av en lärare med bildspel. Detta är en paradigm som mer eller mindre följts sen antiken (dock utan bildspel på den tiden), det kan därför vara svårt att ta till sig ett nytt sätt att lära sig på än den miljö som för dagens studenter känns naturlig att lära sig i. Elever vet om att när de sitter i ett klassrum så ska de få lära sig saker. Att stå ute på en glaciär och ta del av information är, för de allra flesta studenterna, något nytt. Kanske blir det inte en lika naturlig koppling till att man är där för att ta del av teoretisk information. Istället riktar sig uppmärksamheten till att kolla runt på alla objekt och vad mer som kommer att ske. I en studie gjord av Sun Joo Ahn (2011) vid Stanford University, undersöktes hur immersion (inlevelse i den virtuella miljön) och self-efficacy (tron på att individens egna handlingar har en påverkan inom ett snävt definierat område) kan påverka en persons perspektivtagande i en virtuell miljö, samt vad det är i VR-miljöerna som påverkar en persons beteende. I denna studie framkommer att en starkare, dvs högre simuleringsgrad av detaljer, upplevelse i en VR-miljö kan leda till att man får en sämre återkallningsförmåga. Detta är något som vi kan dra en koppling till i vårt egna projekt. I klassrumsmiljön, som inte har lika hög detaljrikedom som glaciären, har testdeltagarna fått ett bättre testresultat. I glaciärmiljön blir man däremot försedd med en högre detaljrikedom av simuleringen vilket kan ses som en starkare upplevelse, och vilket också återspeglar sig i att testdeltagarna haft sämre återkallningsförmåga av faktan. Kanske har för få testpersoner deltagit i denna undersökning för att vi ska kunna få ut ett tillförlitligt resultat, men det är ändå intressant att se att vår undersökning går åt samma resultat som studien på Stanford. Vad detta skulle kunna antyda inför framtiden Medan våra resultat pekar på att testdeltagarna i klassrummet presterade bättre gällande återkallande av fakta, så rapporterade testdeltagarna som var på glaciären att de hade väldigt roligt samt att de kom ihåg föreläsningen i bilder väldigt bra, men att det var svårare att komma ihåg den faktiska faktan som berättades. Detta är en intressant skillnad - den ena miljön tycks bättre för att lära ut fakta medan den andra är roligare att befinna sig i. Man skulle kunna tänka sig en prototyp som försöker förena de två tillvägagångssätten, en fas med mer interaktivitet och simulerade detaljer när faktan inte spelar särskilt stor roll för att sedan byta till en slags virtuell isolationskammare när faktan presenteras. Kanske kan man rentav varva de olika momenten, isolationskammare först, därefter simulerad värld där kunskapen används, följt av en isolationskammare igen och så vidare. Detta upplägg varierar den kognitiva bördan och även intresset hos deltagaren. Beroende på vad det är en person ska lära sig kan det kanske även skilja sig åt för hur mycket VR som är givande att använda för att påverka inlärningsförmågan positivt. När återkallande av fakta har stor vikt är det bättre att reducera mängden simuleringsdetaljer enligt Ahns studier (2011), medan när det kommer till lärande kring processer, likt det militären och sjukvården använt VR till, kan det vara lämpligare att öka på simuleringen så att situationerna är så pass realistiska att kunskapen kan föras över till det verkliga livet och dess situationella mångfald. I enlighet med Diaz, Hinacapié och Moreno (2015) så kan vi från vårt resultat se att de testpersoner som vistats på glaciärmiljön hade ett större intresse och engagemang för lärarens föredrag, men i takt med detta så försvann även deras fokus på informationen de fick ta del av i utbyte mot att de fokuserade mer på miljön. Detta kan liknas med Fox et al. (Fox, Bailenson, & Binney, 2009) som menar just på att ju mer engagerad man är i själva virtuella upplevelsen, desto mindre fokuserade är de på informationen de får höra, på grund av vår inneboende begränsade kognitiva kapacitet. Enligt David A. Kolbs Learning cycle menar Kolb att en effektiv inlärning kan ses som att en person går igenom fyra olika stadier (McLeod, 2010). Det första stadiet innebär att en person får en konkret erfarenhet. Denna erfarenhet kommer personen att observera och reflektera över, vilket leder vidare till bildandet av analys och slutsats. Slutligen kommer detta att användas för att testa hypotesen i framtida situationer, något som resulterar i nya upplevelser. Då vi i vår studie såg tecken på att faktakunskap lättare lärs in i den vanliga klassrumsmiljön, är det lätt att tänka att VR kanske är sämre än vanliga klassrumsmiljön för inlärning. Så behöver det inte vara. Man skulle kunna se VR som en möjlighet att ge elever tillgång till stadie ett i Kolbs cykel: konkret erfarenhet. En möjlig användning av VR i undervisningen kan i så fall vara att elever först får uppleva det ämne de ska lära sig om, exempelvis glaciärer, konkret i VR-miljön. Där får de titta 9
36 runt, få en känsla för processer och en visuell minnesbild. Denna konkreta erfarenhet kan man sedan utnyttja i vanliga undervisningen genom att kunna bygga vidare från steg ett i cykeln. Man kan också tänka sig att man växlar mellan reell och virtuell miljö för att få det bästa av båda medium. Det är så vi tänker oss att VR bäst används i undervisningen. Inte som ersättning, utan som komplement. Tversky, B., Morrison, J. B., & Betrancourt, M. (2002). Animation: can it facilitate?. International Journal Of Human-Computer Studies, 57(4), 247. doi: /ijhc Referenser Ahn, S. J., Bailenson, J., Nass, C. I., Reeves, B., & Wheeler, S. C. (2011). Embodied experiences in immersive virtual environments: Effects on pro-environmental attitude and behavior. Stanford University. Ayres, P., & Paas, F. (2007). Making instructional animations more effective: a cognitive load approach. Applied Cognitive Psychology, 21(6), Carney, R. N., & Levin, J. R. (2002). Pictorial Illustrations Still Improve Students' Learning From Text. Educational Psychology Review, (1). 5. Clark, J. M., & Paivio, A. (1991). Dual Coding Theory and Education. Educational Psychology Review, (3) Diaz, C., Hincapié, M., & Moreno, G. (2015). How the Type of Content in Educative Augmented Reality Application Affects the Learning Experience. Procedia Computer Science, 75(2015 International Conference Virtual and Augmented Reality in Education), doi: /j.procs Fox, J., Bailenson, J.N., & Binney, J. (2009). Virtual experiences, physical behaviors: The effect of presence on imitation of an eating avatar. PRESENCE: Teleoperators & Virtual Environments, 18(4), Höffler, T. N. (2010). Spatial Ability: Its Influence on Learning with Visualizations a Meta-Analytic Review. Educational Psychology Review, (3) Ludlow, B. L. (2015). Virtual Reality: Emerging Applications and Future Directions. Rural Special Education Quarterly, 34(3), Mayer, R. E. (2014). The Cambridge handbook of multimedia learning. Cambridge : Cambridge University Press, McLeod, S. A. (2013). Kolb - Learning Styles. Retrieved from 10
37 Semantisk Chunking I En Virtuell Värld Alexander Nicodemus Tagesson, Gustav Ryrlén, Minh Vuong Pham och Therese Kustvall Larsson Abstract I vår studie har vi genomfört ett experiment som har handlat om semantisk chunking som minnesåterkallningsmetod. För att utföra experimentet har vi använt oss av Virtual Reality-teknologi där försöksdeltagaren befinner sig i en virtuell värld. Syftet med studien har varit att dels undersöka och utvärdera Virtual Reality-teknologi som experimentverktyg och dels undersöka om semantisk chunking kan användas som minnesteknik för att underlätta återkallning av komplex information i en typisk inlärningsmiljö. Vår förhoppning är att semantisk chunking kommer utsättas för vidare testning och att vårt resultat kan ge en uppfattning om hur effektiv metoden är när det kommer till minnesåterkallning i inlärningssituationer. I. INLEDNING Virtual Realitys stora comeback sedan 90-talet har gjort att digital forskning och digitala experiment blivit allt vanligare. Med den virtuella världens konstgjorda miljöer kan man efterlikna den naturliga omgivningen, eller skapa nya miljöer. Som J.G. Ballard uttrycker saken: För första gången kommer vi att kunna bortse från verkligheten och inta den omgivning vi faktiskt föredrar [1]. Tidigare forskning tyder på att försökspersoner anser att Virtual Reality (hädanefter benämnt VR, om inget annat anges) som instrument möjliggör realistiska scenarion som i praktiken vore för tidseller kostnadskrävande att återskapa. Att återskapa koncentrationslägret Auschwitz i VR-miljö, vilket skall användas i rättegångarna mot SS-officerare, är kanske ett av de det mest kända exemplen på möjligheterna som VR har att erbjuda [2]. Experimentet vi har utfört med hjälp av VR-teknologin handlar om något som kallas för semantisk chunking. Semantisk chunking kan beskrivas som en typ av minnesteknik som heter Mnemoniks. Den formen av Mnemoniks som vi kommer fokusera på i vår studie heter första bokstavsmnemoniks och innebär att man skapar akronymer av första bokstaven hos relevant information för att underlätta återkallning av den informationen vid ett senare tillfälle. Vi har genomförattester med försöksdeltagare i ett virtuellt klassrum där försöksdeltagarna får ta del av en PowerPoint-presentation om yoga. Efter presentationen fick försöksdeltagarna besvara ett frågeformulär så att vi kunde utvärdera hur mycket av den relevanta informationen de tog med sig från presentationen. Vår experimentgrupp fick ta del av akronymer som har skapats med hjälp av materialet som presenteras under presentationen medan vår kontrollgrupp inte fick några akronymer tilldelade till sig. Vår förhoppning är att semantisk chunking i förlängningen ska kunna komma att användas i praktiska lärandesituationer som ett hjälpmedel för att underlätta minnesåterkallning av relevant information. II. BAKGRUND III. CHUNKING Inom psykologin benämns ofta chunking som en process där enskilda informationsbitar ackumuleras till en meningsfull enhet, en chunk, för att sedan lättare kunna återkallas [3]. Konceptet chunking bygger med andra ord på att personer som försöker minnas information som de senare behöver återkalla, representerar den informationen genom att skapa mer övergripande informationsenheter av mindre informationsbitar. I en artikel om chunkings påverkan på minnet i förhållande till talbearbetning presenterar Gilbert, Boucher och Jemel två olika typer av chunking: den ena typen kallas för semantisk chunking, vilket är ett sätt att omkoda information på och är ett viktigt koncept inom kognitiv psykologi. Vi kommer först och främst fokusera på semantisk chunking i den här artikeln [4]. Den andra typen av chunking kallas för perceptuell chunking och är en automatisk, perceptuell, process som är domängenerell och skapar grupper av sekventiella stimuli. Ett exempel på gruppering av ett sekventiellt stimuli är när en person försöker lära sig nya listor av nonsensord eller siffror och spontant skapar temporära grupper av stimuli. Perceptuella chunks brukar inte överstiga fyra informationsbitar: har jag en lista bestående av siffrorna 1, 2, 3 och 4 och representerar den som en chunk , så motsvarar varje enskild siffra i listan en informationsbit. Perceptuella chunks brukar kunna avgränsas genom att mäta personers reaktionstid när de bearbetar relevanta stimuli [4]. I sin klassiska artikel från 1955, The Magical Number Seven, Plus or Minus Two: Some Limits on Our Capacity for Processing Information [5], beskriver George Miller för första gången chunking i en publicerad artikel och den typ av chunking som diskuteras av Miller är semantisk chunking. I artikeln gör Miller en distinktion mellan en informationsbit och en informationsenhet, även kallat en chunk. En chunk ska förstås som en informationsenhet bestående av flera informationsbitar. Något som är väsentlig för semantisk chunking är omkodning av information. Miller diskuterade omkodning av information som ett sätt att skapa chunks av abstrakt eller omfattande information [5]. Vi tänker oss att jag ska komma ihåg bokstäverna F, B, I, C, I och A. Det blir lättare för mig att göra det om jag kodar om den här informationen och tänker på den som akronymerna FBI och CIA, istället för att tänka på bokstäverna som presenterades som enskilda bokstäver. När jag förhåller mig till informationen som akronymer istället för bokstäver så har jag mindre informationsbitar att ta hänsyn till under en given tidpunkt än om jag hade förhållit mig till informationen som
38 enskilda bokstäver. Jag har därmed omkodat informationen, som presenterades som bokstäver, till chunks. Den här typen av omkodning av information är tätt förknippad med en samling minnestekniker som kallas mnemoniks. Mnemoniks är en ansamling av minnestekniker som används för att organisera och lättare minnas information. Det finns ett flertal kända mnemoniks: musikmneomiks där man försöker göra en sång av material man ska memorera genom att kombinera viktiga delar av materialet med en melodi; modellmneomiks där man försöker att skapa en mental modell över materialet som ska memoreras; rimmnemoiks där man försöker skapa rim av materialet som ska memoreras; första bokstavsmnemoniks där man använder första bokstaven i ett ord och skapar nya ord med hjälp av dem [6]. Detta är bara några av teknikerna som finns tillgängliga, men den teknik vi kommer fokusera på är första bokstavsmnemoniks: vi har fokuserat på att skapa chunks med hjälp av akronymer, vilket är en form av semantisk chunking. Miller skriver att det inte alltid är enkelt att avgöra vad som utgör en chunk, utan gränsen mellan informationsbitar och chunks kan vara svår att dra. Beroende på vilka bakgrundskunskaper personen har så kommer hon gruppera informationen på den nivån hon finner rimligast, vilket i sig påverkar mängden information personen måste förhålla sig till: har vi en person som ska försöka hålla fem ord, bestående av tre fonem vardera, aktiva i arbetsminnet så påverkas informationsmängden av vilken nivå man tolkar information på: tolkar personen informationen på ordens nivå så är det fem informationsbitar att förhålla sig till, men tolkar man dem på fonemens nivå så är det femton informationsbitar [5]. Miller konstaterade att vårt arbetsminne är begränsat och att vi endast kan hålla ett mindre antal informationsdelar aktiva samtidigt (det är oklart om Miller tänkte sig arbetsminnet eller korttidsminnet, men eftersom vad skillnaden mellan arbetsminne och korttidsminne egentligen består i är en omstridd fråga [7], så utgår vi ifrån arbetsminnet i vår studie eftersom vi är av uppfattningen att det är mer vedertaget än korttidsminnet). Han trodde att antalet informationsdelar, chunks och/eller informationsbitar, en person kan hålla aktiva samtidigt var ungefär sju stycken (+/- två), därav namnet på artikeln (Miller 1955: 8-9). Att vi klarar av att hålla sju stycken informationsdelar aktiva i arbetsminnet samtidigt har ifrågasatts. Nya undersökningar har visat att det snarare verkar vara ungefär fyra informationsdelar som kan hållas aktiva i arbetsminnet samtidigt [8][9]. I diskussionen kommer vi mer utförligt diskutera hur mängden informationsdelar en person kan hålla aktiva i arbetsminnet kan påverka vårt experiment. Ivårt experiment har vi använt oss av VR-teknologi och det kommer förklaras närmare i följande avsnitt. A. IMMERSION OCH PRESENCE Begreppen immersion och presence är viktiga inom VR-världen och när ny teknologi utvecklas. Båda berör användarupplevelsen och miljön som en given VR-teknologi levererar i en virtuell miljö. Immersion syftar på graden av kvalité hos en given teknologi och dess förmåga att få en användare att bli uppslukad av miljön. Ökad immersion handlar därför om att tillverka mer avancerad teknologi där faktorer som bildhastighet, bättre användbarhet, större synfält och mer exakt spårning av användarens rörelser spelar stor roll [10]. Presence handlar om upplevelsen en användare kan ha av att finnas där, dvs då användaren uppfattar den virtuella miljön som sin primära, rumsliga, referensram, istället för den riktiga världen. Om ett VRheadset med tillhörande teknologi har god immersion ökar därmed chanserna för att spelaren ska känna stark presence i den virtuella miljön [11]. B. VR, VIRTUELLA KARAKTÄRER & VIRTUELLA MILJÖER SOM FORSKNINGSINSTRUMENT Ett problem som länge varit känt inom forskningen är enligt artikeln Immersive Virtual Environments and Education Simulations [11], svårigheten att vid laboratorieexperiment erbjuda försökspersonen en så realistisk miljö som möjligt, samtidigt som full kontroll över experimentet erhålls. Begreppet ekologisk validitet är här intressant och syftar på i vilken utsträckning som resultat från ett experiment kan tänkas ha ekologisk validitet (Ekologisk validitet är ett begrepp som ibland används på olika sätt i olika sammanhang. Vad vi menar med ekologisk validitet i vårt papper är att experiment- material, metoder och miljöer ska efterlikna verkligheten i så hög grad som möjligt. Den ekologiska validiteten anses därmed vara högre desto mer realistiskt ett experiment upplevs vara). Ekologisk validitet blir således intressant i de experiment där man ämnar applicera resultatet på en verklig miljö. Om experimenten som då genomförs har låg ekologisk validitet kommer de inte efterlikna verkligheten och resultaten från experimenten kan inte överföras till verkligheten. Säg att man är intresserad av att undersöka om det finns en korrelation mellan fysisk aktivitet och ökad puls. I detta experiment är begreppet ekologisk validitet inte relevant eftersom man endast är intresserad av att undersöka korrelationen mellan två faktorer oavsett hur miljön omkring ser ut. Är man istället intresserad av korrelationen mellan fysisk aktivitet och ökad puls i en viss miljö säg på ett flygplan blir begreppet ekologisk validitet relevant då man vill undersöka korrelationen mellan två faktorer där resultatet sedan skall argumenteras för att även gälla på ett riktigt flygplan utanför studien. Ett experiment som utspelar sig i en miljö som upplevs som realistisk har på så vis en hög ekologisk validitet, då resultatet som erhålls kommer från en situation som upplevs som realistisk [12]. I sådana miljöer tappar man lätt kontroll över experimentet eftersom fler variabler ofta förekommer och kan påverka resultatet på olika sätt. Tidigare har man därför fått göra en avvägning av hur mycket kontroll man kan tänkas släppa i utbyte mot en högre ekologisk validitet. Ett avskalat laboratorierum med få faktorer som kan inbringa felkällor kan användas för maximal kontroll, men då saknar miljön de naturliga influenser och stimuli som normalt förekommer och undersökningen tappar genast ekologisk validitet. 2
39 Allt eftersom VR-tekniken blir mer avancerad har det blivit mer och mer intressant att använda sig av virtuella miljöer i forskningssyfte, och VR har blivit ett kraftfullt verktyg för forskning inom flera områden. Med VR öppnar sig möjligheter att exakt skapa de förutsättningar i en miljö som önskas för ett visst syfte, där dessa sedan kan manipuleras genom föränding av parametrar på ett kontrollerat sätt. Detta gör att man kan ha full kontroll över ett experiment samtidigt som möjligheten till en hög ekologisk validitet erhålls. Det skapar även möjligheten att utföra experiment som tidigare varit mycket svåra (om inte omöjliga) att genomföra. TSI (Transformed Social Interaction) är ett exempel på detta, och handlar bland annat om hur vissa egenskaper hos deltagares avatarer kan ändras (såsom etnicitet, längd eller kön) och därmed påverka försökspersonernas sociala identitet. På så sätt kan personer få uppleva en värld från någon annans perspektiv, och detta kan även få personer att bete sig på annorlunda sätt än vanligt. Ett annat exempel är att olika personer i en virtuell miljö kan ha en egen verklighet presenterad för sig. I artikeln Immersive Virtual Environments and Education Simulations nämns som exempel en miljö där en talare håller ett föredrag. Åhörarna presenteras sedan med varsin verklighet där de upplever att talaren håller ögonkontakt med dem 100 procent av tiden. Detta kan öka intrycket hos hela gruppen av det som talaren säger - ett experiment som hade varit svårt att utföra utan VR-teknik. Ytterligare en fördel med att använda virtuella miljöer är att data om försökspersonernas rörelser och beteende kan samlas in med hjälp av VR-teknikens inbyggda head trackingsensorer på ett mer effektivt sätt än att till exempel analysera videoinspelningar. Det går naturligtvis att få denna fördel även utanför virtuella experiment, men då måste separat tracking-utrustning användas. Med hjälp av denna data kan små rörelsemönster upptäckas och analyseras, som annars hade kunnat passera obemärkt av blotta ögat. [13] Klassrumsmiljön som använts i vår studie har således fördelen gentemot en riktig miljö eftersom att den kan modifieras exakt efter behov. Detta gör att experimentet kan upprepas på exakt samma sätt för samtliga deltagare i studien, och även med möjlighet att manipulera enskilda detaljer. I vårt experiment har vi testat korrelationen mellan användning av semantisk chunking och förmåga att inhämta och minnas material. Ett positivt resultat visar på att vår metod är intressant att använda i inlärningsmiljöer som liknar den i vårt experiment, som vanliga klassrum. Det är viktigt att studien har hög ekologisk validitet, eftersom resultatet i högre utsträckning kan överföras till ett verkligt klassrum. VR-miljön har fördelen (mot att till exempel få titta på en videoinspelning av klassrummet i ett laboratorium) att det är möjligt att uppnå hög ekologisk validite om försökspersonerna upplever experiment som verklighetstroget. Det kan diskuteras om en tillräckligt hög, ekologisk validitet uppnås i vårt experiment, eftersom VRtekniken påverkar syn- och hörselintryck och inte andra sinnesintryck: lukt, smak eller (i vårt fall) känsel. Det kan vara så att ett klassrum exempelvis luktar på ett visst sätt, något som vi inte tar hänsyn till i experimentet och därför är det möjligt att den ekologiska validiteten sjunker eftersom vi kanske inte tar hänsyn till samtliga relevanta faktorer som kan påverka återkallning av information i ett riktigt klassrum. Vi har ställt postexperimentfrågor till våra försökspersoner som handlar om hur de upplevde den virtuella miljön och om den upplevdes som realistisk för att undersöka om den ekologiska validiteten i experimentet var hög. Om en riktig klassrumsmiljö hade använts istället hade vi fått ta hänsyn till potentiella felkällor som hade kunnat påverka resultatet, eftersom en naturlig miljö omöjligen kan hållas identisk vid olika försök och därför ger ett mindre reliabelt resultat. Begreppet reliabilitet avser förmågan att kunna mäta ett resultat på ett konsekvent sätt, som inkluderar huruvida ett experiment kan återskapas eller inte [14]. Genom att kunna presentera exakt samma förutsättningar för samtliga deltagare - även om experimentet utförs många gånger - ökar graden av reliabilitet hos experiment, vilket är en klar fördel när man ser på VR-utrustning som experimentverktyg. IV. SYFTE Syftet med vår studie är tvåfaldigt: det övergripande syftet är att testa VR-teknologi som experimentverktyg i forskningssammanhang. Efter avslutat projekt vill vi bättre kunna uttala oss om fördelar kontra nackdelar med att använda VR-teknologi som experimentverktyg. En klar fördel med teknologin är att man har god kontroll över experimentet som man utför med hjälp av VR-plattformen, medan en nackdel kan vara att experimentet inte har tillräckligt hög ekologisk validitet. Det andra syftet med studien är att undersöka om man kan underlätta återkallning av information som ska användas för att besvara frågor i ett frågeformulär genom att presentera akronymer bestående av viktiga delar av ett material som ska läras in. Användningen av akronymer som metod för att underlätta återkallning av information är en form av semantisk chunking. Vårt experiment kommer att utföras med hjälp av försökspersoner som tar del av ett förutbestämt material för första gången och som inte har några särskilda kunskaper inom området i fråga. Materialet kommer vara komplext så till vida att det kommer presenteras fakta både auditivt och visuellt under cirka tio minuter. Det som gör vår studie intressant är att vi utför ett experiment med hjälp av VR-teknologi, vilket innebär att vi testar tekniken i ett forskningssammanhang. Vi får därmed tillfälle att diskutera och försöka besvara frågor rörande VRteknologi som experimentverktyg. Förhoppningen är att studien kommer kunna bidra till ett bättre underlag för framtida utvärderingar av nämnd teknologi som experimentverktyg. Om de försöksdeltagare som tar del av chunking-scenariot i vårt experiment genomgående får ett bättre resultat på frågeformuläret än de som tar del av kontrollgruppen så tyder det på att det finns en positiv korrelation mellan den formen av semantisk chunking som vi använder i vårt experiment och informationsåterkallelse. Ett sådant resultat skulle vara intressant att forska vidare på inom flera områden, framförallt inom kognitiv psykologi och inlärningsmetodik. 3
40 V. METOD A. DESIGN Med experimentet har vi undersökt om man kan underlätta återkallning av information som använts för att besvara frågor i ett frågeformulär genom att presentera akronymer bestående av viktiga delar av materialet som ska läras in. För detta ändamål har vi valt att använda en klassisk experimentdesign bestående av ett chunking-scenario och ett scenario utan chunking, där gruppen som ingått i chunkingscenariot utsatts för en viss behandling och gruppen i det andra scenariot utgjort en kontrollgrupp. Experimentet inleddes med att alla försökspersoner fick en kort intoduktion till det material som sedan skulle presenteras under PowerPoint-presentationen i experimentet. I chunkingscenariot delgavs sedan försökspersonerna akronymer av viktiga delar av materialet som sedan skulle presenteras för dem. Akronymerna inkluderades därmed i introduktionen som försöksdeltagarna tog del av innan presentationen. I kontrollgruppen fick försöksdeltagarna ta del av samma introduktion som gruppen i chunking-scenariot, men utan att få akronymerna presenterade för sig. Försöksdeltagarna i kontrollgruppen utsattes därmed för samma behandling som gruppen i chunking-scenariot, förutom att akronymerna presenterades, vars korrelation till informationsåterkallelse vi är intresserade av. Med designen som valts försökte vi säkerställa att andra faktorer inte påverkat den korrelation som är intressant för vår studie sambandet mellan att ta del av chunking-scenariot och vilket resultat man fått på frågeformuläret. I diskussionen diskuteras experimentets validitet och vilka faktorer som kan tänkas påverka validiteten hos experimentet. VR-teknologi är relevant för vår studie eftersom vi kan påverka vad försöksdeltagaren upplever i en högre grad än vad man kan göra om man hade gjort en liknande studie i exempelvis ett vanligt klassrum. Som tidigare nämnts är det möjligt att ha fullständig kontroll över ett experiment i en virtuell miljö, samtidigt som man har möjlighet att uppnå en hög ekologisk validitet. Att uppnå både kontroll och ekologisk validitet samtidigt är något som varken en laboratoriemiljö, videoinspelning eller en riktig klassrumsmiljö hade kunnat erbjuda på samma sätt. B. GENOMFÖRANDE AV EXPERIMENT Försöksdeltagare samlades in som fick ta del av en PowerPoint-presentation i en VR-miljö bestående av ett virtuellt klassrum. Vi började med att informera försöksdeltagarna om varje steg i experimentet och hur lång tid varje steg beräknas ta. Sedan ställdes ett antal frågor till försöksdeltagarna som är relevanta för vårt experiment. Bland annat frågades om kännedom om kunskapsområden som anknyter till materialet som presenteras under experimentet, tidigare erfarenheter av VR och personlig erfarenhet av olika mnemoniks(minnes- ) metoder. Svaren på pre-experiment-frågorna var värdefulla vid analys av experimentets data och hade även hjälpt oss att sålla bort personer som inte är lämpliga som försöksdeltagare för att de har för mycket förkunskaper om ämnet om det behövts. Försöksdeltagarna fick därefter sätta sig ner på en stol för att genomgå ett arbetsminnestest, vilket består av ett Dualn-back-spel, som utförs på en dator. Ett Dual-n-back-spel bygger på att spelaren ska hålla information som presenterades under ett initialt steg aktiv i arbetsminnet, samtidigt som nya steg presenteras. Spelplanen består av en 3x3 rutmatris. Med 2 sekunders mellanrum läses en bokstav upp samtidigt som en ruta blinkar. Det går ut på att dels hålla koll på när bokstaven upprepas men även när samma ruta som tidigare blinkar. När detta inträffar skall man klicka på en tangent. På nivå 1 blir det match då antingen samma bokstav eller ruta kommer i direkt följd medan nivå 2 genererar match då varannan antingen bokstav eller ruta upprepas. Allteftersom spelet fortskrider läggs nya steg till successivt och det blir svårare och svårare för spelaren att hålla den relevanta informationen aktiv i arbetsminnet. Vi valde att låta försökspersonerna lära sig testet genom att först prova på nivå 1, vartefter resultatet sedan noterades på nivå 2. Bilder från testet hittas i Appendix B. Resultatet på arbetsminnestestet har varit användbart när vi analyserat data från det fullständiga experimentet eftersom det hjälpt oss att kategorisera grupper och bättre uttala oss om användbarheten hos metoden vi har undersökt: Innan genomförandet hade vi tankar om att det skulle kunna vara så att grupper med svagare arbetsminne kan dra extra stor nytta av att använda semantisk chunking, men det kan också vara tvärtom. Sådana möjliga samband gjorde data om försöksdeltagarnas arbetsminne intressant. När arbetsminnestestet avklarats tilldelades försöksdeltagarna ett par Oculus Rift VR-glasögon som sedan användes under stora delar av experimentet. Innan själva experimentet startats informerades försöksdeltagarna om att de kunde avbryta experimentet när de ville och att den data vi skulle samla in endast skulle användas i det här projektet. Därefter delardes försöksdeltagarna i två grupper: en grupp som testades i chunkingscenariot och blev experimentgrupp och en grupp som ska testades i kontrollgruppen och blev kontrollgrupp. När försöksdeltagarna hade delats in i grupper fick de ta del av respektive introduktion (med eller utan akronymer) och sedan en föreläsning om yoga på ungefär 10 min. Föreläsningen i den virtuella miljön gavs av en animerad lärare med en PowerPoint-presentation. Informationen som förmedlades var därför både auditiv och visuell. Efter att presentationen avslutats spelades ett kortare distraktionsmoment upp i form av en animerad film som heter Badger song och som spelas upp i Oculus Rift-headsetet. När filmen spelats i en minut avbröts simulationen och försöksdeltagarna fick svara på ett frågeformulär på en dator. Frågeformuläret innehåller ett antal faktafrågor om materialet som presenterades under PowerPoint-presentationen. Frågorna återfinns i Appendix C. Frågorna har fyra möjliga svarsalternativ, där en fråga innehåller två rätta svar och resterande frågor innehåller ett rätt svar. En experimentledare närvarade när båda grupperna besvararde frågeformuläret. 4

41 Vi avslutarde experimentet med att ställa några postexperiment-frågor till försöksdeltagarna om bland annat olika minnestekniker och om de använde akronymerna som presenterades i början av experimentet, samt hur de upplevde den virtuella världen och klassrumsmiljön. Pre- och postfrågorna finns bifogade i Appendix A och en längre diskussion om post-experiment-frågor kommer i diskussionen. C. MATERIAL Klassrumsmiljön och sammanställningen av samtliga komponenter i den virtuella miljön gjordes i Unity v 5.4 Personal. Eleverna i klassrummet är genererade med hjälp av Autodesk Character Generator där man med enbart några knapptryck kan välja klädsel och utseende på karaktärerna. Lärarens rörelsemönster under presentationen spelades in via Qualisys Motion Capture Kameror (MoCap). MoCap genererar koordinater som kan kopplas till en karaktär i Autodesk Motion- Builder, därefter kan 3d-figuren exporteras till Unity. Experimentet kommer att presenteras och simuleras med hjälp av ett Oculus Rift DK2-headset med tillhörande programvara. Vi valde Oculus Rift framför Google Cardboard/Samsung Gear VR då den ger bättre verklighetskänsla. Fig. 1. En första Lo-Fi prototyp över hur klassrummet skulle se ut. D. LO-FI Ett första steg i skapandet av en virtuell miljö var att göra en Lo-Fi prototyp som visade hur vi ville att miljön skulle se ut. Vi valde att skissa upp ett klassrum på White board-tavla så att hela gruppen kunde komma med input och saker lätt kunde ändras. Samtliga personer i gruppen fick bestämma vilka föremål som brukar finnas i ett klassrum, vartefter de ritades upp. Det kändes viktigt att placera ut tillräckligt många klasskamrater i salen för en mer realistisk känsla, och även projektordukens storlek och synlighet var viktig då det är avgörande för hur väl presentationen kommer att synas. Läraren blev positionerad bredvid projektorduken eftersom det är denna karaktär som ska hålla i presentationen. Vi var överens om att resterande föremål inte har lika stor inverkan på experimenten, och därför placerades de ut där det kändes naturligt (se figur 1). När klassrummets design bestämts gjorde vi en skiss på papper hur vyn från försökspersonens plats skulle se ut (figur 2). Samtliga redogörelser för föremåls placering beskrivs hädanefter ur ett egocentriskt perspektiv, dvs. ur försökspersonens perspektiv [15]. I vår klassrumsmiljö valde vi att sätta personen på andra raden i klassrummet (på höger sida om mittgången), så att tavlan ligger snett till vänster om försökspersonen. På detta sätt skulle både tavlan synas väl och personen skulle ha sina klasskamrater i synfältet något som skulle förstärka känslan av att sitta i ett riktigt klassrum. I skisserna har vi även valt att ta med smådetaljer såsom: block, pennor och lampor, för att skapa en så verklig miljö som möjligt. E. UNITY Efter en rekommendation från handledaren valde vi att använda programmet Unity till utvecklingen av den virtuella Fig. 2. Lo-Fi-skiss över vyn från försökspersonens perspektiv. klassrumsmiljön. Ingen av oss hade tidigare använt Unity och därför fungerade den första tiden som inlärningsprocess där vi mest testade olika saker för att förstå hur programmet fungerar. Efter skisserna som gjorts tidigare utvecklade vi sedan en så lik miljö som möjligt av klassrummet med några undantag. Vi valde att ha färre elever i klassrummet då det kändes fullt tillräckligt med 24 elever istället för 36. Vi lade även till extra affischer på väggarna då ett riktigt klassrum sällan är kalt och tomt på väggarna. De flesta objekt som ingår i klassrummet hämtades gratis från Unitys Asset store. Enstaka objekt fick tillverkas från grunden, såsom ett skåp för pappersmaterial, där olika kuber sattes ihop med olika material för att likna det som behövdes. När klassrummet var färdigt (se figur 3) konstaterade vi att det liknade ett högstadieklassrum snarare än ett universitetsklassrum. Vi funderade över om detta skulle komma att påverka resultaten i våra experiment på något sätt, efter- 5


42 Fig. 3. Klassrummets slutliga utseende. som de är tänkta att utföras på universitetsstudenter. Vi kom fram till att det inte borde spela någon större roll, eftersom det fortfarande handlar om en lärandemiljö som ska undersökas inte nödvändigtvis en universitetsmiljö. Det kan dock vara så att den ekologiska validiteten för experimentet sjunker till viss del om resultatet endast är tänkt att appliceras på universitetsmiljöer. Eftersom vi har tänkt oss att experimentet skall approximera ett klassrum, inte nödvändigtvis ett universitetsklassrum, och så länge försöksdeltagarna upplever miljön som en klassrumsmiljö så påverkas inte den ekologiska validiteten nämnvärt. Sammantaget har utvecklandet i Unity fortgått förhållandes problemfritt. Gruppens programmerare behärskar nu programmet väl, och har en god uppfattning om vad som är genomförbart rent programmeringsmässigt. Vid arbetsprocessens inledande skede var den enhetliga uppfattningen att en avsevärd mängd kod skulle behöva skrivas; det visade sig dock att drag n drop- och inställningsfunktionerna var de fundamentala verktygen i Unity, och i efterhand har vi ansatt och skrivit få C- script under processens gång. Med hjälp av en omfattande vägledning i Unitys dokumentation, och med stöd från våra handledare, så gick arbetet i Unity förhållandevis väl. 1) VR-miljö och cybersickness: Vi diskuterade inom gruppen huruvida våra försökspersoner skulle reagera när de först kastades in i den virtuella miljön. Det som oroade oss var att personer som aldrig tidigare testat VR-glasögon kan bli för uppslukade av miljön i sig och få svårt att koncentrera sig på uppgiften (presentationen). Vi bestämde därför att klassrumsmiljön skulle utökas med en korridor som leder in till klassrummet, så att försökspersonerna får gå in genom korridoren innan de sätter sig på sin plats (se figur 4). Förhoppningen var i början att detta skulle avdramatisera VR-upplevelsen och låta personen få tid till att titta runt och vänja sig vid upplevelsen att befinna sig i en VR-miljö innan det var dags för själva experimentet. Vad som menas med att gå in genom korridoren är att kameran i miljön animerats till att flyga in och sätta sig på rätt plats. Genast uppstod ett nytt problem: om försökspersonen inte själv har möjlighet att förflytta sig utan blir förflyttad automatiskt så kan cybersickness uppstå. Lisa Rebenitsch skriver i artikeln Managing Cybersickness in Virtual Reality [16] att Cybersickness definieras som en känsla av desorientering och yrsel som vanligen föregås av illamående. Det finns olika teorier om vad som orsakar cybersickness, ett förslag är att personens sinnesintryck till innerörat och ögat inte överensstämmer. Med andra ord kan en person uppleva cybersickness om VR-miljön presenteras som ett rörligt tillstånd fast personen egentligen står still. Om de virtuella förhållandena är sådana att de kan ge upphov till cybersickness så väntas dessa obehagskänslor upplevas inom 15 minuter enligt Rebenitsch. För att ge försöksdeltagaren större kontroll över sina egna rörelser i den virtuella miljön och motverka cybersickness, beslöt vi att det ska vara möjligt att styra de egna huvudrörelserna och titta sig omkring medan kameran flyger in. Kamerans animering in i klassrummet är 23 sekunder lång, vilket är betydligt kortare än gränsen för att känna obehag, vilket är 15 minuter. Eftersom vi ville åstadkomma en avdramatiserande effekt och animeringen (av allt att döma) är för kort för att hinna ge obehagskänslor, beslutade vi att risken för cybersickness är låg och därför behöll vi animeringen. Vi testade senare på oss själva för att se om någon i gruppen upplevde obehag. Även under experimentets gång frågade vi deltagarna om de känt sig snurriga eller illamående. Det kunde konstateras att en tredjedel av deltagarna upplevde någon typ av obehag just under inflygningen, men att detta senare försvann när personen satt still i klassrummet. Användarens synfält med VR-kameran under promenad i korri- Fig. 4. doren. 2) Placering i klassrummet: Efter att animeringen fungerade som den skulle och klassrumsmiljön var klar, började vi fundera över om presentationen skulle synas tillräckligt bra, då den från början verkade vara lite långt bort från den plats där försökspersonen för närvarande satt. Vi bestämde därför att utvärdera några olika scenarier där personen fick sätta sig på olika platser, vartefter vi jämförde vilken plats som fungerade bäst. De (tre) nya scenarierna var (ur ett egocentriskt perspektiv): (i) personen sitter på andra raden fast på vänster sida om mittgången; (ii) personen sitter på höger sida om mittgången fast på första raden; och (iii) personen sitter på vänster sidan om mittgången på första raden. Vi bedömde att scenario (iii) fungerade bäst med avseende på experimentet, eftersom försökspersonen då sitter mitt framför presentationsduken. En testvideo lades in på duken och ställdes in att börja spela efter 25 sekunder 2 sekunder efter att personen hunnit komma in och sätta sig efter promenaden genom korridoren som inleder experimentet. Genom att använda en testvideo kunde vi se vilket format den riktiga presentationen skulle 6
43 presenteras i. Här kunde man valt att börja spela videon med ett knapptryck, men eftersom samtliga personer i de olika experimenten ska få samma tid på sig, har vi valt att alltid starta videon vid samma tidpunkt. 3) Ljud: PowerPoint-presentationen som animerades i Mo-Cap spelades in med en mikrofon som var placerad till höger om lärarkaraktären. Det blev därför naturligt att försökspersonen var placerad i klassrummets högra del sett från ingången. Vid simulering så noterade vi en total tystnad, vilket kändes orealistiskt. Därför applicerades ett bakgrundsljud där man hör penndragningar, hostningar och samtal. Ljudfilen laddades rättighetsfritt hem från hemsidan Soundcloud. Det var svårt att hitta klassrumsljud, många var för högljudda eller med för dålig kvalitet och påverkade verklighetskänslan i klassrummet. 4) Passiv VR: Experimentet har genomförts med passiv VR, vilket innebär att man kan vrida på huvudet, men inte interagera med omgivningen eller byta plats i den virtuella miljön. Till skillnad från aktiv VR, där kontroller och sensorer används för navigering och orientering. Passiv VR används vanligtvis till minnestest, då kan det röra sig om att memorera ordningsföljder eller lägga märke till olika objekt. Aktiv VR har emellertid bättre effekt på det spatiala minnet, dvs. hur olika miljöer hänger ihop och hur man navigerar i dem [17]. F. ANIMATIONER OCH KARAKTÄRER 1) Karaktärer: En viktig aspekt utav VR-klassrummet var karaktärerna, bestående av läraren och eleverna. Den första karaktären som gjordes var en av Unitys standardkaraktärer, Ethan. Denna figur var användbar för att enkelt testa olika grundläggande funktioner och enkla animeringssekvenser som att sitta, stå och gå. Det fanns dock inga möjligheter att variera utseendet på Ethan, så för att kunna generera olika (unika) karaktärer för att gestalta läraren och för att befolka klassrummet använde vi Autodesk Character Generator. Autodesk, som var enkelt att tillämpa i vårt projekt, var både användarvänligt och effektivt och visade sig bli det bästa tillgängliga karaktärsverktyget för vårt projekt. 2) Motion Capture och FaceFX: En del i klassrummet var själva presentationen som skulle vara lite mer i fokus än resterande objekt och händelser i klassrummet vilket innebar att själva föreläsaren och föreläsningen skulle bli bättre och tydligare. För att göra detta så bra som möjligt bestämde vi oss för att föreläsarens överkroppsanimationer skulle göras med hjälp av motion capture (MoCap) och ansiktsanimationer med hjälp utav FaceFX. MoCap är processen att spela in en levande rörelse och därefter översätta det till data som gör det möjligt för en 3D återskapning av rörelser. Processen gick ut på att en av oss ställde upp som modell för både karaktären och animationerna till modellen. För att kunna spela in rörelserna i realtid placerades markörer som är utformade för att reflektera ljus i det infraröda våglängdsområdet. De är klotformade (cylindriska) för att reflektera ljus i olika lägen och i olika riktningar som gör det möjligt för fler kameror att uppfatta ljuset från markörerna. Kamerorna både sänder ut infrarött ljus och registrerar detta ljus när det reflekteras av markörerna. När dessa markörer var placerade så utfördes själva föreläsningen utav volontären. Föreläsningen delades upp i mindre delar som vi gjorde i flera tagningar. FaceFX, som är det andra animationsprogrammet som vi använt oss utav, generar animeringsdata för läppoch ansiktsrörelser utifrån ljudfiler. Med detta verktyg kan karaktärerna i klassrummet ha förhållandevis naturliga ansiktsanimationer som förbättrar upplevelsen för försökdeltagaren, vilket förhoppningsvis kan minska felkällorna [18]. G. IMMERSION I PROJEKTET I vår studie har vi kunnat påverka vilken grad av immersion som råder genom att välja vilken plattform miljön ska köras i. När vi funderade över vilken teknik som ska användas i studien strävade vi efter en så hög immersion som möjligt, med avvägning att det skulle vara någorlunda enkelt att utföra. Valet av plattform som skulle användas diskuterades såväl internt i gruppen som externt med vår handledare. Projektet var till en början främst ämnat att köras på en Android-mobil i headseten Google Cardboard eller Samsung Gear VR. Vi insåg dock att detta skulle ge oss begränsningar i form av upplösning och att tavlan samt PowerPointen kanske inte skulle vara tillräckligt tydlig för testpersonerna vilket skulle kunna skapa problem. Fördelen med att använda en Android-mobil som plattform skulle vara att den är lättåtkomlig samt att vi inte behöver boka eller reservera tid för begränsad hårdvara. Trots detta valde vi Oculus Rift eftersom den har bättre tekniska egenskaper såsom snabbare bildhastighet och större synfält [19], vilket ger en ökad kvalitetskänsla och immersion. VI. RESULTAT A. TESTPERSONER Användarstudien utfördes på 18 testpersoner - 5 kvinnor och 14 män i åldersgruppen år. Samtliga försökspersoner är eller har nyligen varit studenter vid Lunds Universitet. Vår målsättning var att hälften av testpersonerna skulle ta del av chunking-versionen av experimentet och andra hälften skulle ta del av versionen med introt utan chunking. På grund av sjukdom så blev fördelningen 11 personer i experimentgruppen och 7 i kontrollgruppen. B. FÖRKUNSKAPER Testet inleddes, som bekant, med att undersöka om försökspersonerna har tidigare erfarenhet av yoga och/eller VR för att vi senare skulle kunna se om de kunde dra fördel av dessa kunskaper. Fig 5 visar en sammanställning av hur många som inte kunde någonting om yoga och hur många som hade mindre kunskap ur de båda grupperna. Här redovisas även andelen personer som provat någon form av VR tidigare. 7


44 att chunka materialet svarade bättre på faktafrågorna trots ett märkbart sämre resultat på arbetsminnes-testet (cirka 26%). Fig. 5. Förkunskaper kring Yoga och VR. C. SIMULERINGENS FÖRLOPP I nästa fas undersökte vi hur testpersonerna förhöll sig till presentationen och experimentet. Enligt figur 6 så kan vi tydligt se att instruktionerna var förhållandevis klara trots att majoriteten av chunking-gruppen inte använde någon minnesteknik eller de akronymer som presenterades. Här finner vi även att hela 55% av Chunking-gruppen vid något tillfälle upplevde yrsel medan ingen ur kontrollgruppen kände sig yr. Fig. 7. Resultat på Dual n back-testet och kunskapstestet. De olika grupperna har haft liknande fram- och motgångar om man ser till var fråga för sig. Det visade sig dock att chunking-gruppen lyckades bättre på fråga 6 och 9 medan kontrollgruppen lyckades bättre på fråga 11, se figur 8. Fig. 6. Frågor och svar kring testet. Fig. 8. Procentuell andel rätt per fråga på kunskapstestet D. KUNSKAPSTESTET Sammanställningen av resultatet på testerna tyder på att de försökspersoner med förkunskaper kring yoga och/eller med erfarenhet av VR inte nödvändigtvis kunde dra nytta av sin kännedom då de överlag presterade sämre på kunskapstestet, se Table 1. Testat VR Ej testat VR Mindre kunskap om Yoga Ingen kunskap om Yoga TABLE I MEDELVÄRDE PÅ TESTETGIVETFÖRKUNSKAPER Resultatet visar inte heller på någon korrelation mellan Dual n Back-testet (arbetsminnestestet) och kunskapstestet, se Figur 7. Värt att notera är att den grupp som uppmanades Med hjälp av de olika resultaten i respektive grupp så kunde vi beräkna möjliga avvikelser och varianser. I den första gruppen där semantisk chunking utfördes så gav resultatet en standardavvikelse på och en varians på I kontrollgruppen så beräknades standardavvikelse till och som varians. E. FEEDBACK Efter simuleringen fick försökspersonerna tillfälle att kommentera upplevelsen och ge feedback på VR-miljön. Följande kommentarer om testet var återkommande: Man blev yr vid introfasen då man går in i klassrummet. Ibland var lärarens mun osynkroniserad med ljuden. Vid något tillfälle i presentationen så hoppar läraren till och flyttas bakåt. Verklighetstrogen och detaljrik miljö. 8
45 Miljön runtomkring tog en del fokus från presentationen. Bra ljud, både från läraren och bakgrunden. De viktigaste observationerna vi som försöksledare gjorde var: En stor majoritet( ca 80%) missuppfattade att man fick fylla i två alternativ på fråga 10 och fyllde bara i ett kryss. Vissa testpersoner fick anstränga sig för att se texten. Nästan samtliga försökspersoner var i början uppslukade av miljön och spenderade första sekunderna åt att kolla sig omkring. Några få började fokusera på annat än presentationen efter ett tag då de verkade uttråkade. VII. DISKUSSION A. RESULTAT Av resultatet framgår ett antal intressanta saker som bör diskuteras närmare. För det första skiljer sig medelvärdena åt mellan gruppernas resultat på frågeenkäten. Gruppen som tog del av chunking-scenariot fick i genomsnitt 0,5 rätt mer än kontrollgruppen, trots att kontrollgruppen i genomsnitt hade 25 procentenheter bättre än chunkinggruppen på det inledande arbetsminnestestet. Värt att nämna är även att chunking-gruppen i regel kände större obehag av den virtuella miljön än kontrollgruppen, något som kan tänkas påverka koncentrationen negativt och göra det svårare att fokusera på informationen som presenteras under föreläsningen. Eftersom få föröksdeltagare använts i studien kan vi inte uttala oss om resultatet beror på slumpen eller faktiskt påvisar att användning av semantisk chunking kan underlätta minnesåterkallning och därmed även inlärning. På frågan om akronymer använts för att återkalla information svarade de flesta att de inte använt sig av dem alls, där någon till och med nämnde att akronymerna snarare förvirrade än underlättade inhämtning av information. Det är svårt att påvisa att försökspersonerna inte har haft nytta av akronymerna då de kan ha använt sig av dem undermedvetet, vilket inte är ett orimligt antagande med tanke på att chunking-gruppen hade ett något starkare resultatet på frågeenkäten, samtidigt som de svarade som de gjorde på postexperimentfrågorna. Beträffande standardavvikelsen och variansen så kan dessa siffror tolkas påmånga sätt. Till att börja med såpåverkar antal försökspersoner värdena och för att få trovärdigare siffror krävs fler försökspersoners resultat för att göra uträkningar. Trots att datamängden var liten så upptäckte vi en del intressanta indikationer att analysera och diskutera vidare. Att chunking-gruppen har högre standardavvikelse kan bero på flera olika saker. En tanke är att chunkingen och akronymerna har skapat mer förvirring hos försökspersonerna som alltså svarat mer olikt varandra än kontrollgruppen - vilket således lett till en högre standardavvikelse. Denna tes stöds av svaren på postfrågorna som ställdes till chunking-gruppen om akronymerna hjälpte, där ett flertal ansåg att akronymerna inte hjälpte. Av detta så gav det variansen vilket är ett stort spektrum av olika svarsalternativ. I kontrollgruppen så fick vi lägre värden. Faktorer som kan ha påverkat kan ha varit att det var färre testpersoner i detta scenariot, 7 försökspersoner, och att deras DnB-test också var relativt lika varandra. En annan faktor som kan ha påverkat kan vara att många i kontrollgruppen kände sig relativt bekväma med den virtuella miljön och därför lättare kunde koncentrera sig och lyssna på presentationen och därmed lättare kunde ta in informationen som var relevant för att besvara frågeenkäten. Trots att experimenten utförts på samma sätt för samtliga försökspersoner finns det ändå en viss skillnad mellan olika deltagare som bör tas upp. Tiden då experimentet ägde rum varierar från 12:15 till cirka 18:10. Enstaka försökspersoner som utfört experiment sent på dagen nämnde att det hade varit lättare att ta in informationen som presenterades under föreläsningen om man hade gjort experimentet tidigare på dagen. Högre procentandel i chunking-gruppen utförde tester efter klockan 14:00 på dagen än kontrollgruppen, något som kan tala emot chunking-gruppen eftersom försöksdeltagarna var studenter som förmodligen studerat under dagen och blev tröttare ju senare ut på dagen de utförde experimentet. Då erhållen tid för att besvara frågetestet i experimentet inte begränsades, ledde det till att vissa försökspersoner fick längre tid på sig att återkalla informationen än andra, vilket möjligtvis kan ha påverkat resultatet på frågeenkäten. I genomsnitt tog det ca 4 minuter för försökspersonerna, oavsett grupp, att besvara frågeenkäten. I fallen där vi mätte tiden det tog för en försöksdeltagare att besvara frågeenkäten så kunde vi inte se någon koppling mellan högre resultat på enkäten och lång svarstid. Snarare fanns det en svag positiv korrelation mellan resultat och kort svarstid. Diskussionen av resultatet kan sammanfattas med att det finns många faktorer som talar emot chunking-gruppens gällande antal rätt besvarade frågor i frågetestet, och till fördel för kontrollgruppen. Som exempel har chunkinggruppen i regel känt större obehag av den virtuella miljön, presterat sämre på arbetsminnestestet och i större utsträckning genomfört experiment senare på dagen än kontrollgruppen. Trots detta är resultatet på frågeenkäten bättre i chunking-gruppen något som kan bero på slumpen eller helt enkelt på att akronymerna faktiskt underlättar återkallning av information. B. EKOLOGISK VALIDITET Att många försökspersoner känt yrsel eller illamående under simuleringens första del var något vi var beredda på men hoppades inte skulle infinna sig hos särskilt många. En tredjedel av samtliga försökspersoner i studien kände någon form av illamående eller yrsel, dock förekom det mest i början när personen rörde sig i den virtuella miljön och försvann sedan när personen fick sitta still under presentationen. Att känna yrsel i en virtuell miljö sänker experimentets ekologiska validitet, då detta normalt inte är något som en person upplever i ett riktigt klassrum. Det kan även påverka försökspersonens koncentration och få den att fokusera på fel 9
46 saker under experimentet. Den första delen av simuleringen är dock inte betydande för experimentets resultat, eftersom det bygger på presentationen som ges, utan endast till för att avdramatisera den virtuella miljön för förstagångsanvändare. Det är först när presentationen börjar som försökspersonen inte bör känna illamående eller obehag för att kunna koncentrera sig. Eftersom de flesta inte längre kände obehag när presentationen väl drog igång kan man ändå säga att vårt experiment inte upplevts som orealistiskt överlag och därför bibehåller en hög ekologisk validitet. Detta påstående kan även styrkas genom de svar som erhölls på frågor som ställts efter simuleringen. 67% av försökspersonerna nämnde efteråt att de tyckte att miljön kändes verklig eller som ett riktigt klassrum. Detta var precis det vi eftersträvade under utvecklingen av den virtuella miljön för att erhålla en hög ekologisk validitet att klassrummet skulle bli så likt ett riktigt som möjligt. Endast genom att ställa frågor till försökspersonerna efteråt kunde det konstateras att miljön verkat hålla den kvalitet som önskats och därför anser vi att svaren på postexperimentfrågorna tyder på att vårt experimentet överlag har en hög ekologisk validitet. I början av projektet valdes plattformen Oculus Rift till viss del på grund av att denna skulle ge en god immersion och tack vare dess avancerade tekniska egenskaper. Enstaka försökspersoner nämnde dock att miljön kändes lite suddig/lågupplöst, vilket visar på att den immersiva egenskapen varit något lägre än förväntat. God immersion leder som bekant ofta (men inte alltid!) till en högre grad av upplevd precense, då det är svårt att känna sig som en del av en virtuell miljö om tekniken brister. Att känna precense är en viktig del för att hålla den ekologiska validiteten hög, eftersom det inte bara är viktigt att miljön ser ut som en riktig miljö utan också att försökspersonen inte störs av tanken att den är artificiell i för hög grad. Detta kan därför sänka den ekologiska validiteten något, om enstaka försökspersoner upplevt miljön som mindre immersiv och därför känt sig mer distraherad än uppslukad av den virtuella miljön. C. METODVAL I den här sektionen kommer vi närmare redogöra för de metodval vi har gjort och problematisera dem i relation till metodologiska begrepp som validitet och reliabilitet. Ett potentiellt problem var att vi inte kunde vara säkra på att vi mäter semantisk chunking med vår experimentdesign och därmed påverkas validiteten hos vårt experiment. Resultaten på frågeformuläret säger inte nödvändigtvis något om försöksdeltagarna har chunkat materialet som presenterats, alltså tillgodogjort sig akronymerna som presenterades i början av chunking-scenariot, eller om det är något annat som påverkar resultatet. Tidigare studier som har gjorts i samband med perceptuell chunking har ofta innefattat en tidskomponent [22] [23]. Dessa studier har ofta genomförts med material som har varit anpassat till ett visst syfte, exempelvis återkallning av hur schackpjäser stod placerade på ett schackbräde, vilket har lett till att man har kunnat kontrollera tidsaspekter på ett smidigt sätt. Simon och Chase karaktäriserade perceptuella chunks med hjälp av en tidskomponent. De utgick ifrån att om en försöksdeltagare hade en längre återkallningsperiod av information som behövdes för att lösa den givna uppgiften så visar det på en gräns mellan olika chunks och korta återkallningsperioder indikerar att informationen tillhör samma chunk. Fördelen med en sådan karaktärisering av en chunk är att det går att mäta när försökspersoner har chunkat information som presenterats [22]. Godtar man Chase och Simons grundantagande, att perceptuella chunks kan karaktäriseras med hjälp av en tidskomponent, och tycker att överföringen går att göra till semantiska chunks, så kan metoden som presenteras vara bra för att visa att chunks har bildats, men metoden är ändå inte lätt att överföra till vårt experiment. Vårt experiment sträcker sig över lång tid och vi har inte någon möjlighet att noga studera vad försöksdeltagare fokuserar på under PowerPoint-presentationen som ges under experimentet. En möjlig lösning hade kunnat vara att kombinera Eye-Tracking-teknologi med VR och då kunna studera vad försöksdeltagarna fokuserar på visuellt. Problemet i det fallet hade varit att vi inte hade kunnat uttala oss om försöksdeltagarna fokuserar på den auditiva informationen eller inte, så därför är inte endast användning av Eye- Tracking-teknologi i kombination med resterande del av vårt experiment ett tillräckligt bra sätt att visa på att chunks har bildats. Möjligtvis hade vi kunnat studera bearbetningstiden när försöksdeltagarna besvarar frågorna i frågeformuläret, likt hur Chase och Simon studerade sina försöksdeltagares bearbetningstider när de skulle återge hur schackpjäser stod utplacerade. Det är dock inte ett helt rimligt tillvägagångssätt för att visa att chunks har bildats hos försöksdeltagare i vårt experiment. Skälet till att vi inte lika lätt kan göra samma antagande som Chase och Simon är att försöksdeltagarna sannolikt har bearbetat större mängder information, som de inte kände till sedan tidigare, utdraget över en tio minuters period. Att återkalla informationen för att sedan besvara frågeformuläret är krävande för försöksdeltagarna och längre bearbetningstider kan inte utan vidare stöd antas visa på att en chunk har bildats. En möjlig brist i vår experimentdesign är att försöksdeltagare som tar del av chunking-scenariot får ta del av presentationsmaterialet under lite längre tid, ungefär 30 extra sekunder, än försöksdeltagarna i kontrollgruppen får. Det potentiella problemet är alltså att tiden skiljer sig något mellan chunking- och kontrollgruppen. Det beror på att akronymerna ska inkluderas i chunking-scenariot, men inte i kontrollgruppen. Vi anser inte att det är ett stort problem eftersom försöksdeltagarna i chunkinggruppen även fick ny information att förhålla sig till under den extra tiden, vilket inte ger extra tid till att konsolidera materialet på annat sätt än genom den metod vi föreslår ska användas under experimentet. Vissa försöksdeltagare skulle kunna tänkas fokusera på att konsolidera sammanfattningen istället för att fokusera på presentationen av akronymerna och uppmaning till chunking, men det känns osannolikt. Försöksdeltagarna 10
47 upplevde förmodligen den här delen av experimentet som en inledning som är viktig att vara uppmärksam på och därför fokusera på instruktionerna som ges och inte på att försöka memorera materialet på annat sätt än genom metoden som presenteras. Den extra informationen som presenteras i chunkingscenariot kan dessutom öka den kognitiva belastningen hos försöksdeltagarna i chunking-scenariot gentemot försöksdeltagarna i kontrollgruppen. Ser man till de två ovannämnda faktorerna så anser vi att den lilla tidsskillnaden mellan de båda scenarion verkar försumbar och därmed inte påverkade utfallet av vårt experiment. Som nämnts tidigare i artikeln så tyder forskningen på att begränsningar i vårt arbetsminne ligger närmare fyra informationsenheter än sju, som Miller påstod. Det är dock inget vi tog hänsyn till i vårt experiment när vi utformade akronymerna vi använde oss av i experimentet. Försöksdeltagarna i chunking-scenariot tog ställning till åtta akronymer, bestående av tre (en akronym med fyra) bokstäver som representerar olika delar av materialet som presenteras. Materialet som bokstäverna baserades på ligger nära varandra under själva presentationen av materialet. Utöver de frågorna som är knutna till akronymerna så inkluderade vi även andra frågor för att se om försöksdeltagarna hade kunnat ta in mer information än den som var knuten till akronymerna. D. FÖR- OCH NACKDELAR MED VR Som nämnts i artikeln finns både fördelar och nackdelar med en VR-miljö. Fördelarna är möjligheten att skapa en realistisk miljö samt att kunna presentera exakt samma miljö och samma omständigheter för flera deltagare vid skilda tillfällen. Den stora nackdelen är att man per definition avskärmar sig från verkligheten, och att resultatet därmed inte med säkerhet kan sägas överensstämma med hur forskningsresultatet avspeglas i praktiken. När det gäller jämförande studier där korrelation mellan olika faktorer undersökts, kan man argumentera för att det viktigaste är att de genomförs under samma omständigheter. Men oavsett kvaliteten på VR-miljön, hur den är designad och huruvida man använder sig av plattformar som tillämpar aktiv eller passiv VR kan man få resultat, då bristerna med ett tillvägagångssätt drabbar samtliga grupper som skall jämföras. Men om man senare villapplicera resultatet från sina experiment på verkliga miljöer så spelar dessa faktorer roll för om hög ekologisk validitet uppnås eller inte. En potentiellt sett negativ faktor med att använda VRteknologi är svag överföringseffekten av lärande. Att vi testat hur metoden semantisk chunking fungerar i vårt experiment, som utspelades i en virtuell miljö, kan inte garantera att det fungerar på samma sätt utanför den virtuella miljön. De grundläggande elementen som ingår i överföringen är individen och miljön. Faktorer som är relevanta i miljön och kan bidra till överföringseffekten är: instruktionssammanhanget, dvs fysisk och social miljö, vilket inkluderar undervisningen, stödet hos handledare och beteendet hos andra studenter och de normer och förväntningar som ingår; överföringsuppgiften och överföringssammanhanget [20]. Eftersom VR är nytt som forskningsverktyg och saknar genomgående testning är det virtuella överförings- och instruktionssammanhanget som försöksdeltagarna upplevt ovant och skiljer sig från deras vardag. Detta innebär att vi i vårt experiment inte har kunnat förutsätta att det ger samma resultat som det hade gjort om experimentet inte hade genomförts i en virtuell miljö. För att överföringseffekten ska gälla och inte ha negativa konsekvenser så gäller det att få till en smidig överföring. Detta innebär att både interna aspekter som kunskapsinnehållet, samt externa aspekter som miljöer och normer är lika varandra. Ett vanligt exempel på en nära överföringseffekt är att överföra kunskaper om latin för att lära sig franska då många ord och språkresonemang är lika varandra och i vissa fall till och med samma [21]. Tack vare en enkel experimentdesign så anser vi att vår studie har hög reliabilitet eftersom experimentet lätt kan återskapas och utföras med nya försöksdeltagare och troligen ge samma utslag. Tack vare användningen av VR-teknologi kan vi kontrollera miljön som experimenten har utförts i, vilket är en fördel när det kommer till reliabiliteten, speciellt i jämförelse med ett experiment i en naturlig miljö, där man inte har lika god kontroll på omkringliggande faktorer. Ett experiment som utspelar sig i en naturlig miljö går på grund av ovannämnda faktorer inte att återskapa med exakt samma förutsättningar för samtliga deltagare i en studie, och ger därför en sämre reliabilitet än en studie i en virtuell miljö, som vår. E. PROBLEM I PROCESSEN 1) Teori och experimentdesign: Ett problem vi stött på under processen har varit att försöka komma till bukt med vad som räknas som chunking och vad som inte gör det. Det tog oss ett tag att förstå hur vi skulle särskilja perceptuell chunking och semantisk chunking, vilket i förlängningen påverkade vår experimentdesign och det vi var intresserade av att undersöka. Vi kunde inte vara säkra på att det material vi presenterade för försöksdeltagarna alltid skulle upplevas som meningsfullt, vilket är nödvändigt för att perceptuella chunks ska skapas, så vi valde att byta experimentdesign. Vi valde att fokusera på semantisk chunking istället för perceptuell chunking eftersom det passar bättre för den typ av material som presenteras under vårt experiment. Semantisk chunking ska förstås som omkodning av information och är huvudsakligen en typ av mneomoniks [4]. Med semantisk chunking har vi hittat en metod som kan användas i inlärningssituationer, vilket var det vi var intresserade av när vi började med projektet. Vi valde att använda oss av första bokstavsmneomoniks och mer konkret akronymer eftersom många exempel på semantisk chunking i litteraturen byggde på just akronymer. Samtidigt är det en smidig metod att använda i praktiken om det skulle visa sig att semantisk chunking kan underlätta återkallandet av information. Det som återstår nu är att skapa lämpliga akronymer av materialet vi har i vår PowerPoint-presentation. 11
48 2) Teknik och implementering: Gällande utvecklingen av den virtuella miljön hade ingen i gruppen någon tidigare erfarenhet av utvecklingsverktyget Unity, och animerandet av karaktärer blev därför svårt. Eftersom vi ville generera våra egna elever med hjälp av Autodesk så gick det inte lika bra som då vi använde Unitys standardbibliotek med karaktären Ethan. Vi spenderade åtskilliga timmar på att förstå hur våra animationer skulle uppföra sig normalt utan att sväva fram i en så kallad T-pose. I en T-pose så håller karaktären armarna rakt ut och står raklång [24]. Till slut visade det sig att Unity kunde automatiskt generera ett skelett för varje karaktär vilket fungerade som en instruktion till Unity hur kroppsdelarna hänger ihop - detta får animationerna att röra på till exempel höger knä vid ett steg. Även vid animerandet av VR-kameran (för att åstadkomma en promenad i korridoren) uppstod vissa problem under vår inlärningsprocess, som till exempel att kameran vinklades åt fel håll eller snurrade runt. Efter att animationen färdigställts uppkom även ett nytt problem: användarens förmåga att själv titta runt i miljön försvann - något som löstes i efterhand. Ett annat bekymmer var att det krävdes en hel del sökningar i Unitys Asset store och modifierade av objekt för att få ordning på de föremål man önskade till klassrummet. Det var svårt att hitta saker som kunde passa i ett klassrum bara genom att välja bland de objekt som var gratis. En stol som var smutsig och nedgången var den enda modellen som liknade en klassrumsstol, och den fick därför modifieras och bli helt svart för att kunna användas. Mycket småsaker som vi hade haft med i ritningen såsom bärbara datorer, anteckningsblock och lampor fanns inte att få tag på alls, vilket gjorde att klassrummet blev något mer avskalat än vi hade tänkt från början (figur 3). 3) Sammanfattning: Under arbetet med projektet har vi stött på två övergripande problem som följt oss genom processen: teoretisk förståelse för vad semantisk chunking innebär och implementationsproblem. Det var viktig att redovisa och sammanställa vad semantisk chunking är för något på ett sätt som gjorde så att alla gruppmedlemmar förstod konceptet och hur det kan användas i praktiken. Att få alla gruppmedlemmar att begripa vad semantisk chunking är var ett av de större problemen under projektets gång eftersom gruppmedlemmarna hade olika bakgrund och förutsättningar att ta till sig informationen. Detta ledde till en del missförstånd som fördröjde den praktiska utvecklingen av ett konkret experiment och även en del problem med rapportsammanställningen. Det största problemet med implementationen och det tekniska var att få de animerade karaktärerna att röra sig som vi ville på ett naturligt sätt. Det var viktig eftersom det är viktigt att ha verklighetstrogna karaktärer för att få miljön att upplevas som så verklig som möjligt- något som bekant bidrar till att höja den ekologiska validitet och effektivare överföringseffekt. Svårigheter med att animera kameran så att den flyger in på rätt sätt i början av simuleringen är ett annat prbolem vi stött på, men som inte varit lika kritiskt eftersom själva animationen inte var nödvändig för projektet. VIII. FRAMTIDA VISIONER OCH FÖRSLAG FÖR FORTSATT ARBETE Tidsramen, kunskapsläget och tillgängliga resurser satte vissa begränsningar för projektet. Om vi under optimala förhållanden skulle fortsätta med kontrollerat klassrumskaos och lärande i virtuella miljöer så finns det vissa punkter som måste förberedas och struktureras upp på ett bra sätt. Ett exempel är små detaljer i klassrummet som att elevkaraktärerna bör tilldelas datorer, ritblock och skor. För framtida visioner och förslag inom just VR-miljö så visade projektet på positiva resultat överlag. Att använda den VR-plattform som vi har designat inom andra projekt är fullt möjligt och då kan man kolla på andra saker än semantisk chunking och inlärning. Att använda en kontrollerad miljö med manipulerbara variabler, som vår miljö är, kan bidra till utbildning och forskning inom många olika områden och man kan utföra spännande studier som tidigare har varit svåra att genomföra. Det krävs studier med fler försöksdeltagare för att bättre kunna utvärdera värdet av att använda semantisk chunking i inlärningssammanhang. Vårt experiment skulle med mindre förbättringar kunna användas i en sådan studie, men även andra VR-experiment och experiment i verkliga miljöer skulle kunna användas för att vidare testa metoden. REFERENCES [1] JG Ballard, (1998). Theatre of Cruelty intervju av Jean-Paul Coillard i Disturb Ezine [2] Chang, L., (2016). Virtual reality is helping to bring the last of Auschwitz s war criminals to justice. (Besökt ) [3] Neath, I., & Surprenant, A. M, (2003). In Taflinger M. (Ed.), Human memory (2nd ed.). Canada: Vicki Knight. [4] Gilbert, A., & Boucher, V., & Jemel, B. (2014). Perceptual chunking and its effect on memory in speech processing: ERP and behavioral evidence. [5] Miller, G., (1955), The Magical Number Seven, Plus or Minus Two: Some Limits on Our Capacity fo Processing Information, Psychological Review Vol. 101, No 2. [6] Congos, D., (2006). 9 Types of Mnemonics for Better. Memoryhttp:// (Besökt ) [7] Aben, B., & Stapert, S., & Blokland,A., (2012). About the Distinction between Working Memory and Short-Term Memory. [8] Cowan, N. (2000). The magical number 4 in short-term memory: a reconsideration of mental storage capacity. Behav. Brain Sci /S X [9] Verwey, W. B., & Eikelboom, T. (2003). Evidence for lasting sequence segmentation in the discrete sequence-production task. [10] Cummings, J.J., Bailenson, J.N. (2015). How immersive is enough? A meta-analysis of the effect of immersive technology on user presence. Media Psychology, [11] Blascovich, J., & Bailenson, J., (2005). Immersive Virtual Environments and Education Simulations. In Cohen, Portney, Rehberger, Thorsen (Eds.) Virtual Decisions: Digital Simulations for Teaching Reasoning in the Social Sciences and Humanities. Mahwah, New Jersey: Lawrence Earlbaum Associates, Inc. [12] Williams, Y., (2001) Ecological Validity in Psychology: Definition & Explanation. Chapter 11. [13] Won A. S., Perone B., Friend M., Bailenson J. N.,(2016). Identifying Anxiety Through Tracked Head Movements in a Virtual Classroom. Cyberpsychology, Behavior, and Social Networking. 19(6): [14] LoBiondo-Wood, G., & HaberNursing, J., (2014). Research: Methods and Critical Appraisal for Evidence-Based Practice, Chapter 15: Reliability and Validity: Elsevier Health Sciences. 12
49 [15] Meilinger, T. & Vosgerau, G., (2010) Putting Egocentric and Allocentric into Perspective. Germany. [16] L. Rebenitsch, (2015). Managing Cybersicknessin Virtual Reality. Crossroads. Vol. 22 Issue: 1 p46-51, 6p [17] Attree, A. E., Brooks B. M., (1996). Memory processes and virtual environments: I can t remember what was there, but I can remember how I got there. Implications for people with disabilities. [18] FaceFX, (2016). (Besökt ) [19] Karner, J., (2016). Specs comparison: Playstation VR, Oculus Rift, HTC Vive, and Gear VR,, (Besökt ) [20] Marini, A., & Genereux, R. (1995). The Challenge of Teaching for Transfer. In Teaching for Transfer: Fostering Generalization in Learning [21] Viviene, E., & Macaulay, (2000). C.Transfer of Learning in Professional and Vocational Education Routledge. [22] Chase, W. G., & Simon, H. A. (1973). Perception in chess. Cognitive Psychology, 4, [23] Egan, D. E. & Schwartz, B. J. (1979). Chunking in recall of symbolic drawings. Memory and Cognition, 7(2), [24] Cineversity, (2016). T-pose. (Besökt )
50
51 Smart Interaction in the Internet of Things Eva-Maria Ternblad Lisa Silfversten Niclas Lövdahl Nabiel Elshiewy With smart objects increasingly introduced into the growing ecology of the Internet of Things, human interactions need to cope with the smartness of these objects. Looking into human cognition issues, its assets and its limitations, the reported work is describing our view and proposed possible scenarios for effective solutions. Using Virtual Reality Technology, a prototype has been implemented to demonstrate some of the reported proposals. The prototype, containing three types of interaction (pointing at objects, talking with and gazing towards objects and using traditional manual manipulations) has been tested by 21 persons to collect and evaluate real user experiences. Using NASA TLX methodology, no significant differences could be found between the different interactive patterns. On the other hand, the users ranked speech considerably higher than traditional manipulations. 1 Introduction The Internet of Things (IoT) is currently a hot topic of technical, social, and economic significance. Making use of vast expanding Internet connectivity, most everyday objects including products, goods, appliances, vehicles, industrial and utility components and many other objects are being combined with the promise to transform the way we work, live, and play. It has been anticipated that, by the year 2025, there will be as many as 100 billion connected IoT devices with a global economic impact of more than $11 trillion. The Internet of Things may, simply, be defined as a collection of pervasively present things/objects connected through a large-scale communication network used for identifying, locating, tracking, monitoring and managing exchange of information between people and things as well as between groups of smart objects connected to the network. Development of IoT technology makes use of, e.g., radio-frequency identification (RFID) tags, wireless sensor networks, embedded intelligence technology, mobile communication and nanotechnology. In addition, computing economics, advances in data analytics, and the rise of cloud computing are heavily contributing to advancing the establishment of IoT. Smart Objects The main characteristics of smart objects in the Internet of Things include: Communication and cooperation: Objects are connected with the internet or with each other and can evaluate data. Addressability and identification: Every object can be addressed within a network and can be uniquely identified. Sensing: Sensors integrated into objects, enable data collecting about the environment. This data can be saved, processed or transferred. Actuation: Actuators included into objects, allow to affect their surrounding (for example converting electronic input into movement). Embedded information processing: Objects can store data by the use of embedded microprocessors and chips. Localisation: Smart Objects can store their own position in the environment and their location can be identified. User interfaces: Smart Objects possess a direct or indirect interface via which the user can manipulate them or access their data. Research Agenda The notion of a hyper connected and complex world of digitalised smart objects is not, according to our point of view, a futuristic vision that humans will be able to embrace or renounce according to their own liking. On the contrary, today s rapid technological advancements makes it possible not only to record and present loads of information in day-to-day objects, but also to introduce ubiquitous interfaces and transform human-computer interaction in a fundamental way. In this regard, it seems fairly possible that we, as human beings, ought to be able to communicate with objects around us in the same way as we do with other people, by speaking or gesturing, by moving in different directions, or by the use of attention and body language. But does this really work? Do we have sufficient knowledge about the cognitive structures that underlie human to human interaction to realise these ideas? The goal of this project is to address this kind of questions by designing and implementing a set of possible future interactive patterns and test them in a Virtual Reality environment. By quantitative as well as qualitative measures we hope to compare different approaches and get more insights in the complexity of IoT interaction. The study focus on explicit interaction between users and IoT-objects in a defined context, and adequate solutions are sought by analysing existing models as well as testing and implementing new ones. The rest of the report is structured as follows: First, a background overview is given, describing the state-of-the-art of cognition-based interaction design and presenting some of the modern cognitive theories applicable to the task at hand. Next, the methodology is described, presenting the design process together with different types and aspects of interaction. The following chapters present the two main design phases, start- 1 (15)
52 ing with a set of low-fi prototypes and ending with the implementation of the interaction models in the VR environment. Finally, the strengths and flaws of the models are evaluated through a comparative test, after which the results are discussed and explored in regard to cognitive theories and research in human-computer interaction. 2 Interaction and cognition in IoT The creation and connection of smart objects in transparent networks creates a need for new interaction mechanisms as well as profound knowledge of human cognition. To be able to place the presented study in a larger context and to get an overview of the current propositions regarding interactive possibilities, the state-of-the-art of the research field is described in the passages below together with cognitive and design oriented theories. Interaction Mechanisms: State-of-the-art One of the issues with a future world with billions of IoT-objects are how to handle the myriad of possible interfaces, screens, applications or devices necessary to manage and control each and every product. Several efforts have been made to tackle these problems, leading to a series of more or less cognition-based human interaction models, suitable for the Internet of Things. Some promising approaches include: Embedded interaction (Kranz et al., 2010), by which interactive facilities are integrated into existing objects and environments rather than using specialised interaction devices. The embedded functionality should not radically change the object s look and function and the user should be able to identify and use the enhanced object in a potent way. To enable reduction of cognitive load and better performance, Kranz et al (2010) emphasis the use of multimodality when embedding interactive styles. Cognitive Objects (Möller et al., 2011), by which a physical object, embodied with intelligence, may cognitively sense, compute, react, and interact with the environment. Computational capabilities of the object can be either embedded (processing and memory storage are built into the object), augmented (a specialised computational device is connected to the object) or external (the object performs computation through networked communication with an external computational facility, e.g., a cloud service). Proximic Interactions (Ballendat et al., 2010). Here, proximity is used to indicate availability, which in turn enables the discovery of smart objects making use of fine-grained, realtime information on the continuous movement of people and objects in the environment. Egocentric interaction (Surie et al., 2012) is a model using bodily states and attentional mechanisms as a base for predicting actions and supporting interaction. The body and mind of a specific individual here act as the centre of reference in all aspects of the model. It extends the classical HCI user-centred approach by additionally providing situatedness, attention to the complete local environment, proximity as well as the agent environment relationship. Blended interactions (Jetter et al., 2013) constitutes a framework to explain why an interface is perceived as natural (or not) and is based on the concept of blending, which is derived from the theoretical cognitive concepts of embodiment, metaphors and mental spaces. According to Imaz and Benyon (2007), a blend or conceptual integration is created by combining two input spaces into a third one, and in this regard blending could be described as a composition of a series of intermediate steps. Blended interaction (Jetter et al., 2013) consequently combines reality with computational power, combining the virtues of physical and digital artifacts so that desired properties of each are preserved and computing is integrated in a considered manner. It is based on non-traditional post-wimp (Windows, Icons, Menus, Pointers) interaction styles, e.g., pen-based, multi-touch, and tangible user interfaces. Tangible and gestural interactions (van den Hoven & Mazalik, 2011) could be useful as an efficient mean of communication when managing smart objects. Although based on different principles, they both exploit our body awareness and our sensorimotor skills to provide a richer and more intuitive interaction. According to van den Hoven and Mazalik (2011), gestural interaction can blend into a tangible gestural interaction by involving physical artefacts. Moreover, the use of embodied metaphors in interaction has been shown to facilitate the understanding of an embodied interface without visible clues (Antle et al., 2009). Pointing has been an interaction model of interest since the 1980 s, when the put-that-there interface were introduced by Bolt at MIT (Bowman et al., 2005). Since then, several pointing techniques have been developed for virtual environments, making use of different tools in three or two-dimensional spaces (e. g. ray-casting, flashlights or image-planes). Interacting by pointing are commonly seen as advantageous compared to virtual hand-based techniques, although it has limitations in regard to positioning objects as well as aiming at small or distant ones (Bowman et al., 2005). Finally, Eye-controlled interaction has been a farfetched dream for interaction designers for centuries, not only within ubiquitous computing or augmented reality, but also within rehabilitation engineering (Holmqvist et al, 2011). Interestingly, a number of breakthroughs has been made in is field during the recent years, leading to promising interactive possibilities. One example is the use of nystagmus patterns in scrolling (Jalaliniya & Mardanbegi, 2016), another is the implementation of eye-tracking techniques in augmented and virtual worlds (Wolinski, 2016). This latest three dimensional novelty does, according to its spokespersons, allow fast and seamless control of a digital device through movement of only the eyes, a functionality that actually will transform intent into action (Wolinski, 2016). 2 (15)
53 Cognition-based Interaction Design Interaction design focuses, in general, on the design of how objects behave according to the user s expectations and how the user-facing functions of the object are organised. However, the interaction between humans and objects also could be defined as the solving of specific step-wise goals, situated both in space and time. Following Ledo et al. (2015), we may identify four main steps or tasks that have to be fulfilled in the ubiquitous computing ecologies of IoT: (1) Discover objects. The discoverability of smart IoTitems depends on how objects are presented in the environment and what makes those objects discoverable. (2) Select a particular object. The user must be able to choose an object of interest among a large number of those available. (3)View object status. Information about the current state or behaviour of the object has to be perceived by the user. Information may include changes and state transitions caused by actions and controls, or historical information regarding the object s activity and performance. (4) Control the object in a pertinent manner. This is the case when changes in states and behaviour of an object require user intervention, a mode which may be facilitated by viewing the current state and knowing how to transfer that state into a different one. One or more of the cognitive processes that may be used by humans to achieve such tasks include attention, perception, memory, learning, problem solving, planning and decisionmaking. Information about available objects in the environments can be acquired by perceptual mechanisms such as vision, hearing, touch and/or smell. To discover an object it should therefore be equipped with some perceivable attributes, such as visible, hearable or tangible qualities. To select an object requires knowledge about the object s affordances, perhaps provided by the object itself. It also requires memorised knowledge about the object s functionality. The user may also need to access external information to be able to select objects correctly. State viewing and control also rely on either memorised or acquired knowledge about the object s affordances functionality and control facilities. Cognitive Theory The present work is based on two fundamental theoretical approaches: First is the view on human cognition as heavily reliant on a receptive as well as an expressive body, oriented towards acting in the real world together with other human beings. Second is a pragmatic perspective on human-machine interaction as being unpredictable and at least to some extent - driven by circumstances outside of a well-defined technical and task-specific context. As humans we do not only have brains with sophisticated neurological circuits, but also limbs and torsos, faces and visceral organs, every second providing us with information about ourselves as well as the nature of objects that surround us. The paradigm of embodied cognition hereby embraces the idea of human thinking as rooted in physical interactions with the surrounding world and assumes human communication not only to consist of linguistic information transferred between passive receptive agents, but also to be created in the specific context through gestures, facial expressions, tone of voice and mimicry (Allwood, 2011). One of the most central theoretical standpoints is that human off-line cognition (such as memory retrieval, planning, decision making and abstract problem solving) is bodily anchored (Wilson, 2002; Johansson, Holsanova & Holmqvist, 2013). This means, in short, that even higher cognitive abilities involve senso-motorical functions and can be described in terms of multimodal simulations of real and physical situations (Wilson, 2002; Pulvermüller, 2005; Johansson, Holsanova & Holmqvist, 2013). As we already have stated earlier in this report, human thinking and problem solving rarely takes place in solitude, without the presence of a physical environment or tangible objects within reach. On the contrary, most real-life problems are resolved by the use of tools, contextual cues and means of communication, not seldom together with other fellow human beings in a socio-cultural context. It can be argued that the processes that operate in this kind of interactive and actionoriented environment not only consist of a passive information transfer between separate entities, but also of transformations of the information itself (Hutchins, 1995). By the use of language, graphical visualizations, hand-held objects or motor-schemas, information content can be manifested and transformed, optimizing the resources and rationalizing the goal-oriented process for the entire cognitive system (human agents, tools and context) as a whole (Hutchins, 1995; Norman, 2013). Hence, by analysing and describing cognitive processes as distributed within a larger system, it becomes possible to make visible functional relationships between the included entities. Another important advantage is the possibility of analysing representations of different formats and to explain the utilised artefacts impact on various thought processes and decisions (Hutchins, 1995; Hollan, Hutchins & Kirsh, 2000). When it comes to interaction, humans often seem to act on objects intuitively, as if they were directly perceived without processing any larger amount of information. A psychological approach which tries to explain this kind of behaviour (Gibson, 1979) emphasizes that human perception somehow is tuned towards interaction with physical surfaces and objects, and that the affordances of these items in turn shape the human perception and thoughts about them. Another view of interaction would be to address the meaningfulness and ready-to-handiness different objects have in relation to a user in a specific context, and to embrace Heidegger s philosophical and phenomenological standpoint that interaction always is a result of a goal-oriented process (Wheeler, 2016). Heidegger also describes common interfaces 3 (15)
54 as transparent for the experienced user and means that the interactive features really only become exposed and dealt with on a conscious level when something unexpected happens. Hence, interactive experiences can be completely different even though the interface and tool remain the same. 3 Method Designing interactive models for IoT involves setting up boundaries, specifying limitations and choosing appropriate working processes and evaluation methods. Due to the unpredictable and futuristic nature of the task at hand, the work has been highly explorative. However, the project has been pursued in a methodological manner with the use of well-known strategies within the field of user centred design and human machine interaction. These are described in the passages below. in the VR setting, and the possible technological requirements or specifications are not investigated further. In other terms, we have embraced the following design principle: In early stages of design, pretend the interface is magic. (Cooper et al, 2007, s. 122). One of the main goals has also been to fully implement the proposed interactive patterns in VR, and to avoid so called Wizard of Oz-solutions when testing them (this kind of prototyping uses a human wizard that performs tasks and simulates the behavior of the completed system, see Dahlbäck et al., 1993). The entire working process could also be described as a funnel, starting with a wide range of interactive possibilities and ending with a few specific and testable patterns (see Fig. 1 below). This process is explained in greater detail with the help of a flow chart in Appendix A. Choice of context To address the research questions presented in chapter 1, there is a need for descriptions of concrete settings, not at least for making testable and comprehensive scenarios (Cooper, Reimann & Cronin, 2007; Carroll, 2000). The scope of the project has therefore been restricted to a smart-home context, a methodological choice with two major advantages: The environment is familiar and easy to connect to (not at least for test persons). The objects and devices within such a context are likewise well-known, even though not all of them possess any advanced technology today. Hopefully, by applying the possibilities of IoT into daily used products, over-optimistic attitudes towards the new technology will be reduced. This aspect is essential for making realistic evaluations of the designed model, and also for avoiding making assumptions about preferences that are not truly grounded in the test persons own experiences. Finally, it widens the group of possible test candidates, and makes it possible to recruit people from all ages and backgrounds. The design process The project has been executed through an iterative and overlapping design process where literature and article reviews, creative methods and VR programming have been exercised in parallel. Subsequently, by a successive knowledge- and information transfer, the different work areas have together gradually not only defined and shaped the different bricks and pieces of the model, but also placed the bar for the obtainable complexity of the model an aspect that has been heavily reliant on the preconditions of the VR environment as well as the limited resources for the project at hand. During the entire project, the user s needs, preferences and limitations have been in focus while the technological aspects of a future IoT-system have not. On the contrary, the presented interaction patterns are assumed to work as well in real life as Figure 1. An overview of the design process Aspects, stages and types of interaction To be able to address the complexity of prospective IoT interaction models, the necessary elements and building blocks have to be identified. Such a structure has been presented in chapter 2 above through Ledo et al s (2015) definitions of the four different stages of interaction: Discover, Select, View status and Control. This categorization have several advantages since it makes it possible to study and evaluate specific interactive strategies and user-related issues one at a time, and by dedicating different interaction patterns to discrete phases any gaps between actions will hopefully also be noticed, as well as possible overlaps between events. In addition to phases or sequences, it is equally possible to categorize interactive patterns in terms of their explicit or implicit nature, and it could also be of interest to specify the origin of the actual action at hand (some events could, for example be due to the user s explicit actions, while other could originate from a self-learning system). In Fig. 2 below, a diagram is presented where it is possible to categorize interactive patterns according to these criteria. The purpose of such a structure is to clarify and define the analysed and proposed interactive models that have arised during the different phases of design process. 4 (15)
 and Surie et al.")
55 Figure 2. A categorization of different interactive possibilities within IoT. It should be noted that proximity is not handled as a parameter of greater interest in our model, and consequently it has not been studied further. Even though Ballendat et al. (2010) and Surie et al. (2012) show that closeness to objects and directions of movement could be used within IoT-interaction, we have chosen a different path. One of the reasons is the limited surface in the VR environment (the user can only move around within a couple of square meters), making it hard to implement sufficient interactive areas around objects. We also believe proximity to have strong limitations in a future rich environment with a myriad of smart objects, of which some need to be controlled from a larger distance (e. g. ceilingmounted lamps), while others will benefit from hands-on manipulation. Finally, a strategy applied in regard to the VR implementation has been to isolate scenarios for unique interaction patterns (the use of voice, gestures, attentional mechanism, etc.) within each of the four phases described by Ledo et al. (2015). By focusing on simple interactive settings the practical programming work has been greatly facilitated. total, six informants (one male and five women) were recruited within the project members social network. The test persons were between 17 to 52 years old, had different backgrounds and at least to some extent - different experiences in regard to smart systems. Two of the informants were students with explicit knowledge of interaction design. Each one of the participants were requested to read a series of scenarios (five in total) and for each scenario show how they would prefer to interact with daily and well-known objects, envisioning the interface as totally transparent and the system as responding to their gestures, verbalizations or general behaviour. To prime the participants they were placed in a standard living room where the main part of the objects (although not smart or sophisticated) were close at hand and fully visible. They were explicitly asked to interact with the objects or functions (TV, stereo, lights and lamps, coffee-machine, ventilation, heating system or a combination of them in a party setting ) and instructions such as communicate with or talk to were deliberately avoided. They were neither given examples of possible interactive patterns nor any feedback during their performances, and the order of the scenarios shifted among participants to diminish the influence of possible sequential effects. The scenarios are reported in full in Appendix B (in Swedish) and the investigated types of interaction are presented in Fig. 3 below. 4 Low-fi prototyping (1st phase of design) Before advancing in the VR programming and by that setting the direction for possible and useful interaction patterns, a set of low-fi prototypes and scenarios were tested by a limited number of users. These initial explorations turned out to be a very important part of the process, showing us the limitations of human based interactive possibilities (such as gestures, speech and attention) as well as different personal preferences. User observations in an imaginative smart living room As an initial explorative step, a user observation was made in an imaginative smart living room setting. The main purpose of this test was to gather information about users intuitive interaction in a natural and adequate environment and to compare and evaluate individual and unanimous preferences. In Figure 3. Investigated types of interaction during the first user observation. The test session ended by asking the informants to fill in a simple questionnaire where they had to state their interactive preferences (see Appendix B). The test persons were documented with a stationary camera while performing their interactions sitting in the living room sofa (the participants approved to this by filling in an informed consent, see Appendix C). An example of a test person interacting with an imaginative lamp is shown in Fig. 4 below. 5 (15)
 was utilised, a standard procedure within the field of usability testing that is considered to be both reliable and cost efficient (Barnum,")
, we concluded that the benefits from this method outweighed the disadvantages.")

56 Figure 4. Imaginative gestural interaction from initial test. During the test a concurrent think-aloud protocol (CTA) was utilised, a standard procedure within the field of usability testing that is considered to be both reliable and cost efficient (Barnum, 2011; Nielsen & Pernice, 2009). Being well aware of that the question about whether CTA affects user performance or not has been debated over several years (Herzum et al., 2009; Holmqvist et al., 2011), we concluded that the benefits from this method outweighed the disadvantages. Asking the participants to share their ideas and thoughts with us made it possible to retain valuable tacit information. After all sessions were completed, the films were analysed collaboratively within the project team, and different interactive preferences were quantified and categorized according to Ledo et als (2015) stages of interaction (see Appendix D). Importantly, both implicit interaction patterns as well as explicit and motivated choices were interpreted and calculated. One reason for this is that gestures on their own can contain important verbal unspoken information (Goldin-Meadow & Wagner Alibali, 2013). Since some of the informants used implicit gestures and expressions excessively while others did not, and since some of them expressed multiple choices while others had limited imagination, the analyses contends a certain amount of skewness. Equally, certain scenarios have gained more weight than others, a fact that is also due to how easy it was for the test persons to relate to the different descriptions of specific objects and situations. The analyses of the first user observations resulted in a limited number of preferable interaction patterns for the described stages in Fig. 3 above. Focusing on gaze, pointing gestures, voice and hand movements, these results can be summarized as follows: All users showed specific individual interactive preferences that they maintained throughout the session, although neither of them stuck to one specific interaction pattern entirely. For selecting an object, all users used gaze as an attentive instrument. Additionally, all users also, at least to some extent, used pointing gestures for selecting and/or turning on objects.. For increasing and decreasing volume or light intensity, hand gestures were consistently used. Primarily they were performed by moving the right hand up and down, but turning the wrist (as rotating an old-fashioned round control button) was also an alternative. Some of the informants explicitly preferred using their voice to select and control objects, especially when the goals were easy to specify, such as turn on the TV or set channel three. Interestingly however, the limitations of speech were also consciously noted by these users when describing relations, such as higher, more or less, and by consequence they sometimes switched from speech into gesturing. The expressed need for automaticity or context awareness primarily concerned indoor climate (ventilation and heat) and lighting (with the use of motion detectors). Regarding the party setting, the informants mentioned pre-programming possibilities for setting lighting and music for special events, but did not manifest any interactive patterns. Rapid prototyping and internal evaluation Some of the basic elements from the first user observation were transferred into a Low-fi paper based prototype with the following objects and devices: TV, stereo, coffee machine, lamp and smartwatch. The objects were designed with individual interactive preferences and a certain amount of feedback and visualized information (see Appendix E). This internal evaluation (two of the project members made the prototype while the other two performed a quick and informal test) served two purposes: First of all we wanted to evaluate the possibility of using object specific and affordance related interaction patterns that varied between objects. Secondly we wished to test feedback alternatives through the use of a smartwatch device in relation to explicit visualized information on the objects themselves. The categories and stages of the investigated interactions are presented in Fig. 5 below. Figure 5. Investigated types of interaction during the internal low-fi prototype evaluation 6 (15)

.")

57 The two test persons performed a set of scenarios similar to those in the user observation described above, with the difference that the interaction patterns were predetermined in the prototype and that a certain amount of feedback also was presented. These scenarios were described orally together with instructions about gestures for selecting or controlling the objects (for a description of the interactive possibilities and the performed scenarios, see Appendix F). This informal test verified the usefulness of the interactive gestures obtained in the first user observation, but also made the difficulties with visualizing object specific choices and presenting feedback very clear. These findings can be summarized as follows: The use of object-specific interactive patterns was problematic. First of all, the icons were not always interpreted correctly, and more than one time they created confusion. Secondly, the user did not seem to consider an IoT-object s functionality or affordances when interacting. Presenting the status of an object was not easy. For instance, the sleeping state was completely ignored by one of the users in our test. Gestures were highly individual. The presentation and timing of feedback while gesturing was important. An example on pointing from this test is presented in Fig. 6 below. The model implemented in the VR environment consists of a number of basic elements and is fitted into a virtual smart home living room setting (see Fig. 7a-c below). The programming has been performed in Unity ver 5.5.0f3, while the testing and evaluation has been done using a HTC Vive equipment consisting of a visual headset (without auditory support) and hand controls. The virtual living room is approximately experienced as 10 by 10 meters large while the physical space obtainable for the user only has been 9 square meters. The resolution of the screen is 2160x1200 (1080x1200 per eye) and the used frame rate has been > 90 frames per second, rendering the user a sufficient realistic experience without delays or visual discomfort. Figure 7a. A drawing of the virtual living room Figure 6. Pointing on a TV-prototype, internal test 5 VR implementation (2d phase of design) Virtual Reality technology (VR) makes use of computers to provide visual, acoustic and tactile simulations of a three-dimensional virtual world, giving the user the sense and feel of immersion in a real world (Fuchs et al., 2011). Reality refers mainly to the physical or functional things/objects existing in the world, while Virtual means that those things are computer generated. In virtual reality environments, the human is operating, interacting and taking control of that environment using special devices (e.g., head-mounted displays, 3-D glasses, electronic wands or tactile gloves). Figure 7b. One view of the virtual living room Figure 7c. Another view of the virtual living room 7 (15)

58 The chosen interactive patterns (looking, speaking, pointing, lifting hands and manipulating) and the smart IoT-objects (tv, lamps and pot plants) have mainly derived from the outcomes of the prototypes and observations together with explorative programming work in short iterative cycles. Although these choices also are grounded in knowledge within the field of interaction design and cognitive theory, the limited research on VR as well as on IoT-interaction makes the usability and applicability of all interactions highly unpredictable. Consequently, the focus has been to construct a simple but realistic environment and implement a limited number of comparable and testable interactive patterns. These patterns are described according to the interactive stages stated by Ledo et al (2015) in the passages below and summarized in Fig. 8 below. As this diagram reveals, mainly explicit and user related actions have been implemented. Figure 8. Implemented interactive patterns Note that the concept of our model is based on human behaviour, smart interactive objects and a smart-watch technique for feedback (as tested in the informal test described in the chapter above). We have deliberately avoided all kinds of augmented reality techniques, a choice that we hope will make the model both realistic and equipment independent. Discover Device To discover smart IoT-objects, the user lifts the right hand above the head (see Fig. 9 below). This movement could be compared to a show of hands, a gesture used worldwide in classrooms or at public meetings for asking permission to speak, wanting help or voting. It is equally often used for reaching someone s attention (in a restaurant, for instance), signalling a need for assistance. Since the gesture is common and well fitted to the discovering stage of interaction, it is presumed to be used with ease and expertise an interactive situation that Norman (1993) refers to as an experiental cognition mode. As long as the user s hand remains above the head, all IoT-objects reply by casting a beam of yellow light, indicating their belonging to the IoT-family and showing that they are ready to be used and controlled accordingly. Figure 9. All smart objects are easily discovered by rising the hand By applying similar feedback from all IoT-objects, we utilize the pop-out effect, and the user can perceive and process information about a certain item rapidly at a low cognitive cost (the pop-out effect describes how single diverging objects easily are noticed within a larger group of objects in visual search tasks, see for example Ward (2010)). By revealing all IoT-objects simultaneously the user likewise have the opportunity to quickly evaluate the space around her as more or less wellequipped, facilitating decision making about further interaction. Since we also believe the user to be familiar with shining indicators as signifiers for functions and stages on electrical devices, this kind of feedback follows the design principle Obey standards unless there is a truly superior alternative (Cooper et al, 2010, p. 572). Finally, by only showing IoT-functionality momentarily (the user will probably not stay with the hand held high for very long) information overload and intrusiveness on the system s part of view are avoided. This level of visibility is in line with Krantz et al s (2010) guidelines which recommend to carefully choose when and where to display embedded information. In ordinary situations, it is also unlikely that the user will need to memorize IoT-functionality for a large amount of objects. And in that case, it is very easy to raise the hand once again. Note that we in our model let the items themselves (virtually) light up the specific areas. It is of course equally possible to use augmented reality techniques to get this effect an alternative we have chosen to avoid. Select and Control - Turning on/off The four phases of interaction presented by Ledo et al (2015), may, at a first glance, seem as a convenient way of separating different goals and loops of information (from user to object and back again). In reality, these stages are not always easily distinguished from one another, and using them strictly and uniformly for all IoT-objects could be perceived as both strange and unnecessarily complicated (it is probably not reasonable to select a lamp without turning it on or off, for instance). Consequently, in the present model Select and Control have been merged into Turning on/off devices. If the object at hand cannot really be switched on (such as the pot 8 (15)

59 plants in the actual VR environment) this function only provides feedback and report object status. For turning on or off IoT-objects, the user can mainly use pointing or speech together with gaze. Pointing is an interaction pattern that is cognitively anchored for humans in all cultures. It is also a deictic gesture, normally learned by infants between 8 and 12 months old where it serves as a context-sensitive pronoun like this or that (Goldin-Meadow & Wagner Alibali, 2013). The motion is considerably important for reaching joint attention, complementing verbal descriptions and facilitating understanding during conversation (Louwerse & Bangerter, 2010). In addition, it is considered to decrease cognitive load for the agent who s actually pointing, and people tend to point at things even if no one is observing them (Cappuccio et al., 2013; Goldin-Meadow & Wagner, 2013). In the existing VR environment, pointing is performed by directing the right or the left hand control towards a chosen object and pressing a control button. This command animates the active virtual hand into a pointing gesture (see Fig. 10 below) and sends an invisible laser beam towards the actual object. Figure 10. Animation of pointing gesture For the chosen object to be activated, the laser beam (although invisible) has to hit the item within a defined area, equal to or slightly larger than the object s physical boundaries. Since pointing is not easy to perform in an exact manner (neither in VR nor in reality), the purpose of these spaces is to facilitate the interaction. The exact measures around each object have been decided after iterative implementation and testing cycles. Unfortunately, the scaling of the designed spaces in Unity are not easily translated into virtual and experienced measures (still, two sketches of the areas around the lamps and pot plants are presented in Appendix G). Finally, it is important to point out that the use of hand controls not is the same as pointing with hands or fingers, although we here rely on a certain rubber hand effect as the user gets acquainted with the tools (for the rubber hand effect, see for example Ward, 2010). Gazing and Speaking will also activate objects in the existing VR model, a cognition-based choice since fixating something with one s eyes signalise object related attention and interest. There are likewise a strong correlation between fixations and cognitive processing of visual information, something that Just and Carpenter has described as the eyemind hypothesis (Holmqvist et al., 2011). Additionally, humans tend to follow other people s gaze as pointers for interesting information (Gallup et al, 2012), and we usually look into each other s eyes when having a serious or intimate conversation. However, to use gaze as an instrument for selecting or controlling objects is not easy. First of all, the human eye is almost never still, blending longer fixations and saccades into complex patterns (Holmqvist et al, 2011). Secondly, it is quite possible to scan an environment or to briefly look at objects without having any deeper interest in them. When it comes to speech, this type of interaction has other problematic qualities. Choosing a single proper representational format for an interface without screens or control panels, the spoken word is often assumed to be the best and most comprehensive. However, oral instructions contain strong limitations, both in regard to their temporal solution (they do not last) and their one-dimensionality (only one thing at a time can be described) - conditions that inevitably affects working memory for both speaker and listener (Hutchins, 1995). Speech could most certainly be used for very specific and precise goals, such as TV on or light off, but it is by no means optimal for describing spatial relations ( Turn on the lamp which is to the right of the sofa and 2 meters to the left of the chair ) or for relative settings ( A little more light, please ). Hence, our proposal is to use gaze together with voice to activate objects, making the eyes the selecting part and the speech the controlling part. However, since the used VR equipment neither supports eye-tracking nor voice control this interactive pattern has been simulated with a Wizard of Oz solution (see chapter 6 below). We have chosen identical and extremely easy commands for all implemented smart objects, namely PÅ for turning objects on and AV for turning objects off. Finally, the four lamps in our VR-model can also be controlled by traditional switch buttons mounted on the wall. This implementation makes it possible to compare traditional and futuristic ways of interaction even though it is important to point out the fact all interactions are virtual. Touching objects in VR is very different from doing it in reality, although vibrations are used for simulating surfaces and tactile responses. View status The user needs to feel, see or otherwise perceive the object s status and to get feedback from the interactive actions (Norman, 2002). In the presented model, some of the objects (such as TV and lamps) change and reveal their status themselves when the user is controlling them (turning on/off etc). As a final component, we have also introduced a smartwatch for displaying information. The watch is situated on the user s left wrist and presents feedback from the interactive objects (see Fig. 11a-c below). Presenting feedback in this manor could be described as a sort of peripheral interaction, easy to ignore (if not needed) but still easy to attend to. The feedback lasts four seconds and is shown independently of the used interactive 9 (15)
 Figure 11c.")


60 model (that is, pointing, gazing/speaking or using the traditional switch buttons). Figure 11a. Feedback from lamps (On and Off) Figure 11b. Feedback from pot plants (Needs water and Sufficient water) Figure 11c. Looking at feedback from one of the pot plants 6 Testing the models In addition to implementing a set of possible interaction models in Virtual Reality, one of the goals for the specific project has been to evaluate and compare the interactive patterns pointing, speech and gaze and traditional switch buttons - in regard to usability, user preferences and cognitive load. This has been accomplished by an experimental setup with a within subjects design, letting a group of participants perform a set of scenarios in the virtual living room described above. Experimental design 21 test persons were recruited by notifications on Facebook and through advertisements on public billboards at university faculties and cafés. The event on Facebook was shared with roughly 100 persons within the project members social network. The participants consisted of 12 males and 8 females, were between 19 and 61 years old and from various backgrounds (although 16 of them were students). 10 of them had at least in some regard - previous experience of VR while 11 of them had none. All participants were given a brief introduction to the project and its purpose and filled in a short questionnaire together with an informed consent regarding their participation and the use of collected data (see Appendix H and I). Thereafter they were introduced to the HTC Vive where they performed a quick training session in a very basic and minimalistic VRenvironment. The purpose of this exercise was for the participants to get acquainted to the fictive world and the virtual interactive patterns (pressing buttons and pointing at objects). Some views from the training environment (which turned out to be very useful) are presented in Appendix J together with a description of the performed interaction. After one or two rounds of training (mainly depending on the participants capacity of successfully pointing at objects), the informants were sent into the virtual living room. Here they were asked to walk around, discover smart objects and talk about their experience. Subsequently, they interacted with all of the four lamps in the room by turning them on or off in a specific order. This was done three times one time for each interactive pattern and after each interaction the participant responded orally to a NASA TLX questionnaire (see Appendix K). NASA TLX is a commonly used standard for evaluating system usability, although it is normally reported in writing. In this case, only the first part of the test was performed, why the resulting values are referred to as RTLX. For a thorough description of the conventional use and calculation of NASA TLX, see Hart (2006). To make the physical effort equal in all interaction models, each one of the scenarios were initiated by directing the user to a specific starting point (marked on the virtual rug by two foot prints, see Fig. 7a).To avoid sequential effects, the order of the interactive types were balanced and consequently the test as a whole contained all possible orders. Next, the participants were allowed to interact with all smart objects in the room, choosing one or several interactive patterns of their own liking, and verbally reporting the visual feedback from the smartwatch. The VR-session ended with a short interview regarding individual interactive preferences (the participants were asked to rank the three interaction types), perceived difficulties under the test and their general VR experience. Finally, the informants filled in a SUS Presence questionnaire - a common method for measuring the feel of reality and user immersion, see for example Usoh et al. (2000) and received coffee and cake as a reward for participating. The SUS presence questionnaire is presented in Appendix L. 10 (15)

61 Hypothesis and variables The purpose of the test was to explore if we could find significant differences between interaction models and to investigate the users preferences by the use of subjective measures. Consequently, the independent variable is the actual model of interaction, i.e. pointing, voice + gaze or pressing switch buttons. As dependant variables for measuring cognitive and physical load we have the NASA RTLX-values, (RTLX), and as dependant variables for measuring user preferences we have the individual ratings of interactive patterns, (RINT). The main null hypothesis is that the RTLX-values do not differ in regard to the type of interaction, a presumption which can be formulated as follows: H 0A : (RTLX, point) = (RTLX, voice_gaze) = RTLX, switch) The alternative hypothesis, which is to be rejected, therefore is: H 1A : (RTLX, point) (RTLX, voice_gaze) RTLX, switch) A corresponding null hypothesis regarding the user preferences is that the rankings of the interaction models do not differ either: H 0B : (RINT, point) = (RINT, voice_gaze) = RINT, switch) The alternative hypothesis is in this case: H 1B : (RINT, point) (RINT, voice_gaze) RINT, switch) Other variables that have been analysed are the SUS Presencevalues, the stated difficulties with certain types of interaction and comments on feedback. Analyses and Results The measurements were successful and all participants performed all moments without incidents or major problems. The training session were generally performed twice (6 test persons did it only once) and 8 of the participants needed to exercise the pointing gesture with the help of additional instructions and tips (for an example, see Fig. 12 below). The most common problem in this session was to point at a distant object, and 2 of the test persons had to practice with a visible laser beam to learn how to correctly hold and direct the hand control for a successful hit. Figure 12. Some of the participants needed assistance for learning how to point When performing the hands-up gesture, half of the participants were able to locate and identify all of the smart items quickly and without errors. Some users mistook the loudspeakers for IoT-objects, while others missed the pot plants or lamps. However, the gleam of light from the objects was correctly interpreted, and the hands-up gesture were easily remembered at the end of the test (all informants except one recalled the gesture without any further instructions). Regarding the reported ratings, the RTLX-values were generally very low for all interactive models, although the variances were rather high - see Table 1 below: Table 1: The RTLX-values for the different interaction models. Means and standard deviations. RTLX_button RTLX_point RTLX_voice_gaze Mean 2,11 2,48 1,71 Std dev 1,55 1,85 1,18 A one-way ANOVA for dependent measures shows, not surprisingly, no significant relation between the reported RTLXvalue and the corresponding interactive pattern: F(2,57) = 0.26, p = Since the calculated p-value is too low, no paired t-tests have been performed. The insignificance of the reported RTLX-values could, of course, be interpreted as if no differences in cognitive, physical or emotional load between the interaction models were to be found. Another conclusion is that the used NASATLX questionnaire wasn t the most appropriate for the performed tasks. This is discussed further in chapter 7 below. Regarding the individual rankings, the differences between the interaction models were slightly larger: Table 2: Order of priority (values of 1, 2 or 3) for the different interaction models. Means and standard deviations (note that low values correspond to high rankings, and vice versa). RINT_button RINT_point RINT_voice_gaze Mean 2,4 2,1 1,5 Std dev 0,6 0,8 0,8 11 (15)

62 A one-way ANOVA for dependent measures here shows a significant relation between the reported RINT-value and the corresponding interactive pattern: F(2,57) = 3.2, p = A following paired t-test results in a significant difference between the RINT_button and RINT_voice_gaze. Even with a Bonferroni correction, the p-value is here estimated to Evidently, the interaction type with voice and gaze is preferred prior to the traditional pressing on switch buttons. On the question What did you think was the most difficult in the entire test? the majority of the test persons replied To point at distant objects. Other responses referred to feedback or interactive possibilities in general (see Fig. 13 below). several participants got confused and interpreted their interaction as unsuccessful. The result of the SUS Presence questionnaire - as a measure of the general feeling of reality and immersion in the fictive world - resulted in a total mean value of 5.2. Since the maximum value is 7 for all of the 6 questions, this has to be considered a relatively high rating (the actual usefulness and validity of the SUS Presence measure has, however, been a subject for discussion, Usoh (2000)). To analyse if the user experience could depend on previous use of VR equipment, the group of participants were divided into VR novices (completely naive and with no experience of virtual reality) and VR veterans (with at least one experience of virtual worlds). The results are presented in Fig. 15 below. Figure 13. Responses regarding difficulties in the test. Interestingly, although speech and gaze were explicitly preferred and pointing was not always easily performed, many of the participants actually chose pointing as their main model of interaction in the free phase of the test (where they could choose interaction type according to their own liking). The diagram below shows the highest ranked interaction models together with the ones actually used during the phase with optional interaction. Figure 14. Preferred interaction models in the free interaction phase. The feedback from the smartwatch was generally quite well understood, although several of the informants forgot to look at the watch when interacting with the pot plants. One reason for this could be the lack of feedback from the plants themselves. Since these did not confirm the interactive gesture by changing their visible state (similar to the TV and lamps), Figure 15. SUS Presence for different users A one-way ANOVA for independent measures shows a significant relation between the amount of previous VR experience (none or some) and the Presence-values: F(1,19)=11.9, p= A consecutive T-test also verifies that the difference between group mean values (5.82 and 4.63) is significant: t(18.4) = 3.44, p = Discussion The project at hand has been realized in order to investigate interaction patterns in a future world of smart IoT-items, and to evaluate these models cognitive and physical effects when performing simple tasks, such as turning off and turning on objects. The findings are not homogenous, something that not only could be due to the tested models themselves but also to the VR environment and its surrealistic appearance, to the used measures or to the simplified scenarios and the sparse information in the virtual scene. These issues are discussed under the passages below, together with reflections regarding the complexity of IoT interaction, where all communicative choices will set the boundaries for the user s possibility of reaching and interpreting information. Learning the system or learning the user? The usage of more or less transparent interfaces will, without doubt, force the user to learn a set of new and perhaps unfamiliar interaction patterns. If applying natural communica- 12 (15)
63 tion towards a system or separate objects, the user most certainly also will have to formalise her or his intuitive and personal language (both in regard to speech and gestures). In the present case, aiming at distant objects by pointing was not easy. On the contrary, the users had to be trained to be able to point correctly. A bit surprising perhaps, since people point all the time, and we have normally no problem with understanding what they are pointing at. For instance, in the beginning of the test, the participants walked around and talked about objects in the VR living room, and when doing so, many of them also pointed towards objects in a casual and inexact manor (although they were well aware of that no one - except themselves - could see their intended target in the VR environment). This kind of pointing however, is not meant for object interaction. Instead, it probably mainly serves as a cognitive aid for the user himself, offloading memory resources and supporting the process of verbal reporting (Cappuccio et al, 2013). Nevertheless, pointing still must be seen as a promising interaction model, provided that the target is not too far away and occupy a very small surface. Evidently, a smart system also ought to have a capacity for both teaching (by providing feedback) and learning (by memorisation of user preferences). One way of doing this could be by gathering information about the user s habits but also by evaluating responses in regard to their correctness (for instance, perhaps the user could say thank you when the system interprets the user s intentions correctly). To facilitate the learning curve for both system and user, it would probably be advantageous to add simple feedback mechanisms that tunes these two agents towards one another. System or object related interaction? So far, the concept of natural communication has served as a base for the IoT interaction models. We have also presumed that there are some advantages of letting users feel and interpret the interaction as being performed with the actual chosen smart objects themselves. This is a different pathway from today s popular intelligent personal assistants, such as Apple s SIRI or Microsoft s CORTANA, where a series of applications can be reached by voice-controlled commands through a single channel. By reaching out to the actual objects, these could be felt as directly manipulated, although they in practice might be controlled through a portable device connected to a larger system. This would be advantageous for people reluctant to intelligent centralized systems and to smart objects in general - and it also means that unnecessary detours (similar to asking the butler to ask one s partner to pass the salt at the dinner table) could be avoided. Still, this type of interaction most probably implies limitations, not at least when objects are to be connected to one another or the user is in need of feedback or support for decision making. How such functionality could be incorporated in our models remains to be answered. Additionally, if smart objects are to be interacted with, presenting feedback is vital. If the interaction is performed directly with the items themselves, IoT-objects within sight of the user would probably benefit from showing their status and their activity by visually changing their own appearance. Even if complementary information is displayed on a device away from the object (such as on a smartwatch), it is necessary for the user to know when he or she has reached the object s attention. The most natural in this regard is to look directly at the object for confirmation. Simplicity, uniformity and flexibility To facilitate interaction it is our belief that IoT-items gain from possessing similar interactive capabilities, present feedback in similar ways and have a number of observable features that groups them into the family of smart and connected objects. Still, by making the IoT-objects multifunctional and responsive towards a set of interaction patterns (such as voice, gaze and pointing), it would be possible for users to personalize their communication and to choose combinations of different senses in different contexts. This is a way to secure the mutual understanding between object and user, and it is also the way humans interact with each other. How precisely uniform the interaction patterns actually could be (that is to say, can a TV be controlled in the same way as a smart pot plant or a lamp?) is, however, at present an open question. Evaluating interaction in VR environments One question to be raised is the validity of NASA TLX-values as measures when performing this kind of tasks. Since all of our scenarios and interactions were very short and relatively easy to perform, many participants gave extremely low ratings. This kind of simple and quick evaluation of a set of specific interactive patterns would probably benefit from a different set of questions, perhaps focusing on different types of cognitive abilities, such as attention, memory, perceptual processes etc. Another issue is the use of Wizard-of-Oz-simulations. In our case, the high ranking of speech and gaze could, naturally, be due to this solution, making it almost impossible for the users to fail. If the HTC Vive had been equipped with speech recognition and eye-tracking, the results would most certainly have been different. It is here important to point out that only a very limited number of participants understood that this interaction was fake, and consequently the majority took the task seriously. Finally, evaluating interactions in a virtual reality has its limitations. The haptics in the virtual world are not especially realistic and the controllable space is very limited. Thereby, it could very well be that the similarities between interactions are enhanced (that is to say, all interactions the virtual world feels equally awkward or strange), whereupon any differences become concealed and unnoticed. 13 (15)
64 References Allwood, J. (2011) Språk, kommunikation och kognition. In Allwood, J. & Jensen, M. (eds). Kognitionsvetenskap, (s ). Lund, Studentlitteratur. Antle, A. N., Corness, G., & Droumeva, M. (2009). What the body knows: Exploring the benefits of embodied metaphors in hybrid physical digital environments. Interacting with Computers, 21(1-2), Ballendat, T., Marquardt, N. and Greenberg, S. (2010). Proxemic Interaction: Designing for a Proximity and Orientation-Aware Environment. Research Report , Department of Computer Science, University of Calgary, AB, Canada T2N1N4. Barnum, C.M. (2011) Usability testing essentials: Ready, set... test. San Fransisco: Morgan Kaufmann. Bowman, D. A., Kruijff, E., LaViola, J. J. & Poupyrev, I. (2005). 3D User Interfaces. Theory and Practice. Boston: Addison Wesley. Cappuccio, M. L., Chu, M. & Kita, S. (2013). Pointing as Instrumental Gesture: Gaze Representation Through Indication. Humana Mente Journal of Philosophical Studies, 24, Carroll, J. M. (2000) Making Use. Scenario-based design of human-computer interactions. Cambridge, Massachusetts: MIT Press. Cooper. A., Reimann, R. & Cronin, D. (2007) About Face 3. The essentials of interaction design. Indianapolis, USA: Wiley Publishing Inc. Dahlbäck, N, Jönsson, A. & Ahrenberg, L. (1993). Wizard of Oz studies why and how. Knowledge-Based Systems, 4, Fuchs, P., Moreau G. & Guitton, P.(2011). Virtual Reality: Concepts and Technologies. Boca Ratton: CRC Press. Gallup et al (2012). Visual attention and the acquisition of information in human crowds. Proceedings of the National Academy of Sciences of the United States of America 19, Gibson, J. (1979) The ecological approach to visual perception, London: Lawrence Erlbaum Associates Publishers. Goldin-Meadow, S. & Wagner Alibali, M. (2013) Gesture s Role in Speaking, Learning, and Creating Language. Annual Review of Psychology, 64, Hart, S. (2006). NASA-TASK LOAD INDEX (NASA-TLX); 20 years later. NASA-Ames Research Center. Moffett Field, CA. Herzum, M., Hansen, K.D. & Andersen, H.H.K. (2009) Scrutinizing usability evaluation: Does thinking aloud affect behavior and mental workload? Behaviour & Information Technology, 2, Holmqvist, K., Nyström, M., Andersson, R., Dwehurst, R., Jarodska, H. & van de Weijer, J (2011) Eye Tracking. A Comprehensive guide to methods and measures. USA: Oxford University Press. Hutchins, E. (1995). How a cockpit remembers its speeds. Cognitive Science, 19, Imaz, M. and Benyon, D. (2007). Designing with Blends Conceptual Foundations of Human-Computer Interaction and Software Engineering. MIT Press. Jalaliniya, S. & Mardanbegi, D. (2016) EyeGrip: Detecting Targets in a Series of Uni-directional Moving Objects Using Optokinetic Nystagmus Eye Movements. Proceedings of the 2016 CHI Conference on Human Factors in Computing Systems, Jetter, H.-C., Reiterer, H. and Geyer, F. (2013). Blended Inter action: understanding natural human computer interaction in post-wimp interactive spaces. Pers Ubiqui Comput, Springer. Johansson, R., Holsanova, J. & Holmqvist, K. (2013). Using Eye Tracking Methodology as a Window to Inner Space. In: Paradis, C., Hudson, J. & Magnusson, U.: Conceptual Spaces and the Construal of Spatial Meaning. Empirical evidence from human communication. (9 28) Oxford University Press. Kranz, M., Holies, P. and Schmidt, A. (2010). Embedded Interaction Interacting with the Internet of Things. IEEE Internet Computing. Ledo, D., Greenberg, S., Marquardt, N, and Boring, S. (2015). Proxemic-Aware Controls: Designing Remote Controls for Ubiquitous Computing Ecologies. MobileHCI'15, August 24 27, Copenhagen, Denmark. Louwerse, M. M. & Bangerter, A. (2010). Effects of Ambiguous Gestures and Language on the Time Course of Reference Resolution. Cognitive Science, 34, Möller, A., Roalter, L. and Kranz, M. (2011). Cognitive Objects for Human-Computer Interaction and Human-Robot Interaction. HRI 11, March 6 9, 2011, Lausanne, Switzerland. Nielsen, J. & Pernice, K.(2009) How to Conduct Eyetracking Studies. California: Fremont. Norman, D. (1993). Things that make us smart: defending human attributes in the age of the machine. Addison Wesley. Norman, D. (2002). The Design of Everyday Things, Doubleday, New York. Pulvermüller, F. (2005). Brain mechanisms linking language and action. Nature Reviews Neuroscience, 6(7), Surie, D., Pederson, T. and Janlert, L.-E- (2012). Human Cognition as a Foundation for the Emerging Egocentric Interaction Paradigm. In M. Zacarias & J.V. de Oliveira (Eds.): Human-Computer Interaction, SCI 396, pp Springer. Usoh, M., Catena, E., Arman, S. & Slater, M. (2000). Journal Presence: Teleoperators and Virtual Environments, 9, Van Den Hoven, E. and Mazalek, A. (2011). Grasping gestures: Gesturing with physical artifacts. Artificial Intelligence for Engineering Design, Analysis and Manufacturing (2011), 25, Cambridge University Press Ward, J. (2010). The Student s Guide to Cognitive Neurosci- 14 (15)
65 ence. Psychology Press. New York Wheeler, M. (2016) "Martin Heidegger", The Stanford Encyclopedia of Philosophy (Winter 2016 Edition), Edward N. Zalta (ed.), Wilson, M. (2002). Six views of embodied cognition, Psychonomic Bulletin & Review, 9 (4), Wolinski, C. (2016) Transforming Intent into Action: Eye- Controlled HMDs. Vision Monday, 30, (15)
66 Appendix A: The Design Process Litterature State-of-the-Art Cognitive Theory Brain- and Bodystorming Low-Fi Prototyping 1 User observation no 1 Low-Fi Prototyping 2 Internal Evaluation Evaluations and definition of boundaries and limitations VR Implementation Hi-Fi Prototype Scenarios Hypothesis Litterature Cognitive Theory User observation no 2: TEST Evaluation Report 1
67 Appendix B: Scenarios for a first user observation in a smart living room Basic scenario TV Tänk dig att din TV i det här rummet är intelligent, fjärrstyrd och uppkopplad till ett avancerat nätverk. Det finns däremot ingen fjärrkontroll och ingen app som du kan använda för att styra den. Föreställ dig istället att det är DU SJÄLV som är den egentliga fjärrkontrollen och att TV n - på något magiskt vis - förstår vad du menar. Hur skulle du då föredra att: Sätta igång tv n. Ändra ljudnivån på tv n. OBS: Det finns inget rätt eller fel! Vi vill observera ditt naturliga beteende och du kan förutsätta att det som du gör också får önskad effekt. Du får lov att prova dig fram men tala om vilket av dina förslag som verkar bäst för just dig. Tänk högt medan du utför din interaktion. Tala om när du anser att du är klar med din uppgift. Basic scenario KAFFE Tänk dig nu att kaffekokaren i köket (som du inte kan se) också är intelligent, fjärrstyrd och uppkopplad till ett avancerat nätverk. Det finns - som tidigare ingen fjärrkontroll och ingen app som du kan använda för att styra belysningen. Hur skulle du då föredra att: Sätta på kaffekokaren. OBS: Det finns inget rätt eller fel! Vi vill observera ditt naturliga beteende och du kan förutsätta att det som du gör också får önskad effekt. Du får lov att prova dig fram men tala om vilket av dina förslag som verkar bäst för just dig. Tänk högt medan du utför din interaktion. Tala om när du anser att du är klar med din uppgift. Basic scenario BELYSNING Tänk dig nu att belysningen i det här rummet också är intelligent, fjärrstyrd och uppkopplad till ett avancerat nätverk. Det finns - som tidigare - ingen fjärrkontroll och ingen app som du kan använda för att styra belysningen. Hur skulle du då föredra att: Justera den generella ljusnivån. Släcka ner en eller vissa komponenter av den. OBS: Det finns inget rätt eller fel! Vi vill observera ditt naturliga beteende och du kan förutsätta att det som du gör också får önskad effekt. Du får lov att prova dig fram men tala om vilket av dina förslag som verkar bäst för just dig. Tänk högt medan du utför din interaktion. Tala om när du anser att du är klar med din uppgift. Basic scenario KLIMAT Tänk dig nu att rummets klimat också regleras i ett avancerat nätverk. Det finns - som tidigare - ingen fjärrkontroll och ingen app som du kan använda f or att styra sådant som temeperatur och luftomsättning. Hur skulle du då föredra att: ändra temperaturen ändra ventilationen OBS: Det finns inget rätt eller fel! Vi vill observera ditt naturliga beteende och du kan förutsätta att det som du gör också får önskad effekt. Du får lov att prova dig fram men tala om vilket av dina förslag som verkar bäst för just dig. Tänk högt medan du utför din interaktion. Tala om när du anser att du är klar med din uppgift. Scenario Ställa till fest Tänk dig slutligen att ALLA objekt i det här rummet innehar någon form av intelligens och är uppkopplade gentemot varandra - och att du därigenom har möjlighet att förändra deras egenskaper på olika sätt (dock inte flytta runt dem). Föreställ dig sedan att du ska ställa i ordning rummet inför en fest med dina vänner och att det ska bli så bra partystämning som möjligt. Det finns inga specifika fjärrkontroller till objekten och inga appar (som tidigare). Hur gör du? Hur väljer du ut objekt och hur interagerar du med dem? OBS: Det finns inget rätt eller fel! Vi vill observera ditt naturliga beteende och du kan förutsätta att det som du gör också får önskad effekt. Du får lov att prova dig fram men tala om vilket av dina förslag som verkar bäst för just dig. Tänk högt medan du utför din interaktion. Tala om när du anser att du är klar med din uppgift. 1
68 Appendix D: Evaluation of first user observation Gaze Clicking on Clapping hands/ Hand movements Turning Other (individual (attention) Voice Pointing imaginative button Snapping fingers up/down wrist proposals) Select On/Off Select+on/off distans (kaffe) 4 2 Öka/minska Specifikt val (22 grader, program 1, "Fest") 1 1 Ventilation Temperature Sound of music Light Coffee machine "Party Setting" Context aware or learning systems Pre-programming and storage of information Gaze Voice Gestures Preferable interaction type IoT is exciting 4 I prefer manipulate objects manually 2 1
, touch (coffee-machine) and speech (stereo, tv, coffee-machine and lamp).")
 and icon for a sleeping state (right). Fig 4: Smart-watch bracelet for turning on smart objects and remote control for coffee-machine.")
69 Appendix E: Rapid Low-fi prototype with optional interactive patterns Fig 1: Four green icons indicating interactive possiblities for selecting object or device: Point (tv, stereo & lamp), gaze (tv, stereo and lamp), touch (coffee-machine) and speech (stereo, tv, coffee-machine and lamp). Fig 2: Three blue icons for interactive possiblities for controlling object or device: Touch (coffee-machine), speech (stereo, tv and coffee-machine), hand gestures (stereo, tv and lamp). Fig 3: Feedback for tv. Sound indicator (left) and icon for a sleeping state (right). Fig 4: Smart-watch bracelet for turning on smart objects and remote control for coffee-machine. Feedback for coffee-machine interaction: KAFFE to indicate speech recognition and buzzing coffee-icon when the coffee is ready. 1


70 Appendix J: Test of implemented VR models, Training Environment Figure 1: The training environment gives the participants an opportunity to interact with virtual physical buttons Figure 2: Pointing is exercised by aiming at virtual cubes and spheres in a minimalistic environment 1
71 Tre-Stegsmodellen Projektrapport Delkurs 2: Tre-Stegsmodellen Amanda Eliasson, Erica Jostrup, Jacob Hegelund, Alexander Christerson Westerberg Genom experiment, teoristudier och diverse kreativitetsboostande aktiviteter har ett förslag på hur en framtida interaktion med Internet of Things (IoT) via Augmented Reality (AR) tagits fram. Resultatet är Tre-stegsmodellen som inkluderar fysisk interaktion, interaktion med hjälp av olika filter som läggs på omvärlden (AR) samt en World in Miniature (WIM) som möjliggör interaktion med enheter som är utom användarens synfält. Modellen har stor konkurrenskraft gentemot dagens interaktion då modellen är lätt att använda och förstå då den utgår ifrån användaren. Modellen är utvecklad för en framtida kontorsmiljö där den kommer kunna underlätta vardagliga sysslor betydligt. 1 Inledning och bakgrund I dagens samhälle kommer det kontinuerligt fler och fler enheter som är uppkopplade till internet och prognoser har uppskattat att det år 2020 kommer finnas upp mot 50 miljarder uppkopplade enheter (Evans, 2011). Detta ställer stora krav på hur interaktionen med dessa enheter ska se ut och fungera. Klassiska modeller, som använts hittills, antas bli otillräckliga för den kommande mängden produkter som kommer vara uppkopplade mot internet. I detta projekt har det tagits fram ett förslag och en prototyp för hur detta problem kan lösas genom Augmented Reality (AR). AR-tekniken möjliggör att det går att lägga ett filter på omvärlden, ett digitalt lager i form av virtuella objekt, bilder eller text, och på detta sätt skapas ett nytt medium för interaktion. AR är en teknik på frammarsch och applikationer som idag använder sig av AR är exempelvis Snapchat och PokemonGO. 2 Frågeställning Mot bakgrunden som nyss beskrivits har en frågeställning för projektet tagits fram. Denna har till mål att besvara frågor om hur interaktionsproblem kan lösas, i en framtid där IoT kommer vara dominerande och wearables kommer användas lika brett som smartphones gör idag. Frågeställningen lyder: Hur kan man i en kontorsmiljö utnyttja alla tekniska möjligheter med AR kombinerat med IoT utan att störa våra sociala behov och kognitiva förmågor? För att kunna besvara frågeställningen skapades ett scenario. Detta har gjort att frågeställningen kunnat hållas i fokus och arbetet har hela tiden utgått från detta. Scenariot hjälper till att avgränsa frågeställningen och beskriver en person på ett företag, under en vanlig arbetsdag, och inkluderar ett flertal fall av interaktion mellan både människa-maskin samt människa-människa. 3 Scenario För att koppla ihop tankar och idéer inleddes projektet med att skriva ner ett flertal olika scenarion. Dessa scenarion var direkt kopplade till de idéer som hade kommit fram under projektets start och scenariona hjälpte även till under arbetets gång, för att komma på nya idéer samt utveckla och förbättra de tidigare idéerna. Projektgruppen fastnade tidigt vid ett scenario som utgick ifrån en person som var ny på jobbet. Idéen grundade sig i användanader av en Head Mounted Display (HMD) i ett fall av rundvisning på arbetsplatsen, antingen för den nyanställda eller för besökare till företaget. Detta scenario övergavs senare till fördel för nedan beskrivna, som efter mycket diskuterande upplevdes som mer applicerbart givet de kriterier som ställts upp. Ett flertal andra scenarion togs även fram och arbetades igenom upprepade gånger innan projektgruppen kände sig nöjda med det scenario som blev det slutliga och det som projektet bygger på. Det scenario som valdes ut för att slutligen bygga projekt runt grundar sig i en idé om en miniatyrvärld, även kallad World in Miniature (WIM), som undersökts som interaktionsmedel av bland annat Stoakley et al. (1995) och Bell et al. (2002). Scenariot är följande; Det är en vanlig dag på jobbet och Lisa ska förbereda inför ett akut möte, då det kommit upp ett problem som måste lösas snabbt med hjälp av hennes projektgrupp. Lisa använder sin huvudburna ARutrustning för att öppna upp sin miniatyrvärld (WIM) och väljer i denna sin projektgrupp, som visas som ett förinställt alternativ. Hon får upp alternativet att boka in ett möte med gruppen, deltagarnas kalendrar matchas automatiskt och hon kan se vilken tid som alla har utrymme i sina scheman för att genomföra mötet. Hon får därefter upp ett förslag på en ledig lokal för den givna tiden. Lisa kan därefter enkelt boka in mötet. Bokningen läggs automatiskt in i Lisas kalender, som hon har tillgång till via sina AR-glasögon. De deltagare som bjuds in till mötet får upp en notifikation i deras AR-glasögon och information om tid och plats sparas, på samma sätt som i Lisas kalender, vid accepterande av mötesinbjudningen. Scenario, under mötet: När deltagarna anländer till det bokade mötesrummet har de redan tillgång till att låsa upp och komma in i lokalen. Efterhand som deltagarna väljer vars en sittplats i mötesrummet anpassas deras stolar efter deras personliga ergonomiska preferenser. Alla deltagare har sedan tidigare gjort inställningar i sin WIM för vilka uppkopplade enheter de anser är relevant att information. Detta anpassas efter en inställning automatiskt när de stiger in i rummet. Lisa har exempelvis ställt in att hon vill kunna interagera med mötesrumsbordet, som presentationen ska hållas vid. Hon har även valt bland inställningarna att hon är inte intresserad av den skrivare som är placerad i ena hörnet. För att se alla interagerbara enheter i det rum hon befinner sig kan hon
72 enkelt öppna sin WIM och i den välja att filtrera om de enheter hon är intresserad av att använda. När WIM vyn öppnas ser Lisa det rum hon befinner sig i och kan sortera vilka enheter hon vill kunna interagera med. De val hon gör för vilka enheter hon är intresserad av i sin WIM reflekteras i den verkliga världen när Lisa stänger ner WIM. Exempelvis illustreras det på samma sätt i WIM vyn att mötesbordet är interagerbart som i den augmenterade vyn, efter hon stängt ner WIM verktyget. Under mötet ska Lisa hålla en presentation som har utgångspunkt från det tidigare beskrivna mötesrumsbordet. Hon ger de övriga i mötesrummet access till att se denna presentation direkt i deras glasögon. Detta ger dem även möjlighet att rotera tredimensionella vyer som visas i presentationen. Lisa har även tänkt ha en gemensam virtuell tavla där de tillsammans ska kunna spåna idéer. Efter hand som gruppen kommer fram till nya idéer kan dessa direkt appliceras på den tredimensionella vyn och alla mötesdeltagare kan i realtid delta i utvecklingsarbetet. När gruppen slutligen enats om ett koncept väljer Lisa att skicka den tredimensionella prototypen till printern i rummet. Detta gör hon genom att öppna sin WIM (som öppnar det rum hon befinner sig i) och välja att interagera med skrivaren genom att aktivera den med ett klick. Hon flyttar enkelt över modellen på mötesbordet till skrivaren, som påbörjar en utskrift. Tiden det är kvar innan utskriften är klar visas både ovanför skrivaren i rummet samt, om Lisa lämnar rummet, i hennes WIM. Lisa får slutligen en notifikation när utskriften är helt klar och hon kan hämta den fysiska prototypen de skapat under det lyckade mötet. Rummet sköter under mötet ljus- och temperaturinställningar automatiskt. Exempelvis ökar ventilationen i rummet baserat på antalet deltagare och fönsternas inbyggda dimmerfunktion anpassas efter väderlek och tidpunkt på dagen. Detta är delar av IoT-världen som varken Lisa eller övriga mötesdeltagare behöver kunna kontrollera och därmed inte ens får upp som alternativ i det rum de befinner sig i. 4 Brainstorming & bodystorming I samband med skapandet av möjliga scenarion, som slutligen ledde fram till ovan presenterade, genomfördes även en brainstorming där det togs fram ett flertal olika objekt som projektgruppen ansågs vilja interagera med i en kontorsmiljö. Innan brainstormingens start var det svårt att komma på vad användaren av produkten skulle kunna tänka sig vilja eller skulle kunna interagera med. Det var svårt att koppla Internet of Things med Augmented Reality. Brainstormingssessionen hjälpte projektgruppen att får en tydligare bild över vad som skulle gå att interagera med och vad användaren skulle vilja interagera med. Branstormingen startade med att alla i projektgruppen fick en bunt med post-it-lappar. Alla i projektgruppen fick sätta lappar på de saker i rummet som de skulle vilja interagera med och skriva ner vad det var för objekt. När gruppen kände sig klara samlades alla lappar in och sakerna som det satt lappar på grupperades. Objekten klassificerades i olika subgrupper och minst ett objekt från varje subgrupp har ansetts vara viktigt att involvera i scenariot ovan. Subgrupperna av objekt som definierades gavs rubrikerna kommunikation, informationsdelning, privat/kollektivt klimat, icke-automatiska hjälpmedel samt automatiska hjälpmedel. Därefter startade en diskussion om vilka produkter som var viktigast för produktidéen. Efter brainstorming-sessionen gjordes en bodystorming av det ursprungliga scenariot, för den nyanställde. Under denna process kom det upp mycket frågor och tankar om hur vägbeskrivningen skulle gå till, hur produkten skulle göras utan att bli plottrig, störig och osocial. Resultatet blev en produkt som inte längre var enbart var till för en nyanställd, utan något som skulle passa alla anställda. 5 En 3-stegsmodell Utifrån ovan beskrivna scenario och de tankar som gavs under brain- och bodystormingen skapades en tre-stegs modell. Det som ansågs viktigast att fokusera på i projektet är hur människor kan tolka vilka interagerbara enheter det finns i den omgivande miljön och hur intuitiv och tydlig kommunikationen mellan dessa enheter och användaren är. Det är även av stor vikt att lösa problemet angående hur människor ska kunna sortera vilka enheter som ska visas eller vara interagerbara. Modellen har därför till uppgift att lösa dessa problem, vilket de tre stegen är till för. Den skapar en förlängning av användarens interagerbara miljö och blir ett hjälpmedel för att se vilka enheter som är interagerbara i ens omgivning. Det första steget i modellen är den miljö användaren fysiskt interagerar med objekt i, det som finns i användarens direkta närhet och som denna når genom att sträcka ut en hand och röra objektet. Det andra steget består av ett augmenterat lager som läggs på den fysiska miljön och visar användaren vilka interaktiva objekt det finns inom dennes synfält, medan det sista steget innebär interaktion med omvärlden genom ovan nämnda World in Miniature. World in Miniature (WIM) gör att användaren kan se en miniatyr av det rum den befinner sig i, tillsammans med möblemang och tillgängliga interagerbara enheter (Bell et al., 2002). Genom dessa tre steg utgås det ifrån att människor har olika behov för sin interaktion baserat på deras närhet till olika objekt. Denna teori bygger på Pederson et al. (2011) Situative Space Model (SSM). Modellen är tänkt att fånga vad en person kan upptäcka och nå i en given situation. SSM har användaren i fokus och interaktionsmöjligheterna varierar därför baserat på hur denna rör sig i den omgivande miljön. Modellen består av ett antal olika områden som begränsas av exempelvis vad användaren kan uppfatta och manipulera och även denna, precis som Chen et al. (2013) beskrivit, utnyttjar det faktum att människor ofta tittar på det som de önskar att interagera med. Denna modell kan appliceras i alla de tre nivåerna av vår föreslagna 3-stegs modell. Det kan antas att SSM i den första nivån av modellen är interaktion som användaren vill ha i den fysiska världen, utan någon input från AR/HMD, detta begränsas av hur användaren kan nå objekt i sin närhet med sina kroppsdelar. Den andra nivån av tre-stegs modellen innebär att användaren övergår till att genomföra sin interaktion via sin HMD. Övergången 2

73 till denna nivå sker när användaren inte längre kan manipulera objekt rent fysiskt, då krävs det ett nytt sätt för interaktionen att ske. Interaktionen med hjälp av AR skapar då en förlängning av användarens manipulerbara värld. När interaktion även utanför denna räckvidd önskas når vi den sista nivån av de tre stegen. Här kan användaren använda sin HMD till fullo och interagera även med saker utom användarens synhåll, genom en WIM. Tanken med modellen är att det alltid är det rum Figur 1: SSM (Pederson, 2016) som användaren befinner sig i som ligger i fokus när ens WIM öppnas. Miniatyrvärlden ska alltid spegla den verkliga världen i relation till placeringar, riktning, illustrationer osv. och genom att använda sig av olika filter går det att sortera den information som användaren vill se i dennes AR-miljö. Detta kan exempelvis ske genom att ha markerade konturer på IoT enheter, vilka matchar i både steg 2 (AR) och 3 (WIM) i modellen. För att användaren inte ska behöva överbelasta sin kognitiva förmåga i onödan kan användaren själv bestämma vilken typ av enheter som ska synas i vyn genom en filtreringsfunktion. Nedan kommer ytterligare ett par idéer om hur interaktionen i modellen ska se ut ges. Dessa baseras på tidigare forskning inom relaterade områden och har redan goda modeller för hur man kan förbättra interaktionen för användaren. Perifer Interaktion & Context Aware systems Edwards and Grinter (2001) presenterar i sin artikel en tanke om hur omgivningen kan användas för att ge input till våra uppkopplade enheter och på detta vis göra interaktionen med dem smartare. Genom att dra nytta av information om exempelvis vilket rum någon befinner sig i, och hur många andra som befinner sig i samma rum, kan systemet dra slutsatser om vilka handlingar som är önskvärda att genomföra av en person och presentera dessa möjligheter för denna. Detta är en funktion som även tre-stegs modellen vill utnyttja sig av. Författarna verkar dock anse att system som kräver en förståelse för vad människor avser att göra i olika situationer är allt för komplext, och kommer vara väldigt svårt att lösa på ett tillfredsställande sätt. Detta är däremot Pederson (2016) inte helt enig i. Han har istället, tvärt emot detta, fokuserat nästan enbart på perifer interaktion. Han anser att människor kan skapa system som har samma känslighet som mänsklig interaktion, där information om kroppsspråk, handlingar och kroppsställning används. Interaktionen skiftar i detta fall från att vara enhets-centrerad till att vara kropps-centrerad, där information om handlingar och perception styr individers interaktion (Pederson et al., 2011). I enighet med detta är det önskvärt att tänka sig att tre-stegs modellen kommer att kunna läsa av information gällande kontext och miljö för att underlätta interaktionen för användaren. Genom att använda sig av den kontext en person befinner sig i kan vissa inställningar ske automatiskt, så som med vissahjälpmedel. Exempel på detta, taget ur scenariot, är då mötesdeltagarna går in i mötesrummet och deras förvalda preferenser för vilka verktyg som är användbara i detta rum dyker upp. En person behöver därmed inte ställa in sina preferenser för sin omgivning varenda gång denna förflyttar sig, utan dessa sparas och aktiveras automatiskt. Denna typ av filtrering underlättar de mänskliga aktiviteterna till stor del (Surie et al., 2010). Att även använda sig av smarta rum som kan mäta av hur många deltagare det finns i rummet och anpassa det kollektiva klimatet, så som ventilation och temperatur, efter detta kommer ta bort en del av den stora börda av interaktiva möjligheter som annars presenteras för varje enskild person i en IoT-värld. Det finns en vision om att ens wearables i framtiden lär sig hur dess ägare fungerar. Genom att föra statistik över vilka val som genomförs, i vilka kontext och situationer, kan en individanpassad miljö skapas. Denna miljö kommer kunna förändras efter användarens tidigare preferenser, kopplade till tid, sinnestillstånd samt objekt och personer som interaktion sker via. Människor är vanedjur och de flesta aktiviteter sker på ren rutin (Pederson, 2016), vilket borde kunna utnyttjas för att skapa en smartare interaktion. Proximity Den som först myntade begreppet om proximity var Hall (1969), ett begrepp som sedan dess flitigt byggts vidare på. Detta innebär att man utnyttjar närheten till olika objekt då man interagerar med dem och baserat på det kan genomföra olika funktioner. Genom att i tre-stegs modellen använda sig av Ledo et al. (2015) närhetsprincip i relation till människor istället för objekt kan detta tankesätt uppnå bättre potential. Just proxemic aware controls, som undersökts av Ledo et al. (2015), går ut på att utnyttja närheten till de saker som önskas interagera med. I det fall de undersöker används en surfplatta eller mobiltelefon för att kontrollera enheter i användarens närhet. Närheten till den enhet som användaren vill interagera med styr hur stor kontroll som kan utövas över enheten. För att kunna kontrollera enheten till fullo och ändra dess status krävs det att användaren står inom en meters avstånd till enheten, medan om användaren står längre ifrån enheten kan den enbart se enhetens status och lokalisering i relation till användaren i rummet. Denna princip ger dålig mening, då det kan anses att användaren i detta fall lika gärna kan använda sig av en fast kontroll till komponenten för att styra den, om den ändå behöver gå nära komponenten för att kunna styra den. Genom att använda principen för interaktion mellan människor, i en kontorsmiljö, ger principen mer mening. Baserat på hur nära eller långt bort en kollega användaren vill dela information med befinner sig går 3

 i modellen, men är upptagen med något annat, kan en notis läggas om att kollegan ska")
74 det att föreställa sig att det finns olika sätt att kontakta kollegan, som är mer eller mindre fördelaktiga. Om kollegan exempelvis befinner sig utom användarens synfält och därmed måste sökas upp med hjälp av WIM, kan det med fördel kännas rimligt att ges alternativet att ringa upp kollegan eller skicka ett e-postmeddelande. Detta är val som därmed borde finnas lättillgängliga när användaren söker och finner sin kollega i sin WIM. Om kollegan däremot bara är ett antal meter bort, i vad som kan anses vara nåbart genom det andra steget (AR) i modellen, men är upptagen med något annat, kan en notis läggas om att kollegan ska kontakta användaren så fort det ges tid. Möjligheten att genomföra detta borde därför presenteras genom ett val i AR-miljön. Om kollegan däremot är inom användarens räckhåll, och därmed räknas ingå i den manipulerbara världen i SSM, och användaren för en konversation med denna går det att anta att de val denna vill kunna göra är att direkt kunna dela dokument och filer, dela vyer och ha gemensam möjlighet till manipulation av de delade objekten. Allt detta är därmed val som borde presenteras i användarens HMD i detta fall. Baserat på givna exempel kan det ses att olika typer av applikationer är mer eller mindre passande att ha lättillgängliga via sin HMD baserat på närheten till andra personer i sin omgivning, något som är mycket eftersträvansvärt att ha som funktioner i tre-stegsmodellen för att optimera dess användning. I WIM ska användaren kunna göra en personlig filtrering. Det innebär att användaren kan välja vilka saker som ska synas och vara tillgängliga att interagera med i användarens miljö. Detta illustreras med knapparna till vänster i skissen. WIM ska även ge ytterligare information om enheter användaren kan interagera med både i och utanför WIM-kartan. Mid-fi För att att öka förståelsen för hur WIM-miljön och ARmiljön i 3-stegsmodellen kommer fungera, och hur de ska hänga ihop, gjordes en Mid-fi prototyp i Keynote. (Figur3, bild 1-7) illustrerar WIM enligt prototypen. En 3D bild av ett kontorslandskap togs fram och det lades till fem knappar för att illustrera hur det är tänkt att filtermenyn, som fanns med i Lo-fi skissen, ska se ut och fungera. 6 Prototyping För att undersöka hur ovan idéer skulle utformas rent utseendemässigt och ta steget från idé till prototyp skapades både Lo-fi och Mid-fi skisser över tankarna. Lo-fi En enkel Lo-fi-skiss togs fram för att illustrera idén och syftet med WIM (Figur 6). Skissen visar hur användaren av applikationen får en överskådlig blick över kontoret genom användningen av WIM, vilken hjälper användaren att få en mer strukturerad bild över de saker som finns tillgängliga, exempelvis hur många mötesrum som är lediga. Figur 3: Mid-fi: WIM och AR och filtermenyn Bilderna illustrerar även vad som är tänkt att hända, när användaren trycker på de olika knapparna i filtermenyn. Om användaren exempelvis trycker på knappen Room får han eller hon reda på vilka lokaler som är lediga genom att dessa markeras grönt i miniatyrvärlden. Användaren får på samma gång reda på vilka rum som inte är lediga genom att dessa rum istället markeras rött. Man kan även se att WIM- kartan fungerar för hela kontoret, det vill säga att det kommer finnas funktioner för att byta våning. Det gjordes även en Mid-fi prototyp för AR-miljön av vår 3-stegs-modell (Figur 3, bild 8-9). Dessa bilder illustrerar hur det är tänkt att det kommer se ut om användaren har valt i filtermenyn att han eller hon vill kunna se vilka mötesrum som är lediga. Det illustererar även hur användaren enkelt kan skicka mail till sina arbetskamrater i närheten. Användare kan exempelvis även använda funktionen för att hålla koll på hur lång tid det är kvar till personens mat i mikrovågsugnen är klar. 7 Avståndstest Figur 2: Lo-fi: Skiss för WIM och filtermeny För att definiera avstånden för de olika interaktionsfönsterna (Fysisk, AR och WIM) och sätta gränser för när det ena bör övergå till det andra utformades ett test. Ett antal objekt skapades i Unity, placerade i rad med olika avstånd mellan sig. Detta gjordes för att undersöka hur interagerbarheten påverkas baserat på avstånd mellan dem, samt vad som händer om de överlappar 4

75 varandra i AR-miljön. Objekten placerades ut med nedan angiven storlek och avstånd, dessa uppdaterades mellan de olika testerna och importeras mellan var test till HoloLens. Fem olika tester genomfördes, dessa beskrivs mer i detalj nedan. Efter varje genomfört test gav försökspersonen som testat interagerbarheten kommentarer om hur de upplevde interaktionen. I de två första testen instruerade vi testpersonen att stå still på en och samma punkt under interaktionen med objekten, i de övriga fallen fick testpersonen röra sig fritt i lokalen. De personer som genomförde testet var alla kursdeltagare och tillfrågades om deltagande slumpvis i VR-labbets lokaler. De avstånd och storlekar på objekt som testades är: 1. Kub med sidan 30cm - avstånd 3, 5, 7 m. Kommentar från försöksperson: Objekten är placerade för nära varandra, på grund av detta var det svårt att separera dem från varandra. Objekten kändes onaturligt stora, gjordes därför mindre till nästa test. 2. Kub med sidan 10 cm - avstånd 2, 7, 15 m. Kommentar från försöksperson: Storleken 10 cm matchar mer den storlek på objekt (exmepelvis en lampa) som den är avsedd att representera. 15 meter kändes som alldeles för långt bort från användaren för att kunna interagera med objektet, 7 meter är ett mer ok avstånd med objekt i den storleken. 3. Kub med sidan 10 cm - avstånd 2, 6, 11 m. Kommentar från försöksperson: Då personen kunde röra sig fritt i rummet och välja hur interaktionen med objekten skulle ske för att kännas enkelt och naturligt gavs kommentaren att det krävs att det är minst en meters avstånd till objektet som ska gå att interagera med för att det ska fungera i HoloLens och kännas naturligt. Objekt närmre än så försvinner ur synfältet. Det går att interagera med en kub på 11 meters avstånd, men är svårt i den storlek som denna var under testet. För vår försöksperson, som fick röra sig fritt i rummet, kändes (ca) fem meter som det optimala avståndet att interagera med ett objekt på 10x10x10cm. Dock ansågs det att det känns lika enkelt, i en öppen miljö, att gå fram till objektet som att interagera med det via glasögonen. Först om användaren är sittandes eller om det finns andra fysiska objekt i vägen känns AR-interaktionen mer e ektiv. sätts av just HoloLens, så som de är designade idag, och kan mycket väl komma att ändras efter hand som de utvecklas i framtiden. För andra AR-glasögon behöver detta inte överensstämma och i framtiden kommer denna information vara överflödig, då man exempelvis kan tänka sig att det kommer finnas eye trackers i alla HMDs. Användningen av eye trackers kommer göra interaktionen mycket enklare, då det enbart räcker att styra blicken mot det som önskas interageras med, istället för som idag att hela huvudet behöver riktas och hållas stabilt för att kunna genomföra interaktionen. 8 Experiment För att testa Tre-stegsmodellen genomfördes ett experiment. För att försäkra oss om att experimentet verkligen undersökte rätt komponenter i ovan beskrivna tre-stegs modell definierades modellens kärndelar. Kärnan i ARsteget är dess möjlighet för användaren att kunna interagera med saker utom ens räckhåll, men inom ens synhåll. Kärnan i WIM-steget är dess möjlighet för användaren att kunna interagera med saker utom synhåll, samt att det kan användas som ett navigerings- och filtreringsverktyg. För att försäkra åtkomsten av dessa kärnfaktorer i experimentgenomförandet utformades ett scenario där minst ett steg av varje kärnmoment fick genomföras av deltagarna. Utrustning Scenariot som skapades för experimentet genomfördes antingen med hjälp av HoloLens eller utan hjälp av Holo- Lens. En miniatyrvärld föreställande experimentlokalerna skapades i Unity, med filterfunktioner för att sortera interagerbara objekt och funktioner för att boka utrustning med hjälp av WIM. Deltagarna blev bland annat instruerade till att hitta till en på förhand definierad plats, använda filterfunktionen för att filtrera möjliga interagerbara IoT-objekt, boka utrustning i VR-labbet (som användes som experimentlokal), vilket kan liknas vid att boka ett mötesrum i en kontorslokal, samt styra belysning och hålla en presentation. 4. Lampa hämtad från asset store - avstånd 2, 6, 11 m. Kommentar: Interaktionen fungerade som i ovan beskrivna fall. Interaktionen filmades och kan ses via Youtube url: ft1jzpn8. 5. Interaktion med WIM där röststryrning och exempel som visats i Mid-Fi prototyperna testas. Illustrationsvideo finns att hitta via Youtube-länken: Sammanfattningsvis kan slutsatsen dras att objekt som är i liknande storlek och form av en kub med sidan 10cm inte bör befinna sig på längre avstånd än ungefär 8 meter för att kunna gå att interagera med relativt enkelt. Dessa begränsningar är dock något som Figur 4: Slutprodukt: Bokning av rum genom WIM Röstkommandon lades in i programvaran för att möjliggöra styrning av programmet. Samt för experimentledarna att sätta på och stänga av funktioner som hade kunnat störa experimentgenomförandet. Kodord som användes av deltagarna i experimentet var bland annat 5

76 open world, close world, open powerpoint och close powerpoint. Instruktionskort som stegvis beskrev genomförandet av experimentet skapades för de olika fallen, vilka deltagarna blev tilldelade under experimentets gång. En tvådimensionell karta över experimentlokalerna skapades även för det fall där deltagarna skulle genomföra experimentet utan HoloLens. Figur 5: Slutprodukt: Interaktion med virtuell powerpoint och WIM Deltagare I experimentet deltog 17 personer, varav 7 stycken kvinnor. En person uteslöts ur statistiken, då experimentet misslyckades under detta genomförande. Deltagarna rekryterades genom ett bekvämlighetsurval, där vänner och bekanta tillfrågades, med enda förutsättning att de inte tidigare hade befunnit sig i lokalerna för experimentet. Deltagarna hade en medelålder på 23.2 år (SD=2.23). Personerna som deltog delades in i två grupper, där den ena gruppen genomförde experimentscenariot med hjälp av Microsoft HoloLens och den andra utan. De båda grupperna utförde samma uppgiftscenario, där den enda skiljande faktorn, tillika oberoende variabeln, var om de använde HoloLens eller ej. Hälften av både kvinnorna och männen genomförde experimentet med HoloLens och hälften utan HoloLens. Genomförande Alla deltagare placerades inledningsvis vid ett bord, som var avskärmat från experimentlokalerna, där de ombads läsa och underteckna ett informerat samtyckesdokument (Bilaga 1). De fick sedan fylla i ett formulär med information om ålder, kön samt upplevd datorvana (Bilaga 2). Alla deltagare genomförde en demo med HoloLens, där de fick förklarat vad trestegsmodellen går ut på och öva sig på att interagera med en förenklad WIM som skapats enbart för detta syfte. I denna kunde deltagarna filtrera på belysning samt tända och släcka lampor. De fick även se hur miniatyrmodellen följer användarens huvudrörelser och hur de kan styra hur de ska placera den framför sig, för enklast möjliga interaktion. Deltagarna fick testa demon tills de kände sig familjära med hur man klickade på objekt och öppnade/stängde WIM genom röstkommandon. Baserat på om testpersonen ingick i gruppen med eller utan HoloLens ombads de att antingen behålla glasögonen på, eller ta av sig dem, då de gick vidare till nästa steg i experimentgenomförandet. De olika stegen som deltagarna fick genomföra i experimentet var följande: 1. Tända belysningen i den första experimentetlokalen. 2. Tända belysningen i lokalen bredvid. 3. Lokalisera och boka utrustning i lokalerna. 4. Lokalisera en markerad plats i kartan som visar lokalerna, gå dit och hålla en (i förhand skapad) presentation. 5. Släcka all belysning i lokalerna efter hand som dessa lämnades och återvända till startpunkten för experimentet. Deltagarna som genomförde experimentet med Holo- Lens blev visade ut i testlokalen och placerade så att de hade god översikt över det första rummet. En experimentledare gick hela tiden bredvid testpersonen och delade ut instruktionskort med tydligt beskrivna instruktioner för hur de skulle genomföra varje steg ovan, efter hand som experimentet genomfördes (Bilaga 3). Testpersonen blev instruerad att läsa instruktionerna högt och genomföra dem stegvis, så som de beskrevs på korten. När instruktionerna på ett kort genomförts gavs det tillbaka till experimentledaren och testpersonen gavs ett nytt kort med instruktioner. På detta vis fanns det alltid en person tillgänglig för testpersonen att vända sig till om det uppstod några frågeställningar. Detta genomförande gjorde även att den mentala påverkan på deltagarna minskades, då de enbart fick en mindre mängd information åt gången, vilket var önskvärt för att kunna skapa ett jämförbart scenario för de båda fallen. Tiden för genomförandet av experimentet togs och efter alla steg klarats av fick testpersonerna fylla i ett NASA Task Load Index (TLX) protokoll (NASA, 2016). De ombads dessutom att skriva ner eventuella tankar de fått under experimentets gång. Deltagarna som genomförde experimentet utan Holo- Lens fick även de ett antal instruktionskort med uppgifter tilldelade sig (Bilaga 4). För att de olika fallen skulle vara jämförbara var instruktionerna mycket lika de instruktioner för genomförandet med HoloLens. På grund av detta ombads deltagarna även i detta fall att läsa instruktionerna på korten högt och hade hela tiden en experimentledare vid sin sida under experimentgenomförandet. Det var exakt samma uppgifter som skulle genomföras med och utan HoloLens, tiden togs för genomförandet och efteråt fick även dessa personer fylla i ett NASA TLX utvärderingsdokument. Efter experimentet fick alla deltagare veta syftet med experimentet och möjlighet att få svar på eventuella frågor rörande experimentet som uppstått och tidigare inte kunnat ges svar på. Personerna som inte fått använda sig av HoloLens under experimentets gång gavs möjlighet att testa dessa ytterligare, om tid fanns. För mer förståelse för hur interaktionen med Tre-stegsmodellen funderar titta på youtubevideon: feature=youtu.be 9 Resultat Skillnaden mellan de två grupperna utifrån de beroende variablerna; tid det tog att genomföra uppgiften, samt 6
77 deltagarnas utvärdering av genomförandet med hjälp av NASA TLX, har studerats. Deltagarna utvärderade sin egen datorvana (M=3.875, SD=0.8) genom att ranka sig själva på en likertskala, där 1 representerade ingen datorvana och 5 mycket stor datorvana. Även om det fanns en signifikant skillnad i datorvana mellan könen, t(13.865) = , p = , gick det inte att finna någon skillnad i datorvana mellan experimentgrupperna. Viktningen mellan experimentgrupperna kan därför anses lyckad utifrån denna faktor. Tid Det fanns ingen statistiskt signifikant skillnad i tid, mätt i sekunder, (t(13.9)=-1.25, p = 0.23) mellan gruppen som genomförde testet med HoloLens (M=375) gentemot gruppen som genomförde testet utan HoloLens (M=318). NASA TLX NASAs Task Load Index mäter variablerna mental demand, physical demand, temporal demand, performance, e ort och frustration på en skala mellan 1 och 20. Det fanns ingen signifikant skillnad mellan grupperna som genomförde experimentet med och utan HoloLens på någon av variablerna, förutom e ort, t(13.9)= , p = , och frustration, t(9.3)= , p = E ort är en uppskattning av hur hårt deltagarna var tvungna att arbeta för att nå det resultat de gjorde, där gruppen som genomförde experimentet med Holo- Lens rankade sin arbetsinsats betydligt högre (M=10.25) än gruppen som genomförde experimentet utan HoloLens (M=4.63). Frustrationsmåttet mäter hur osäker, irriterad, avskräckt, stressad och/eller irriterad testpersonen upplever sig under genomförandet av uppgiften. Personerna som använde HoloLens skattade sig ha högre frustration (M=7.375) än personerna som genomförde testet utan HoloLens (M=3.5). 10 Diskussion Resultatet visar att det inte går att se några skillnader tidsmässigt mellan gruppen som genomförde experimentet med HoloLens gentemot gruppen som genomförde experimentet utan HoloLens. Detta visar att tre-stegs modellen kan konkurrera med dagens traditionella sätt för interaktion. Detta är ett positivt resultat då produkten är en helt ny lösning, som innebär ett helt nytt sätt att interagera med omgivningen, och kräver att användaren skapar sig nya mentala modeller för hur detta ska gå till. Människor använder mentala modeller för att kunna ta beslut i situationer som är oväntade, ofamiljära samt för att förstå nya upplevelser (Holsanova and Nord, 2010) Den kognitiva belastning som krävs för en användare att skapa mentala modeller och enkelt kunna interagera med en produkt bestäms både av hur informationen om hur produkten ska användas är presenterad och illustrerad, samt på hur stor erfarenhet användaren har av liknande produkter (Holsanova and Nord, 2010). Då deltagarna fick genomföra en demo av tre-stegs modellen innan de genomförde experimentet kunde de börja skapa en mental modell för dess funktion tidigt. Tanken med att låta deltagarna genomföra en demo var just för att underlätta för dem att skapa en sådan och på det viset bättre kunna likställa de olika scenariona. Det går inte att förneka att alla har en väldigt god erfarenhet av vardaglig interaktion, utan utrustning som HoloLens, och det är svårt för experimentdeltagarna som genomförde scenariot med HoloLens att bygga upp en lika tydlig erfarenhet av hur man använder tre-stegs modellen under den korta period demon genomfördes. Att resultatet inte visade på någon signifikant skillnad mellan scenariona gör därför att man kan anta att tre-stegs modellen har en god förmåga att guida användarna i deras förmåga att skapa sig mentala modeller och enkelt förstå hur produkten fungerar. Detta resultat är ännu mer imponerande om man tänker på de flertalen brister det fanns i exempelvis feedbacken från användarnas interaktion i HoloLens. Inledningsvis var exempelvis tanken att använda en wizard of oz -metod för att ge deltagarna feedback på den interaktion och styrning som de genomförde genom HoloLens. Idén var att någon av experimentledarna fysiskt skulle styra belysningen i rummen på ett sätt som speglade styrningen i HoloLens. När användaren tände lamporna i WIM skulle de även tändas på riktigt i rummet de interagerat med i WIM. Denna tanke släpptes dock efter pilottestningen, då det framkom att det skulle bli alldeles för svårt att få till en trovärdig lösning på detta. Problematiken ligger i att det dels är svårt att studera deltagarens interaktion genom HoloLensen i realtid, då det alltid blir en viss tidsfördröjning innan det går att se vad som hänt på datorn det streamas till. Utöver denna fördröjning hade det sedan krävts att en av experimentledarna meddelats om att det skett en lyckad tändning i HoloLens, som därefter fått tända på riktigt. Det skulle med andra ord ta flera sekunder från att testpersonen tänt ljuset i WIM tills att de skulle tändas på riktigt i lokalen, vilket troligen skulle skapa mer förvirring än klarhet för testpersonen. Kommentarer från testdeltagare Ingen av testpersonerna reagerade på att lamporna i den fysiska världen inte förändrades med lamporna i miniatyrvärlden och de kommentarer som gavs av testpersonerna efter genomförandet av experimentet inriktade sig snarare på problematiken med att styra interaktionen med huvudet. Eftersom all styrning för interaktionen sker genom att just rikta muspekaren i HoloLens till det objekt man önskar interagera med och sedan använda handgester för att klicka var det snarare denna problematik användarna fokuserade på än vilken e ekt deras interaktion i WIM hade på den verkliga världen. De saker som experimentdeltagarna påpekade var just svårigheterna med att rikta denna pekare och att det var svårt att pricka den sak de önskade interagera med, speciellt lamporna i WIM. Det krävdes ofta ett flertal försök innan deltagarna lyckades interagera med lamporna i WIM, vilket de också har motiverat den högre rankningen i TLX utvärderingen med. För att interaktionen ska kännas enkel och smidig krävs det att den fungerar felfritt och på första försöket, något som måste arbetas med i framtiden för att undvika att användarna känner sig frustrerade och att de måste arbeta hårdare än vanligtvis för att uppnå samma e ekt på omvärlden. 7
78 Andra kommentarer som gavs från experimentdeltagarna var bland annat att de ansåg att det var enkelt att se vad man kunde interagera med i WIM och att de mest troligt hade klarat av att lösa uppgiften även utan de detaljerade beskrivningarna som gavs på uppgiftskorten under experimentets gång, vilket ännu en gång ger stöd för modellens förmåga att hjälpa användaren bygga en mental modell. Efter hand som användaren lär sig använda systemet kommer mindre och mindre information krävas för att interaktionen ska ske naturligt och utan svårigheter och mängden instruktioner kan då minska. Det som användarna ansågs saknas mest under experimentet var feedback som angav var i WIM de befann sig. Innan deltagarna lokaliserade sig själva i modellen var det svårt för dem att förstå hur de exempelvis skulle använda sig av denna för att hitta till den markerade platsen där de skulle hålla en presentation. Detta är en fråga som tagits upp under skapandet av tre-stegs modellen och en lösning som är avsedd att finnas i modellen, med liknande funktioner som de som beskrivs under visualization i artikeln av Stoakley et al. (1995). På samma sätt är det önskvärt att skapa en funktion för att kunna zooma in/ut olika delar av WIM som är av mer eller mindre intresse för användaren samt att i framtiden kunna använda modellen för att även kunna kommunicera och interagera med andra människor, så som beskrivits i bland annat scenariot. Men på grund av dagens tekniska läge har dessa problem inte gått att lösa. AR i framtiden Det finns dock stora förhoppningar om att detta ska kunna gå att genomföra i framtiden och det finns många önskemål, både tekniskt och utseendemässigt, för hur AR glasögonen ska se ut och fungera för att kunna bli ett hjälpmedel i vardagen på samma sätt som dagens smarta telefoner. En stor del av dessa önskemål ser ut att kunna bli verklighet inom en mycket snar framtid och mycket kritik som idag riktats gentemot AR-glasögon kommer att vara ett minne blott. En av de främsta sakerna som kritiserats med Holo- Lens har varit dess väldigt begränsade Field of View (FOV), vilket begränsar det område av omgivningen som användaren kan uppleva genom sina glasögon. Tillverkare av AR-glasögon arbetar med att skapa ett allt större FOV, så att detta inte ska begränsa användaren, och det finns till och med företag som tagit patent för AR-linser som ska kunna ersätta AR-glasögonen helt i framtiden. Dessa kommer drivas av kinetisk energi från blinkningar och kommer verkligen revolutionera marknaden i relation till just FOV i framtiden. AR glasögon kommer i framtiden även kunna kopplas samman med ett flertal andra verktyg, som ökar dess applicerbara användningsområden och dess användarvänlighet. Den mappning av omgivningen som glasögonen genomför kommer även den att förbättras i framtiden, då den kommer kunna kartlägga och känna igen objekt i sin omgivning. Något som förenklar interaktionen med dessa betydelsevärt. Det krävs dock att sättet man interagerar med sin utrustning får en viss standardisering över enheter, precis som alla smarta telefoner använder en scroll-rörelse för att bläddra och att användaren flyttar sin tumme och pekfinger ifrån eller mot varandra på displayen för att uppnå en in-/utzoomning. Idag är det vanligt att använda sig av gester för sin interaktion med utrustningen, så som med HoloLens, vilket gör att man slipper använda sig av ett interaktionssystem som är inbyggt i utrustningen. Men även användningen av gester stöter på en del problematik. Det kan exempelvis vara svårt att skilja på gester som används naturligt när man kommunicerar med en annan individ från de gester som ska användas för att styra utrustningen, något som kommer behöva lösas i framtiden. Det krävs även att alla de nya gesterna ska läras in och inte är för krångliga för användaren. (Norman, 2010) anser exempelvis att handgester har en lång väg kvar inom sin utveckling innan dessa kan ses som optimala att använda inom AR, om de ens kan optimeras helt. Den grundläggande tanken anser han vara god, då det är väldigt naturligt för oss att använda oss av just gester vid olika typer av interaktion, men för att gester som används i AR-utrustning ska fungera krävs det mycket tanke bakom valet av gester och sedan mycket övning av användaren, för att skapa goda mentala modeller. Ännu ett problem som behöver överkommas är den stora spridningen av betydelse olika gester har på olika platser i världen. Hur man ska styra sin interaktion är tydligt ett stort problem som behöver lösas inom den närmsta tiden och precis som en del av de kommentarer vi fick från experimentdeltagarna påpekade, man kan även anse att det inte är optimalt att låta användaren styra sin interaktion med huvudet. Just att försöka styra en pekare med huvudet är väldigt svårt och inte alls något optimalt, då det är svårt att skapa precision och att pricka ett objekt på ett längre avstånd. Glädjande nog kan man därför se att det idag läggs ner mycket kraft på att skapa AR-utrustning med inbyggda ögonrörelsemätare. Dessa kommer öppna upp en stor värld när det kommer till att styra interaktionen via utrustningen och kommer underlätta interaktionen betydligt. Ett annat sinne som ses utnyttjas mer och mer är vår hörsel. Vi människor använder oss av lokaliseringen av ljud dagligen för att organisera oss i omvärlden och tolka vår omgivning, detta är något som Microsoft tagit med sig i utvecklingen av HoloLens och som ökar dess känsla av naturlig interaktion med omvärlden. HoloLens har nämligen spatialt ljud i enheten, som bygger på individuellt anpassad Head-related transfer functions (HRTF) (Engadget, 2016). Detta innebär att enheten anpassar ljudet som genereras efter användarens personliga mått för att skapa en så verklig ljudbild som möjligt för denna. I framtiden kan hjälpmedel som har nytta av extra information via ljud ha stor nytta av denna funktion. Exempelvis kan detta vara av användning i relation till tre-stegs modellen på så sätt att användaren kan guidas till en given plats både genom att få information visuellt och auditivt. Om en person riskerar att krocka med ett objekt de inte uppfattat visuellt kan detta exempelvis meddelas via det spatialt relaterade ljudsystemet i utrustningen. Även när det kommer till mjukvara finns det utrymme för stora förbättringar. Den programvara som använts för att skapa tre-stegs modellen för HoloLens är som tidigare nämnts Unity. Under den period som utvecklingsarbetet pågått har programmet uppdaterats ett flertal gånger 8
79 (från version 5.4 till 5.6) och processen har underlättats betydligt i samma takt. Inledningsvis krävdes det att projektet laddades till Visual Studio för att kunna köra det på emulatorn och se om det fungerade eller ej. Efter uppdateringarna går det numera att testa projektet i Unitys Game Editor istället för att behöva köra det i emulatorn var gång. Det finns fortfarande en del buggar, men i det stora hela har det förbättrats avsevärt. Ytterligare en nyhet som lanserats till Unity är Vuforia. Med Vuforia kan man koppla ihop tredimensionella objekt med riktiga fysiska objekt, både tredimensionella och tvådimensionella, som exempelvis en bild. Vuforia kan även mappa dessa fysiska objekt och göra det möjligt att koppla funktioner direkt till objekten. När HoloLens mappar objekten i sin omgivning kan de alltså läsa in hologram som är kopplade till specifika objekt. I takt med att utrusningen blir mindre och mindre ska alltså fler och fler funktioner integreras i den. Samtidigt går det även att se att varje tillverkare idag fokuserar på en specifik sak, en styrka som deras produkt ska ha och som ingen av de andra har. Fler och fler av våra sinnen integreras i vår interaktion, vilket också kommer öka användbarheten för tekniken. Vår kognition bygger på vår relation med omgivningen, där våra sinnen är de främsta budbärarna. Det är därför helt rätt att inkludera dessa i så stor utsträckning som möjligt, för att i framtiden kunna skapa hjälpmedel som förbättrar och hjälper vår kognitiva förmåga. I allt detta kan det dock vara bra med en påminnelse, att lagom är bäst. För att få en god upplevelse som användare räcker det att fokusera på ett par saker, så som tracking av användaren, stereoskopiska vyer samt större FOV, som redan diskuterats (Cummings and Bailenson, 2016). I relation till detta går det att se att en produkt som tre-stegsmodellen har stor potential för interaktion i en kontorsmiljö, även om det finns många frågeställningar kvar att ta hänsyn till om man utgår från det tidigare beskrivna scenariot. Det finns stor utvecklingspotential och det som visats hittills är enbart en liten del av de möjligheter modellen för med sig. 11 Förslag för framtida studier Innehåll och detaljer i WIM Under mittredovisningen, där Mid-fi prototypen presenterades, påpekades det att projektets WIM innehöll mycket detaljer. Efter detta har det diskuterats hur mycket innehåll och detaljer det faktiskt bör finnas i modellen. Det kan argumenteras för att det exempelvis inte är viktigt för användaren att se att det finns fem stolar i ett mötesrum, då hon eller han mest troligt endast är intresserad av att veta vilken del av våningsplanet som mötesrummet befinner sig på och informationen om rummet är ledigt eller inte. De objekt som syns i AR- och WIM-miljön ska därmed vara relevanta för den typ av interaktion som ska ske i tillika miljö. Precis vilka objekt som underlättar förståelsen för interaktionen och vilka som istället gör att det ges för mycket information till användaren och därmed blir en belastning behöver undersökas. I en framtida tre-stegsmodell bör det tas beslut om vilken information som är intressant att ha med i både AR och WIM. Det bör även tas beslut om informationsmängden och om hur många objekt det ska finnas per filter. Även undersökningar om vilka ord som bäst passar för att representera filernas funktion bör utföras. Detta så att det är tydligt för användaren vad ett filter betyder och vad som händer om användaren filtrerar. Räkna fel Då designen av experimentet skapades diskuterades det huruvida antal fel skulle räknas under testets gång, denna tanke släpptes dock med motivationen att det inte kommer vara lika förutsättningar för grupperna och därför inte kommer vara ett bra mått att jämföra. Grupperna har, som tidigare beskrivits, väldigt olika välgrundade mentala modeller över de olika scenariona, vilket gör ett sådant mått väldigt missvisande. Det är även svårt att definiera vad som räknas som ett fel från användarens sida och vad som är problematik med programvaran i detta tidiga skede av utvecklingen. Detta är dock något som skulle kunna undersökas i ett senare skede i utvecklingen av tre-stegsmodellen. Om modellen utvecklas vidare, programvaran blir bättre och interaktionen sker utan fördröjningar, samt där det är enkelt att sikta på objektet man önskar interagera med, kommer ett sånt mått vara mer rättvisande för modellens funktionalitet. Det krävs dock fortfarande att man är medveten om de olika nivåerna av grundkunskap i de olika scenariona när man analyserar resultatet från ett sådant test. Interagerbarhet i AR Under projektets gång har det diskuterats mycket om hur användaren av tre-stegsmodellen ska förstå vilka objekt som går att interagera med. I en framtida värld där Internet of Things är betydligt större del av våra liv än vad det är idag, en värld där nästan varje fysisk produkt har någon form av internetförbindelse, måste det vara självklart för användaren vilka produkter som går att interagera med. Hur detta visuellt ska se ut är något som en framtida utveckling av tre-stegsmodell kommer ta beslut om. Det bör även tas beslut om det visuella ska se likadant ut för alla eller om användaren själv ska bestämma hur det ska se ut. En annan viktig detalj att ha i åtanke när tre-stegsmodellen utvecklas vidare är vad eller/och vilka objekt som ska vara samma i både AR-steget och WIM. Det vill säga när ska dessa två steg ska innehålla samma information och när bör de skiljas åt. Placering av AR-objekten I en framtida utveckling av tre-stegsmodellen kommer det fattas beslut om hur de augmenterade objekten i ARsteget ska vara placerade i relation till de fysiska objekten. Till exempel om användaren använder sig av en internetuppkopplad 3D-skrivare, där själva skrivaren och det färdiga 3D-objeketet är fysiskt och där tiden som är kvar för utskriften illustreras som ett augmenterat objekt eller ett hologram. Hur ska då det virtuella objektet vara placerad i förhållande till skrivaren, för att det ska nå ut till sitt mål på bästa sätt, utan att störa användaren? I framtiden är det förutom placering även viktigt att ta 9
80 beslut om vilken storlek de virtuella objekten ska ha och hur mycket information som de ska innehålla. Mängden objekt i AR För att användarens kognitiva förmågor inte ska belastas i onödan är det, i en framtida förbättring av trestegsmodellen, viktigt att undersöka hur många objekt det max får finnas i användarens synfält. Detta genom att sätta en begränsad mängd, samtidigt som det ska finnas någon form av automatisk sortering. Denna sortering ska vara individuell för varje användare, vilket gör att användaren får sin personliga vy som kan anpassas efter behov eller vardagsanvändning. Andra frågor som också bör vara besvarade i den framtida produkten är vad som händer om två virtuella objekt hamnar ovanpå varandra, hur ska användaren då skilja på dessa för att kunna interagera med de olika objekteten? Det kommer även behöva ges svar för hur rörelser av de rörliga objekten ska vara designade. Referenser Bell, B., Höllerer, T., and Feiner, S. (2002). An annotated situation-awareness aid for augmented reality. In In Proceedings of the 15th annual ACM symposium on User interface software and technology, pages ACM. NASA (2016). National aeronautics and space administration (nasa). Norman, D. A. (2010). Natural user interfaces are not natural interactions. 3:6 10. Pederson, T. (2016). Fördjupningsföreläsning om interaktion i kurs kogp05/mamn10. Pederson, T., Janlert, L. E., and Surie, D. (2011). a situative space model for mobile mixed-reality computing. IEEE pervasive computing, 4: Stoakley, R., Conway, M. J., and Pausch, R. (1995). Virtual reality on a wim: interactive worlds in miniature. In In Proceedings of the SIGCHI conference on Human factors in computing systems, pages ACM Press/Addison-Wesley Publishing Co. Surie, D., Jackel, F., Janlert, L. E., and Pederson, T. (2010). Situative space tracking within smart environments. In In Intelligent Environments (IE), 2010 Sixth International Conference, pages IEEE. Chen, Y. H., Zhang, B., Tuna, C., Li, Y., Lee, E. A., and Hartmann, B. (2013). A context menu for the real world: Controlling physical appliances through head-worn infrared targeting. Technical Report UCB/EECS , UNIV BERKELEY DEPT OF ELECTRICAL ENGINEERING AND COMPUTER SCIENCES, CALIFORNIA. Cummings, J. J. and Bailenson, J. N. (2016). Psychology, 2: Media Edwards, W. K. and Grinter, R. E. (2001). At home with ubiquitous computing: Seven challenges. In In International Conference on Ubiquitous Computing, pages Springer Berlin Heidelberg. Engadget (2016). 3d audio is the secret to hololens convincing holograms. Evans, D. (2011). The internet of things. how the next evolution of the internet is changing everything. cisco internet business solutions group (ibsg). us/about/ac79/ docs/innov/iot IBSG 0411FINAL.pdf. Holsanova, J. and Nord, A. (2010). Multimodal design: Media structures, media principles and users meaningmaking in newspapers and net papers. Ausdi erenzierung und Konvergenznin der Medienkommunikation. Campus Verlag, Frankfurt/New York. Ledo, D., Greenberg, S., Marquardt, N., and Boring, S. (2015). Designing remote controls for ubiquitous computing ecologies. In Proxemic-Aware Controls, pages ACM. 10
81 Nudging You in the Right Direction A Peripheral Interaction Project August Alfredsson, Bo Elovson Grey, Adrian Hansson and Ludvig Åkesson dic13aal@student.lu.se, cid12bel@student.lu.se, dic13aha@student.lu.se, dic13lak@student.lu.se In this project we implement a system to help people perform everyday tasks using peripheral interaction to guide, or nudge, a person by giving visual, and to some extent tactile, cues in the environment. The scenario is set in a meeting room in a future office, where we assume that most things in the room is interconnected in some way. We assume that the Internet of Things is well established. The persons in the scenario will also wear or carry several connected devices, wearables, that can be used to interact with all or most of the other connected devices in the surrounding environment. Since none of these devices really exist, or are easily obtainable, we build our scenario and prototype in virtual reality. The VR headset we choose to use is the HTC Vive, and we implement our environment using the Unity engine. It is a powerful tool which allows us to both implement the graphical environment and give different objects and entities in that environment advanced properties, which will allow us to be able to interact with them in several ways. For now our prototype only allows a very limited amount of interaction and we have some potentially usable visual cues. The cues mostly consist of frames, highlighting objects that currently are useful to interact with. To guide the attention of a user the frames are ideally slightly animated, to make sure they are at least noticed unconsciously. The idea behind our peripheral interaction based on the concept of calm computing coined by Weiser and Brown (1997). It is meant to enrich the environment with useful information that the user can choose to focus on, or ignore. The important thing is that the technology never steals the attention of the user, but just remains available user until the user chooses to focus on it. The nudges are supposed to work the same way. Since the concept of Internet of things, and virtual reality are so new getting qualitative data from user testing is extremely hard. People might have a hard time grasping the concepts or react in a certain way just because they are in a completely novel situation. Instead we decided to do exploratory tests to see if we could find something interesting to explore in the future. That is why we cannot say much about how well our nudges works. Several test participants found the idea of nudges as an aid to guide them through different tasks both in their private and professional life an interesting concept. We got several suggestions where the test participants thought that nudges would be useful to assemble furniture, to make them more aware of road signs and pedestrians in traffic, or to help them catch the next bus. For future work the test participants need to be more used to VR and the concept of Internet of things. That way the novely should have worn off and there wold be less confusion regarding what is actually possible to do in the world. Eye-tracking built into the VR headset would help reveal if any visual nudges actually get noticed, even if the test person might not be consciously aware of them. That way there is a better chance to see if the nudges have any positive effects on task solving. 1 Introduction Imagine the following scenario. You are a project manager about to hold a meeting. This meeting takes place in a meeting room completely unfamiliar to you. How can you present your carefully crafted slides to the other project members? How do you adjust the room environment, to make sure everyone can see your slides? These are two of the problems we try to solve. This project is one of the student projects for the course Neuro modeling Cognitive Robotics and Agents given at Lund University. The main goal for our project is to make a prototype where you use peripheral interaction to, for an example, control, receive and share information using wearables and other different interconnected devices. Internet of things, IoT for short, wearables and peripheral interaction are three areas still in their infancy. The potential use for all three areas is huge and all of the giants in the hardware/electronics and software industry are looking into at least one of these areas, to examine if they might be the next big thing. Peripheral interaction is very appealing since it promises to make us more efficient and less encumbered by allowing us to perform simpler tasks in the periphery, without having do diverge too much cognitive resources to be able to perform them. We are, in other words, delving into fairly uncharted territory. The way we choose to implement peripheral interaction is to use it as an aid to guide a user during everyday tasks. In our case, the setting for our scenario is a meeting room at a company, and the person performing the tasks is in the role of the leader of a project meeting. Since there are few truly interconnected devices on the market we opted to build our prototype in virtual reality using the Unity engine. For our prototype the virtual reality headset we use is the HTC Vive, since its Room Scale functionality allows us to move around in our virtual setting, to some extent. The way we try to guide the user is by giving the user nudges, in the form of visual and tactile cues, in the right direction. Peripheral interaction should be achievable through all of our senses, but we choose to only use visual and tactile cues, since Virtual Reality through the HTC Vive is a very visual medium and that this is a very convenient way to emulate augmented reality glasses or lenses, and since it is fairly easy to give tactile feedback through the move controllers. Holding a controller is not the same thing as wearing a smartwatch or a smart bracelet but it will have to suffice for our prototype. Another possibility for periheral interaction is by sound. We could try to nudge people in the right direction by using sound, but to make a reasonable scope for our project we choose not to use sound either. In the second and third sections we give some background theories and try to motivate the choices we made during our design process. This article will have to lean towards the ex-
82 ploratory due to the fact that we cannot be sure what the participants in our tests reacted to. The reasons why will be discussed in this article. 2 Peripheral Interaction The trouble with a lot of modern technology is that people constantly get bombarded by different notices from their mail, social media accounts, error messages and so on. Constant popups, flashes, sound effects and vibrations tend to draw people s attention away from what they are currently trying to focus on. The focus, trains of thought or being in the zone goes down the drain, and people try to start over, but will inevitably get distracted again when the next notice shows up. Peripheral interaction could be a better way to make people aware of different notices and other kinds of information by presenting it calmly in the periphery. Peripheral interaction is a fairly new area of research. What makes this way of interacting with devices so appealing is the rise in the number of interconnected devices and gadgets, the Internet of Things. Using different wearable devices to communicate or manipulate things in the surrounding environment seems like a very attractive idea. Peripheral interaction is something humans do all the time. People listen to music while doing other things, they talk to people while performing other tasks and button their shirt while watching the news on TV. These are just a few examples of what people do naturally. This area of research is still in its infancy. There have been some examples of simple devices for simple communication, giving feedback and note taking, to give a few examples (Hausen, 2014) (Bakker, 2013), but there are, to our knowledge, no actual consumer products out yet. This fits well into the theories on both embodied cognition and situated actions. Embodied cognition is basically the idea that all actions originate from the body, with its limbs and sensory systems, and where it is a crucial point of reference. This means that cognition perhaps mainly is for action and reaction. Even offline cognition, where one just thinks about a problem, still uses the body as a point of reference (Wilson, 2002). According to those who support the idea of situated actions a person can never really plan his or her actions. Instead any actions taken arise from the current situation. Any actions taken by a person are dictated by a setting, where actions and setting have a dialectic relationship. This means that the actions drive the situation, or setting, and vice versa. A setting consists of everything in the surrounding environment such as objects and artifacts, visual cues, different entities and so on, but also agent itself, i.e. the person performing the actions, with all of his and her knowledge, intentions, states of mind etc. (Lave, 1988). This also makes a case for why the nudges should have some effect on the actions, even if the user is not actively aware of them. Weiser and Brown (1997) could be seen as pioneers, since they coined the phrase Calm Technology in their article The coming age of calm technology. Basically the way they describe calm technology is that information can move freely between the periphery and the center of attention. This means that it will reside in the periphery of the attention until the user decides to voluntary focus his or her attention on the information. This also implies that the user could interact or perform other actions in the periphery, only focusing on what he/she is doing if there is not something more important going on at the same time. This way of interacting with all the different gadgets, devices or computers in the surroundings might make people more efficient, performing mundane, nonintrusive tasks in the periphery while at the same time doing some more advanced tasks. True multi-tasking is an illusion, though. Even though the brain does a lot of its processing in parallel the executive parts in the brain can only perform one task at a time. The illusion of multi-tasking comes from rapid task switching, often prompted by what needs to be attended to at a specific moment in time. Depending on the cognitive load from each task the brain either need to focus completely on one task, or can allow switching between several lighter tasks (Gazzinga et al., 2014, Chapter 7). Bakker (2013) illustrates this in a rather neat way. She uses a fixed number of dots to illustrate the maximum cognitive capacity. If an extremely demanding task is performed, all the dots are needed to cover that task, and if some less demanding tasks are performed the dots are distributed over the tasks, and in some cases there will even be some cognitive resources in reserve. To be able to perform more advanced tasks through peripheral interaction the concept of ubiquitous computing needs to be a bit further along than it is today. Weiser and Brown (1997) speculate that we will have computers, powerful enough that people will not really notice, or rather think twice, about their existence. They will become a natural part of the environment. People will wear or carry several interconnected devices which will seemingly interact seamlessly with other interconnected devices all throughout the surrounding environment. This will become such a natural thing that people will not even think twice about what is connected and how, the interconnections will just be taken for granted. It will become an Internet of Things, where anything not connected might be seen as ancient and arcane. Wearable devices can come in all shapes and forms imaginable, and the possibilities are almost endless. They can for example be contact lenses, glasses, ear pieces, bracelets, watches, broaches, pendants, rings or generally anything that can fit a tiny circuit board and an energy source. Top-down and bottom-up processes To get some tools for understanding the possible basis for peripheral interaction, some very basic and simplified knowledge of neurocognition is needed. All of this need to be taken into consideration when trying to create some form of peripheral interaction. The human brain processes what seems like an excess of information all the time. Even though humans, as mentioned above, can really only perform one task at the time, huge amounts of sensory input is processed in parallel at all times. It is constantly aware of different things in our surroundings without us being consciously aware of exactly how much we actually perceive at any given moment. This functionality has been an important part of our evolution. Especially if you consider that it is crucial to be able to detect immediate threats and give us a fair chance to deal with any potential threats. To make this short: All sensory input from our different modalities are routed through the limbic system and split into one short and one long path for processing. The short path goes from Thalamus via Hippocampus to Amygdala, which preemptively makes us ready to act before the sensory input is properly processed and we fully understand what we perceived (Gazzinga et al., 2014, Chapter 5). We react mainly to sudden 2
83 movements, abrupt sounds, temperature changes, touch, pain, among other things. The short path seems to have some kind of simpler object recognition, to avoid too many false alarms. The long processing path goes through the visual, audio or sensory cortex, dividing the stream into a what and a where stream. The what stream is, roughly, object detection and knowledge about what is perceived. The where stream gives knowledge about where the things perceived are relative to the own body, to other things in the world and in time. It also gives information about movement. After all this processing the streams reach the executive parts of the brain and the being is ready to act and make decisions based on the processed information. The short processing path is usually behind what we call bottom-up processing. Bottom-up reacts quickly to different things in our surroundings and refocuses our attention to the thing that caused the bottom-up process to react. For the visual modality bottom-up processes react to different kinds of saliency, such as color, shape, edges and contrast. Different kinds of movement also make the bottom-up process react. The other modalities work in the same way. Sudden sounds, touch, smells, tastes and so on risk pulling attention and prepare us to act quickly. Top-down processes are controlled by the executive parts of the brain, in the frontal lobe. Here the brain actively selects where it wants to direct its attention. Depending on what our current task is and what our train of thought is, or what we actually choose to attend to we are more or less prone to detect different things in our surroundings. Both bottom-up and top-down processes make us very well suited for pattern recognition and to quickly be able to find things that stand out. If what we are looking for only differs from its surroundings in one dimension, e.g. shape, color or brightness, we are especially good at picking it out (Gazzinga et al., 2014, Chapter 7). The task that is performed at one specific moment in time drives what a person fixates the gaze on and what features in the surroundings will be perceived, and perhaps stored in the long term memory. To give an example. Traffic signs placed near a crossing will get more gaze fixations than signs placed some way between two crossings. Emotional content also has an influence on what gets gaze fixations in a scene or not. It can be described as bottom-up processes pull the attention, while top-down processes push the attention. The color and shape of the sign will hopefully pull the attention to it, and since the current task of the person might be driving a car the attention will be pushed to the sign, because it is important to the current task (Henderson, 2007). There have been several tries to emulate the way a person will look at a scene. The knowledge about top-down processes driving where a person looks depending och context, such as current task, interests or train of thought comes in part from experiments where real eye tracking data is compared to computer generated data. For the crude models, only taking saliency into account the computer generated data differed quite a lot from the real eye tracking data. There are more accurate computer models that take context into account. These models can predict how a person will look at a scene quite well. They should even be able to predict how the same scene will be regarded for several different contexts (Navalpakkam and Itti, 2005)(Torralba et al., 2006). Another example of top-down processes is the cocktail party conversation effect. Even though there are constantly conversations going on, music playing and several other sounds in the surroundings a person will be able to focus on a specific conversation. If that conversation is boring, or if a word of interest, like the name of the person, is perceived the focus of attention can quickly be shifted over to that other conversation, blocking out the original conversation Gazzinga et al. (2014, Chapter 7). It has been shown that by guiding the attention, in this case guiding where a person looks, it is possible to make it easier for that person to realize the solution to a complex problem. Surgeons or surgical students were tasked to solve a complex problem, where initially only 1/3 of the test persons managed to find a solution. The persons that managed to solve the problem looked at specific area, critical to realizing the right solution. For the second round of testing the attention of the test persons was guided to the area critical to the solution. This time 2/3 of the test persons managed to find the solution. The guiding of attention was achieved by animating the critical area, since movement draws attention (Grant and Spivey, 2003). Something similar to this is what we hope to achieve with our nudges. The reason why peripheral interaction is such an appealing area to explore is that we might become more efficient, and feel less encumbered. If there is a way to tap into and actively control some of the processing power that is in constant use, it could be used for simpler tasks and interactions with interconnected devices, all this when we direct our main focus on something more important. In that way, all the processing power that seemingly goes to waste gets used in, for most people, a more meaningful way. Cognitively cheap interactions that people can perform without seemingly thinking about them is the goal. Priming Another cognitive phenomenon that is useful for peripheral interaction is priming. It affects how the brain puts together what we perceive. The brain constantly fills in or removes information and what we think we perceive might not be what actually is in front of us. This in part is why illusionists magical tricks work and why the saying we only see what we want to rings so true (Gazzinga et al., 2014, Chapter 5, 7). We are not necessarily aware when we are being primed or by what. Depending on the task we are performing, what we are currently taking in through our senses, what our interests are and so on we are primed to make it easier to perceive or associate to certain things (Henderson, 2007). For example seeing or tasting something can start long chains of associations and make us susceptible to certain sounds or visual cues in our surroundings. This is why the successful models for where people will look in a scene also take objects and context into account in their calculations. Priming is in full effect during conversations where the parties involved get more and more aligned as the conversation continues along. The parties will share and use more of each other s vocabulary, concepts and gestures (Garrod and Pickering, 2004). One interesting example of how people are affected by their surroundings is that it has been shown that the way people vote is affected by where they vote. Casting their votes at, for example, a school make them more inclined to support propositions regarding education. Not only the setting and its surroundings affect the voters, but they also get primed by anything they experience on their way to the polling station (Berger et al., 2008). 3
84 Given all this, the nudges should prime the user, at least to some extent. A short mention of neuromarketing There is an entire field in marketing, called neuromarketing, that tries to use neuroscience to improve consumer awareness, arousal, willingness to make a purchase, to communicate different messages in both more effective and efficient ways, among other things. Here are two examples that are relevant to our peripheral interaction, and nudges. The effects of different visual cues have been explored by several neuromarketing researchers. For example in Ha and Lennon (2010), where they found that the right kind of subtle visual cues and design elements on a shopping webpage influenced shoppers to be more inclined to make a purchase, even if they were only browsing the page. The same subtle cues, or low task relevant cues as Ha and Lennon (2010) called them, also made the shoppers more aware of any task relevant cues on the site. Another example of a subtle feature that has impact on whether people prefer to buy a product or not is if the logo or the packaging has a subtle upwards curvature feature, like a smile (Salgado-Montejo et al., 2015). Neutral or a curvature pointing downward will get you less sales. All this points to that subtle cues in the environment do affect people to some degree. Even though a lot has been written about neuromarketing in academia, there are probably lots of important findings well hidden as business secrets among different management consultant firms. What neuromarketers try to do with different sensory cues (visual, auditory, tactile, scent, etc.) is really close to what we try to achieve with our nudges. The difference is that they try to nudge people into buying the right products or towards the right attitude, while this project tries to provide some utility in everyday life. 3 Building a prototype The scenario for this project is set in a conference room somewhere in the near future, with a multitude of Internet of Thingsenabled devices available for interaction. One of the greatest challenges in this project was to try to find some kind of peripheral interaction that contributes to and improves the possibilities and ways we interact with Internet of Things-enabled devices today and in the future. To find out what could be useful ways for peripheral interaction, and to aid the person during a presentation the scenario was acted out several times, with several stops for reflection about what was happening at that exact moment, and to find the reason why the actor wanted to perform an action a certain way. What was agreed on was to use different visual highlights on the objects that might be useful to interact with for each task in the scenario. This will hopefully work as nudges, priming the user to interact with the right objects. Visual nudges The fact that humans are good at pattern recognition, and especially good at finding the something that stands out from its surroundings, as mentioned earlier, should mean that if we make something stand out enough in the surrounding environment, it could work as a visual nudge. Another phenomenon from the section before that can be used is the fact that different forms of saliency drives what we look at in a scene, when looking freely. To visualize what can be interacted with in the surrounding environment the guess is that brightness is a more important feature than color. The further out in the periphery of our field of view something is, the less color we are able to perceive. Basically, a gray scale, more or less, is all that is left of our color perception in the periphery. Color also brings up the problem with color blindness. As long as only one, or a couple of things belonging together, is highlighted the choice of color is more down to aesthetics and cultural convention. If different interactable objects or areas are in the field of view the different colors of the entities should differ in their level of brightness, or rather nuance of gray. All colors have a gray nuance, or brightness level (Gazzinga et al., 2014, Chapter 5). Event though a bright red and a bright green color might be seen as completely different colors by people with color vision, they might have the exact same gray nuance and be perceived as the same color by someone with color blindness. In a some ways part of the Gestalt laws of perception is used, namely the law of similarity (Henderson, 2007). In short this means that things that have some visual traits in common will seemingly belong together. The way it is implemented here is when two objects that can interact, manipulate or have some other effect on each other they will be highlighted the same way, either by having the same border or by having the same brightness. Hopefully this will work as a strong enough hint, or nudge, to make the user realize that the objects can be used to interact with each other in some way. Another thing Henderson (2007) brings up is that vision is closely liked with other senses. Visual information integrates with what can be smelled, sounds from the surroundings, the feeling of the material under the feet, if there is a draft, and so on. All, or some of these sensations could possibly be manipulated to provide peripheral interaction, but this is something that should be explored in other projects, when the wearables are good enough to provide sufficient combinations of different sensory information. Especially, good haptic feedback is lacking from the current crop of wearables. When something of interest comes into the user s field of vision, the object(s) that might be useful to interact with will be highlighted immediately. Note that only objects or areas of interest to the current task, or chain of actions will be highlighted, even though the user can interact with other objects in the room. This is to avoid information overload and not leave unnecessary clutter in the field of view. The highlights must be discrete enough not to make a bottom-up process shift the attention of the user to what was only supposed to be a nudge in the right direction. Saccades, quick scanning eye movements, are acceptable though, and probably unavoidable. To avoid attention shifts the intensity of the highlight probably needs to increase gradually. Pitfalls when using gaze tracking One seemingly convenient way to select or manipulate objects or areas in the surrounding environment would be through our vision, by using gaze tracking. This technique could also be used to, more precisely, know when and where to perform nudges. There is currently no gaze tracking, or eye tracking for that matter, built into the HTC Vive. We fake gaze tracking by using the general direction of the person s head. Since this is the best we can do in our VR prototype, it will have to 4
85 do. Gaze tracking, however, is not as easy as it might appear. The eyes are not as stationary as one might think. One usually experience a stable image, and that the gaze is stable and fixed. We perceive a stable image and that we fix our gaze on something. The trouble is that the eyes are constantly moving, scanning the environment, if something moves. These very quick eye movements, saccades, are the fastest movements the human body can produce, with several movements per second (Johansson et al., 2013), (Henderson, 2007). Saccades might be triggered by things in the periphery, usually by bottom up processes, but they might also be triggered by cues from hearing, touch, or even by top-down processes associated by the task being performed, or by context. Another thing Johansson et al. (2013) discovered that triggers eye movements is when remembering or describing scenes, objects and people, to give a few examples. Even having something described to you will trigger eye movements. If someone is able to filter out these kind of eye movements the problem with reliable and accurate gaze tracking should be solved, because solutions for just finding the eyes and the direction they are currently pointing has been around for years from companies like SensoMotoric Instruments (SMI). One, perhaps a bit crude, way to do gaze tracking is to define dwells, i.e. a gaze fixation over an appropriate length of time, as where the focus and gaze of a person is at a specific moment. This is the way Gidlöf et al. (2013) define at what products in a supermarket their test participants are looking when making a shopping decision in their decision making studies in a natural environment. They meant that a fixation time of 120 ms should be good enough. Solutions like this are discussions for other projects in the future, however. Manipulating things in the world The user manipulates things in the world by using gestures. Different kinds of gestures seems to be one of the most reasonable ways to interact with different interconnected devices. It does not matter if the gesture detection lies in a wearable, e.g. bracelets or a phone, or if there are some image recognition tricks behind it. In our scenario gestures are possible. Gestures are a central part of the human language. One of the most popular theories is that the language evolved from gestures and some kind of sign language into the spoken language humans use today (Gazzinga et al., 2014). Even though seemingly the largest part of the informational content comes from spoken words and voice modulation, some of content is, or gets enhanced or elaborated on, in gestures. There are several types of gestures, but there are two main categories: Iconic and deictic gestures. Iconic gestures are all kinds of describing gestures, while deictic gestures are different kinds of pointing gestures (Holler and Wilkin, 2009). Gestures seem to make cognition cheaper by moving some of the information content from voiced speech to gestures. Holler and Wilkin (2009) suggest that conversations where the parties cannot see each other are much harder due to the fact that the possibility to offload cognitive load by gesturing is not possible. Human language is heavily reliant on metaphors. Every other sentence contains metaphors. Their use is so common, that people usually do not realize how often they use metaphors. A short explanation of why metaphors are used is that it seems helpful to describe something in more relatable terms. There are for example structural metaphors such as Time is Money (you re wasting my time, I spend time, etc.) and Theory as a Building (we need to build up the theory with more facts, it needs more support, etc.) (Lakoff and Johnson, 2008). The kind of metaphors that will be used in this project are mainly orientational metaphors, such as More is Up, and simile metaphors, like grabbing a screen and dropping it or pulling curtains. Looking at gestures there are several different kinds of metaphors. In fact, using some good will, both deictic and iconic gestures could be seen as metaphoric in some ways. During the bodystorming session the gesture that basically all the participants made when they wanted to move their computer screen to the smart board was to grab the screen, move it physically, and drop it on the smart board, the simile metaphor mentioned above. For adjusting the light intensity of the lights shining at the smart board we used the more or less universally accepted metaphor more is up, and less is down. Pulling your hand in an upwards motion increases the light intensity, and a downwards motion decreases the intensity of the lights. These are the two orientational metaphors. Our reason for using gestures and metaphors is that they can be performed with only a small cognitive load. This is basically what Bakker (2013) does with her FireFlies, for example. As with the FireFlies we hope that after a short learning period the gestures will come naturally and that the user will perform them, seemingly without thinking. The early state of the prototype In the very beginning we had some different thoughts on what kinds of interactions we actually categorize as being some kind of peripheral interaction. We all had some ideas, but none of us were sure they were peripheral enough to be called peripheral interaction. We had a brainstorming session where we just spitballed ideas to see if we could find something worthwhile. After going through all of our thoughts and ideas we thought that a peripheral navigation aid seemed like the most promising idea to pursue. This was before we had a meeting with our specialist supervisor, Dr. Thomas Pederson, a peripheral interaction expert at Malmö University. He immediately shot down our first idea, since there were already several well developed prototypes for something like our navigation system. Instead he brought up some more interesting and relevant topics, and after that meeting we had some more solid ground to stand on. The project scenario should be set in a meeting room or in an office environment, and we decided to go with the meeting room scenario. The limited time of the project was a factor that was relevant to how large the scope of the project could be. Dr. Pederson also encouraged us to make one strictly defined scenario, narrowing things down to the essentials, and make that one good before making the next one, or expanding the original. We then decided that our scenario should start at the beginning of an office meeting. What does a meeting leader do when he or she enters the meeting room? What items are the first ones to be interacted with? With this as a basis a brainstorming session began. In Fig. 1 you can see the list of ideas we came up with during the first brainstorming session. The text in the figure is in Swedish. From all the things we came up with, a clear scenario was created. As mentioned earlier the scenario starts at the beginning of a meeting, and from this, a story was made to visualize the process (Fig. 2). 5


86 Bodystorming Figure 1. The top half is before or in the start of a meeting, bottom half is during a meeting Story-boarding From the scenario we created a story to get a clearer view of how to interact with the different devices. Figure 2. Story-boarding from the brain-storing ides and scenario This was drawn up before we had made some actual tests, and at that time we had some thoughts on having eye-tracking to choose the item to interact with (Fig. 2). The problem with this kind of interaction is that focusing directly on the device that the user wants to manipulate might not be a very suitable way to design peripheral interaction. Therefore we changed the manner of how things could be manipulated to a more gesture based way of interaction, where you can keep focus on what you are doing, but interact with a lamp with one hand, for example. We then recreated the scenario in a bodystorming session to get the feeling for what gestures we should use for our interaction design. When body-storming you follow the same rules as if you were brainstorming. The difference is that you use your whole body physically to get an idea of how to really interact with an item or the environment (Magnusson et al., 2009). This was an important step before designing and scripting the Hifi prototype, because when the testing starts, the test persons should not need to think about how to interact with a device or anything else in the environment. From the bodystorming session we got a good overview of how to interact with the different devices of an office room. In the scenario where the user would move the screen image from a laptop onto a smart board, we all felt the natural inclination to grab the screen and drag it to the desired location and release it. When we later had our first testing session in the HTC Vive the test subject confirmed that our mental metaphor for the drag and drop gesture worked and felt right. We also received feedback on how to dim the light. Our test person suggested that instead of pointing and moving your arm downwards, you could point your hand towards the lamp and turn your hand in a twisting motion, mimicking a dimmer. This would feel more like you were actually dimming lights. How to create a high-fidelity prototype For creating the actual hi-fi prototype, the game development tool Unity was used. It is a flexible and powerful game engine which allows you to integrate a couple of VR technologies into your project. To set up the initial virtual environment, in our case a room with interactable objects, built using free low quality models and textures, was created based on our story board (Fig. 2). During this process, the team familiarized themselves with the Unity work flow, or process, and its different tools. A few sessions were spent on doing this, as well as scouring the web for suitable scripts and model assets to use for implementing basic functionality. A SteamVR asset was chosen as interface between the virtual world and the physical VR equipment. The interface only had very basic functionality, therefore additional script modifications were written to enable further interaction. Once we had the fundamentals down, assets of higher visual quality were acquired to construct a virtual environment with a more realistic look to it. The process then continued with implementing the ideas and concepts discussed in our storyboard (Fig. 2 and brainstorming session, and trying various graphical components and textures to represent the visual cues, hopefully making them peripheral interaction nudges. With a fairly functional yet still primitive prototype up and running, members of our own team, another team also studying peripheral interaction, as well as the group mentors, performed tests and gave feedback. This marked the end of the first phase and the beginning of the second phase. After receiving initial feedback from pilottesting, the code was modified to accommodate some new changes and insights. The scenario was then expanded to its fullest extent. The full scenario with all steps was first only implemented with default values on nudges. The user testing was conducted on this. Some slight input was collected from these tests and was used to partially evolve the design. Then another level of nudges was tried. The code was modified to allow longer, more intense nudges to be displayed for the users. 6

87 Result of the high-fidelity prototyping The final state of the high-fidelity implementation consists of a virtual environment built in Unity. The environment simulates an office building meeting room, filled with furniture, background characters, and several objects with which one can interact. The trigger button on the HTC Vive hand-controllers have been programmed to simulate any pinch or hand-gesture that can be used to interact objects overlaid with augmented reality functions. Using this trigger button currently allows a user to grab hold of the screen of a laptop, drag this screen to the smart board, and drop it there. Additional functionality creating a nudge toward dimming the lights over the smart board is also in the process of being finalized. The entire room and interaction is modeled after the brain- and bodystorming sessions. In the final version of the hi-fi prototype, most of the originally drafted scenario was included. The final prototype consists of a virtual meeting room with multiple interface components and nudges appearing in it. The room featured a laptop which screen could be pinched, grabbed, dragged and dropped on the smartboard. Above the smartboard was a very bright lamp that featured visual nudges toward it to hint to users that that they could turn it off to remove glare and improve the visual fidelity of the smartboard. Next up was a scripted weather event that triggered emergence of intense sunlight. Once sunlight increased in intensity from outside the window, another visual nudge was triggered to appear around the windows. This was to hint to the user that they could deploy window screens to block out the sunlight. It s important to differentiate between the actual room and the interface components and nudges. First of all, the interface consists of a pointing device with what looks like a thin blue lightbeam coming out of it. When you point at a device in the room that is interactable, the controller will vibrate slightly and a hand icon will appear at the end of the beam to signify if the device is either grabbable or clickable. The hand icon will look like an open hand if the device is grabbable and look like a pointing hand if it s clickable. When the user has grabbed and dragged the laptop screen over the projector screen, a yellow frame will appear around it to indicate that it will fill the screen if the user releases it here. A similar frame appears around the lamp and the window at appropriate points in the scenario. The following nudges are present in the prototype: Nudge A: A frame around the laptop screen. Nudge B: Two blinking arrows, first to the left towards the projector screen and then up towards the light in the ceiling. Nudge C: An ellipsis around the light in the ceiling. Nudge D: A frame around the windows to the right. Nudge E: A a vibration in the controller when you point at an interactable object. The prototype has two different levels determining the intensity and length of the nudges: level 1 and level 2. In level one, all frames are completely static, the controller vibrates a shorter time and the same is true for the appearance of the arrows. In level two, all frames vibrate slightly, the controller vibrates a little longer and the time that the arrows are visible is three times longer. 4 Methods Figure 3. The virtual office environment Our tests are set on the IoT meeting room scenario described above. Three tasks will be performed by each test participant. The tasks are described under Test tasks in the Test plan. The test plan can be found in Appendix A. At the beginning there is one visual nudge to get the participants started. The first nudge is a frame around the laptop screen. When the participant have successfully gotten the screen visible on the smartboard, the lamp above the smartboard should be turned off, to eliminate the disturbing reflection cast on the board. Ten seconds after that, sharp sunlight will shine through the windows and the curtains should be pulled down. Along the scenario there are several nudges guiding the participants to complete the scenario. During the test, we record the subjects point of view by filming, so that after the test they can watch their test run again and do a retrospective think-aloud. To get the information we look for from our test participants we opted to use retrospective think-aloud, instead of concurrent think-aloud (where the participant speaks during the test tasks). The reason being that this method usually yields explanations, suggestions and reasoning from the participants rather than a direct description of the actions taken, which is usually the case when using the concurrent think aloud method (Van Den Haak et al., 2003). We had a total of 19 test participants. All of the test participants were native Swedish speakers, and the test script was read to them in Swedish. They had a wide variety of backgrounds ranging from students from several different Lund University faculties, to personal assistants, engineers, researchers, to give some examples. We tested nine participants on level 1, one female and eight male. On level 2 we tested ten participants, five female and five male. All participants were between the age of 20 30, except for two of the male participants from the level 2 tests who were between years old. Only one of the males aged had any prior VR-experience. Ideally we would have used real wearables in a truly interconnected environment. It is possible to emulate concepts and devices that do not exist yet in a virtual world. VR prototyping is a fairly new area of user testing. We looked at IVAR (Alce et al., 2015) to get some ideas on how to build our prototype. If we manage to make our test participants feel immersed enough the fact that they are in a computer generated world with lower fidelity should not matter. At least not for trying out different concepts. However, as noted by Alce et al. (2015) what actually affects a test participant can be hard to single out, since it 7
88 could be a novelty effect, the fact that both the world, and any user interface elements not part of the world, both look like computer game graphics. That or some entirely other factor. During pilot testing we quickly realized that it would be nearly impossible to measure anything useful. The discovery of a nudge or the reason for being able to complete a task depend on too many factors. This makes isolating the effects of what we really want to examine extremely hard. Influencing factors can come from unfamiliarity with the concept of an Internet of things, the fact that everything looks like computer game graphics, unfamiliarity with VR or the controllers. All these just to name a few we can think of. Instead we lean into the idea of an exploratory test instead. We mainly see if we can discover something interesting that might be properly explored in future work, and survey the test participants to see what their experiences are and what they think of our concept. To familiarize the test participants with the HTC Vive, and its controllers, each participant got to play Longbow, the archery game featured in The Lab, a VR-game made by Valve. Each participant got to play for at least five minutes. Our reasoning behind this was that this was a good way to introduce the participants to VR and to make them more comfortable using the equipment. Test level 1 contained of all the nudges A to D. For test level 2 we added an animation to nudges A, C and D, nudge B became about 50 milliseconds long, instead of 10 15, and nudge E became twice as long. A hand icon that showed up on an interactable object when a test participant pointed at that object was also added. This was to improve the interaction design, since several test participants during the level 1 tests had trouble realizing which objects were interactable. 5 Results Which nudges did the test participants notice? Our results shows that the difference between the two levels of intensity had no impact on whether the participants noticed the nudges or not. We found that events, or effects, from the actual environment, like the sun rising, worked as nudges. This is not surprising, since we constantly react to things in our surroundings, artificially created or not. Many of our participants commented that when the sun rose, their attention moved towards the window. Even if there was a large frame around the windows, it was probably the sun that made them look in that direction. Once they look towards the windows some participants did notice the frame, but all participants knew instinctively that they should do something by the windows. Looking at the results in Table 1. The number of participants noticing the nudges, from A to E, for each level A B C D E Level Level Total two nudges stand out, nudge B and C. For both of the level 1 and 2 one particular nudge has more impact than the others, and was the most noticed one, C, the ellipse around a lamp hanging over the projector screen. In total, 14 out of the 19 participants notice the ellipse and understand that you can interact with the lamp. However, the difference that the ellipse was animated on level 2 and not on the other, had no effect from what we can see in the results. The rest of the nudges had an impact on the about same number of participants. A wast noticed by 7, D by 6 and E by 6. One nudge was on the other hand, was only noticed by one of the participants. This was nudge B, a blue arrow only shown for a maximum of about 50 milliseconds in level 2 and about milliseconds in level 1. This is about what we expected though, and again, we have no way of telling if this nudge has any priming effect or not. From just looking at the numbers it would seem like more participants noticed the different animated frames in level 2 better, but keep in mind that there are one more test made on that level. Also remember that we have no good way of measuring what actually causes the test participants to notice a nudge. Relevant comments from retrospective think-aloud During the level 1 tests four of the test participants found that the tasks were unclear, which lead us to implement the hand icons for level 2, see previous section. Two of the participants mentioned that they thought the tasks were hard due to the fact that they were not used to virtual reality. One participant thought that nudge B was a glitch. This was the only mention of nudge B. The hand icons in level 2 were interpreted as mouse pointers by one participant, just as we intended. A comment we got from three different participants was that once they saw, and perhaps felt, the first nudges, A and E, they got the idéa and all the other tasks became simple to complete. Otherwise the most common reaction was How could I miss nudge X it was right in front of me!. Changes to the nudges in our prototype suggested by the test participants The change suggestions we got from the participants were to make the nudges stand out more in one way or another, but changes like that put the nudges at the risk of not being peripheral anymore, but at the center of attention. That would defeat their intended purpose. Suggestions on other possible nudges to use in our scenario The most common answer was again to make the nudges have more impact, such as visual nudging with contrasting or bright colors that stand out against the surrounding environment. The result also showed that the participants wanted a virtual representation of natural objects to interact with, for example to use a virtual light switch to turn off the lights instead of pointing towards the actual lamp. Do the test participants think that nudges are a good idea when performing complex tasks? Nine of the participants stressed in some way that it was important that the nudges were non-intrusive enough, so they did not become a distraction, instead of an aid. One participant did not want any at all, for that reason. Three wanted to try to solve a task, and only get nudges if they got stuck at some point. 8
89 Seven of the participants thought that nudges to show the correct order in which to perform a task, or to show which parts belong together, or something to that effect, was a good idéa. Some wanted the visual nudges to be in the form of frames, while others wanted the nudge as an increase in luminescence instead. In what situation did the participants think that nudges were a good idea? Nudges as a guide for solving or performing complex problems or tasks was the most common use case, as suggested by thirteen of the test participants. Several pointed out that the nudges would only be necessary for novices or beginners, while they should be removed for experienced people. Three participants wanted nudges in the form of information in the surrounding environment, for example a bus stop showing how long it takes for the next bus to show up or shops clearly showing when they are open, and for how long (their business hours). Different reminders, such as give a subtle reminder to leave in time in order to catch the next train or nudge someone into cleaning their apartment, are what three participants suggested. 6 Discussion From hereon, anything we say will be based on our own thoughts and speculations. One of the major problems was to identify and successfully create nudges and interactions that occurred in the peripheral vision or consciousness, without stealing too much attention. Furthermore, these already difficult-to-handle interactions had to be implemented in Unity, a task not so easy when the goal was to achieve as high fidelity as possible. This was mainly due to the team having no prior experience from working with Unity. Thus, the implementation does not quite match the initial design ideas, and it is for the lack of technical expertise on the team s side. The ambition will be to continually improve on the implementation, as has already been done up until this point. The goal will be to eliminate some of the clunkiness, glitches, and bad visuals. The discussions and concepts that were concocted eventually lead to the current prototype. The virtual environment looks real enough to simulate the interactions, albeit in a rudimentary sort of way. The interactions themselves are currently rigid in that only certain hardcoded objects can be interacted with, and it can be done only in a very limited amount of ways. The entire scenario is very much on rails. But given that we test and evaluate this, and only this interaction sequence, its lack of dynamics should cause no major trouble. One big uncertainty in the study lies in the implementation. The study simulates an interconnected future of IoT, which does not exist and is not something most people are familiar with. This simulation is run in a virtual reality world, another technology with which most people are unfamiliar. So there are two layers of abstraction. Two layers of technology to interact with. Two layers of interaction. This adds a significant element of uncertainty. It is a long road between the mind of the user and the imagined world of the end-simulation. A lot can go wrong in between: mental models misaligned, diffusely implemented interactions, disconnects between actual physical interaction methods and the ones simulated in the deepest layer of virtual world. This obviously begs the questions: What is it really that affects the results of the study? Is it, as we hope, only the interaction methods that we investigate? Or are there too many steps of abstraction in between that cause trouble? For instance, some people do not know whether or not certain graphical elements were intended as graphical elements, or if they are a natural part of the VR world. This is a problem. Since everything is virtual, then how can the user know for sure what is meant to represent something virtual and what is meant to represent something real? Some of this is discussed in (Alce et al., 2015). Another problem: the HTC Vive handcontrollers. It is highly unlikely that in the future people will be walking around with large controllers in their hands. Yet this is what the users do in our prototype. Even though we are not specifically investigating the interaction facilitated by the hand-controllers itself, they become part of the link between user and simulated VR world. Actually having to use these controllers might create a disconnect between what the user is actually doing and what we are truly trying to simulate. And if not, it might still serve as a distraction and increase the cognitive load. We are forced to assume that our results can never be fully accurate and reliable unless the study is conducted in a true, real-world IoT-enabled environment. But since such an environment does not yet exist, the only way forward is for us to easen the means of interaction for the user, as much as possible. Any, for our study, inconsequential interactions need to take as little cognitive load as possible. It was crucial to immerse the user as deeply as possible in the simulated VR world. Some people with more experience in VR technology would likely have an easier time ignoring the real world and focusing on the interactions in the virtual world. Of course, we try to achieve this with everyone. Each person is eased into the VR technology and allowed to play VR games to familiarize and acclimatize themselves. In a better world with more time, test participants could have been repeatedly invited over a longer period of time, allowing them to become natural users not only of VR technology, but also of the imagined technology in our simulated world. In such a case, we could perhaps have conducted a much more realistic study representative of what might be in the years to come. Further discussion about the implementation can also be had. Due to lacking technical expertise (none of the team members were professional Unity game developers) the hi-fi prototype was obviously not perfect. In the final version, all bugs were eliminated. The scenario was much more expansive than in the beginning, the world was more visually pleasing and interactions were smoother. But irregardless, we still could not accurately translate our ideas to code to the extent we wished. Some ideas even had to be modified slightly with regard to this. So this actually lead to a forced adjustment of our ideas and the project itself. We had to narrow down some interactions and we had to simplify some things and we had to change the visuals of certain nudges - not because we initially wanted to, but because we could not implement whatever we wanted. While this did not dramatically alter anything, it is still important to be aware of this sort of evolution of the project. In part, it is valuable to understand this nature of software development - that everything simply cannot be implemented exactly as designed. But it is also important to be careful and to be on guard, for if a too big technical obstacle is encountered, it might drastically change the project. If an important element cannot be implemented, the initial topics of investigation might be rendered obsolete. In our case, we avoided trouble fairly well. The biggest change was that instead of dynamically highlight or mark objects along their edges, more rigid graphical 9
90 frames were applied around them instead. And we are aware this might have been a contributing factor in the problem that some test subjects had with distinguishing between what we intended to be virtual elements within the virtual world and what we intended to be real objects within the virtual world. One thing to ask ourselves here is just how strongly do we need to nudge people to make the nudge effective - and will we move out of the periphery in doing so? Remember that Weiser and Brown (1997) mean that it should be okay for our nudges to shift the user s attention seamlessly between the periphery and the center of attention, as long as the user, for the most part, voluntarily controls the attentional shifts. Forcing the user to snap the focus, or attention, to our nudge will mean a complete failure. It is uncharted waters compared to many other fields of interaction studies, where there is much more scientific research already made. It is important to underline that our result is based on interview questions and observations, and not objective data collections. We cannot be sure that our test subjects did not look at that nudge, they might have, but did not register them. To be able to make sure if the nudges are noticed or not, it is necessary to make the study with some kind of eye- or gaze-tracking. Nevertheless, from our result we got the impression that visual nudging (with colors that have good contrast to the environment) is the best way to get useful help from nudges. However, this will make the nudges become in the center of focus and not periphery. Even though only approximately 30% noticed the small vibration in the hand controller when moving it over an object that could be interacted with, this was the nudge that had the most (except visual) positive feedback. The participants thought that the vibration took their focus for a short time, enough to make them change their focus, but not so much that they lost track on everything else. Another part of our observations, was that natural nudges triggered the subjects focus to objects that should be connected to that nudge. With natural nudges we mean e.g. the sun rising and thus lighting up the room. When the sunshine gets into the room, it becomes irritating during our scenario. Therefore the subjects focused on the windows and felt that they should interact with something there, and in this case the curtains. We believe that nudges are good and useful if they are used in the right way. From the overall feedback we got, more or less all our testers thought that nudges are good, but in different scenarios. Nudges should not be center focused, unless you want them to be, and that the user must have the opportunity to turn the nudges off, otherwise they will be a disturbance. Some of the test subjects did not feel right interacting with an object from a distance and with your hand, we believe that it is because today you control the objects to be interacted with in a close distance. If we would made this same test in maybe 10 years, when IoT have become a part of our every day life, the result probably would be different. Another thing that might take peripheral interaction a leap forward is properly working gaze tracking, which means that the possibility and accuracy of predicting the goals and intentions of the user make it possible to provide relevant cues in the environment about what would be appropriate, or possible, actions to bring the user closer to the current goal. For this to work, potential false positives, eye movements originating from other cognition than the user s current explicit goals, such as saccades and effects from remembering a scene, must be filtered out properly. Some sort of simple understanding of the task being performed combined with gaze tracking could lead to very interesting interaction design, both using the periphery and normal interaction at the center of attention. One final thing: peripheral interaction, and especially nudging, could have some really nasty implications. Again, it was Dr. Thomas Pederson who pointed out the possible dangers if someone manages to make nudging so good that it becomes possible to nudge people to do things they otherwise might not, or worse, would normally never do, without them realizing that they were manipulated to perform the action. This is why he always needs to take extra considerations when delving into some areas of research in peripheral interaction. Imagine unscrupulous marketers with the tools to make consumers buy anything or politicians forcing people to vote a certain way. We will hopefully never get there, and to our knowledge, they have not succeeded yet. 7 Future work In conclusion, this study and report delved into aspects of peripheral interaction, opening new doors and raising questions. The work here is far from done. The nudges are a promising concept. What is needed is to thoroughly examine whether they have any positive effects on task solving or problem solving. One way to see if people notice them at all is by using eye-tracking. Even if they are not consciously noticed, they could still be registered by the brain and help prime a user to make task or problem solving easier. Another thing that is needed to get accurate performance results from user tests is that people need to become more used to and comfortable with the concept of Internet of things. If a virtual environment is used for the tests, people need to be more familiar with that kind of setting too. Future work could benefit from longer studies with recurring tests, to eliminate part of the novelty of the concept and the unfamiliarity of the virtual environment. As it stands now, our tests results are based on people thrust into an unfamiliar situation, instead of them handling the technology with the everyday-ease one would have in a future were this technology was real. Additionally, future studies could attempt to enhance the visual fidelity of the implementation, perhaps even moving into augmented reality. This would make the distinction between UI and physical objects more clear, and it would be more realistic. It would be interesting to implement a more gesture based control scheme, rather than just the pointing and button pressing in the current prototype. This would also allow for more complex tasks to be explored. One of the really appealing uses for nudges is to aid during complex and/or completely new tasks. The effects from nudges might not appear in tasks that are too simple. From the survey answers we get that nudges might be useful to novices, but mostly be irritating to experts. What needs to be explored in the future is what the appropriate level and quantity of nudges are for people of different skill levels. What is also needed is to find the right amount of nudges in the environment, to prevent them of just being seen as clutter that provide information overload. Another thing to explore would be to try nudges for different modalities. We have only implemented tactile and visual nudges, but it would be interesting to try auditory nudges or scent nudges. Speaking of different modalities, the effectiveness of multi modal versus single modal nudges also need to be explored in the future. Anyone interested in peripheral interaction will have their work cut out for them. 10
91 References Alce, G., Hermodsson, K., Wallergård, M., Thern, L., and Hadzovic, T. (2015). A prototyping method to simulate wearable augmented reality interaction in a virtual environmenta pilot study. International Journal of Virtual Worlds and Human Computer Interaction, 3: Bakker, S. S. (2013). Design for peripheral interaction. PhD thesis, Technische Universiteit Eindhoven. Berger, J., Meredith, M., and Wheeler, S. C. (2008). Contextual priming: Where people vote affects how they vote. Proceedings of the National Academy of Sciences, 105(26): Garrod, S. and Pickering, M. J. (2004). Why is conversation so easy? Trends in cognitive sciences, 8(1):8 11. Gazzinga, M. S., Ivry, R. B., and Mangun, G. R. (2014). Cognitive Neuroscience The Biology of the Mind. W. W. Norton and Company. Inc., New York, 4th edition. Salgado-Montejo, A., Tapia Leon, I., Elliot, A. J., Salgado, C. J., and Spence, C. (2015). Smiles over frowns: When curved lines influence product preference. Psychology & Marketing, 32(7): Torralba, A., Oliva, A., Castelhano, M. S., and Henderson, J. M. (2006). Contextual guidance of eye movements and attention in real-world scenes: the role of global features in object search. Psychological review, 113(4):766. Van Den Haak, M., De Jong, M., and Jan Schellens, P. (2003). Retrospective vs. concurrent think-aloud protocols: testing the usability of an online library catalogue. Behaviour & information technology, 22(5): Weiser, M. and Brown, J. S. (1997). The coming age of calm technology. In Beyond calculation, pages Springer. Wilson, M. (2002). Six views of embodied cognition. Psychonomic bulletin & review, 9(4): Gidlöf, K., Wallin, A., Dewhurst, R., and Holmqvist, K. (2013). Using eye tracking to trace a cognitive process: Gaze behaviour during decision making in a natural environment. Journal of Eye Movement Research, 6(1). Grant, E. R. and Spivey, M. J. (2003). Eye movements and problem solving guiding attention guides thought. Psychological Science, 14(5): Ha, Y. and Lennon, S. J. (2010). Online visual merchandising (vmd) cues and consumer pleasure and arousal: purchasing versus browsing situation. Psychology & Marketing, 27(2): Hausen, D. (2014). Peripheral interaction: exploring the design space. PhD thesis, München, Ludwig-Maximilians- Universität, Diss., Henderson, J. M. (2007). Regarding scenes. Current Directions in Psychological Science, (4):219. Holler, J. and Wilkin, K. (2009). Communicating common ground: how mutually shared knowledge influences the representation of semantic information in speech and gesture in a narrative task. Language and cognitive processes, 24: Johansson, R., Holsanova, J., and Holmqvist, K. (2013). Using Eye Movements and Spoken Discourse as Windows to Inner Space. Oxford University Press. Lakoff, G. and Johnson, M. (2008). University of Chicago press. Metaphors we live by. Lave, J. (1988). Cognition in practice: Mind, mathematics and culture in everyday life. Cambridge University Press. Magnusson, C., Rassmus-Gröhn, K., Tollmar, K., and Deaner, E., editors (2009). User Study Guidelines, Theme 3. ULUND, Haptimap Consortium. Navalpakkam, V. and Itti, L. (2005). Modeling the influence of task on attention. Vision research, 45(2):
92
93
, which allows users to get an")
94 IoT interaction, we simultaneously introduce benchmarks for ubiquitous computing, that can be used for future studies in interaction design. The three interaction models we have developed are the floating icon model, which has virtual icons anchored by the smart devices, the world-in-miniature model (WIM), which allows users to get an overview of where they are and control devices with that 3D model, and the menu model, which allows for a control panel the user can scroll through, select and manage devices from. The models have been used in an experiment where users had to manage a lab environment filled with virtual devices, so that different measures can be compared according to which model the task was done with and if there were few or many irrelevant holograms included, with the results also discussed in this paper. By comparing these models, we try to elucidate which approaches to present information are better, given different circumstances, such as how many devices one wants to manage with the AR system. 2 Background A number of interesting matters are related to this project due to the scope of the problems raised by AR interaction. Which problems that need to be addressed first was one such matter, and how to engage with them in an effective and efficient way was another. Below we discuss where this project initially began and how and why we chose our focus as we did. Project focus There are many issues raised about how IoT-management should be designed, such that humans (not robots) can have a pleasant and effective experience, not creating another difficult technical task that will require the need for trained workers. One of which is the problem with how all these devices are supposed to be included holistically in one s smart environment, as many devices will surely be produced by different makers with different technical characteristics, such as which signals they send to communicate with other devices. But aside from the technical aspects, to make IoT-management a viable task for non-experts, focusing on the person who is interacting, is key. This is why looking at the problem of a solution to IoT-management as essentially a cognitive problem, is preferable. With this frame of mind, we understood that taking into consideration how attention works in humans, and what serves as distracting instead of helpful, is important. Coupled with the problem areas brought up by Ledo et al. (2015), it became clear that the discoverability aspect of IoT-interaction is important. If we in a near future have 50 billion connected devices, how could we interact with all of them without overloading users? And how many devices should be shown/active at the same time, and what objects are of most interest? All these questions played a big part in our decision to focus on how to best discover and display devices. Having to deal with discoverability naturally prompted the question of how to deal with the selection of devices, we attempted to address that issue in our development of a system that could manage an IoT-environment. We figured the need for smart filters that are adapted to each user, would be helpful in our design. With user-adapted filters, one could automatically remove that which was uninteresting in a user s environment at a time in short fashion. Another way to deal with discoverability and selection would be to change the priority of devices that would display on an interface to a given user, such that depending on the time of day, the day of the week or location of the user, the system adapts to the user automatically. Such context awareness would be a part of the customization of the interface to each user and the user s shifting needs. The hope is that in the future the interface and the HoloLens or any another AR-system could learn and adapt individually for each user and get to know the person, thereafter adjust the interface and the devices shown. However, that would be much later in the development and not in the scope for this project. Due to the limited time for this project, we decided that our focus would be on the discoverability aspect solely, and not the selection part. Since selection is a less pressing matter for attention-friendly interfaces. This resulted in our three different models in how to discover devices. Problem engagement The first thing we did to engage in this field was to brainstorm ideas of what a HoloLens and the AR technology could be used to (Fig. 1), as the potential uses are incredibly vast. Some questions were raised about the fact that AR could bring more challenges than benefits, and much of the interaction with devices could be made with simple apps that most of today s internet-cunning population know how to use. Very quickly we agreed that we wanted to solve problems, not create new ones, making the system feel unnecessary. We wanted to make the interaction with devices easier and make AR potentially a part of every person s day, not just for specific workforces or tech-interested people. That brainstorm also lead to a lot of good ideas aside from all the challenges we discovered, for instance how device management could be specified for specific work assignment, like janitors having access to most devices while a secretary might only have access to some devices, which could mean that some types of interfaces are better suited for some assignments but not all. Figure 1. Brainstorming sessions helped with relating all ideas pertaining to the problem of IoT-interaction with AR-systems, which focused us on the ideas that seemed most pressing and doable to work on in our project. After the brainstorming session, we decided that all of us individually would to make lo-fi paper prototypes at home and then discuss pros and cons with all four different prototypes. This was done to avoid influencing each other and get our first prototypes as unrelated as possible. Doing lo-fi prototypes this 2
95 way turned out to produce similar ideas anyways, as there are certain restrictions with the system we want to use. The paper prototypes lead to the crystallization of the first model we developed, which we immediately started developing for the HoloLens, skipping over the creation of midfi prototypes. We did this so that we could get informed on what could be done with the HoloLens and what our programming limitations were. The creation of the first model helped with creating the other models later, as we found interactionlimitations with the first model we could not address without creating an entirely new model. While we learned how to use HoloLens and to program in Unity we decided on three comparable conceptual interfaces (floating icon, WIM and menu), with no need to lo-fi the second model, as it had a straightforward design (a 3D-model of a room), and the third model (a smartphone menu based model) was prototyped with Unity directly. Since we had a good idea on how to use icons as digital objects and wanted similarity between the models, we decided to use icons in the other models as well. After these were developed we could perform first stage test cases to evaluate them. Ideas and inspiration Our ideas for icons as portals to devices stemmed from the fact that it would be difficult to do otherwise given the technology available. To signal to a user with AR technology that an item is connected, this needs to be done through a hologram. One way we looked for ideas was by looking at what techniques game developers have used ideas when solving the problem of discoverability, as they are faced with the same issues of hinting to users what objects in their virtual worlds are interactable. The game developers have over the years developed ways and best practices for interacting with 3Denvironments, some of which can be directly applied to the project at hand. For instance, a common way done in games is that as one gazes over an object, those that are interactable glow at the edges, with a text occasionally appears that says Press F to use. A partial reason for this as a function to discover interactable objects is that in games it is often desirable to obscure the discoverability of objects in order to create a more immersive experience where the players are forced to explore the world. This is directly counterproductive to the usability of an interface from an IoT-discovering point of view. And that solution is only effective if you already are within the virtual world, which you would be with computer games or in VR games, but not with an augmented world. This is because if we were to use glow around interactable objects, the glow would be virtual, but the object itself (e.g. lamp) would be real, so there would be a perceivable disconnect between the glow and real device (and technically it would be difficult to program the glasses to recognize the real objects shape and placement perfectly and not just their approximate location in space). Therefore, these differences between AR and games make them not aligned with the interest of our project, although they would be perfect in VR development. Icons circumvent this problem, by being virtual themselves, as we can manipulate them when a user engages with the icons, such as highlighting when active, or different shading for accessibility. We also only need to know the location of the device, so that an icon can be placed next to it. And items that are hidden in the real world could be visible as icons giving you information of what kind of function that device has and what you can do with it. For the second model, we got inspiration from the worldin-miniature which was presented in Bell et al. (2002). A world-in-miniature model of one s close proximity or room is an efficient way to gather all added information from the system in a limited area, which possibly limits distraction issues, instead of spreading this information out in whichever environment one is in where connected devices occur. One would be able to scale down whichever room, building or area one was in, and get the ability to control all devices through that 3D-model. The HoloLens provides with some functionality regarding this type of interface, as it maps wherever you are and learns your environment. One would only need to continue to develop that functionality so that it could generate models from its mapping that includes icons anchored to real smart devices from one s environment. For the third model, we wanted a more standard humancomputer interface model to compare with the more novel ways of interacting with things, and as such, we took much inspiration from what Microsoft already has developed for their HoloLens. Microsoft has developed an interface that reminds very much of their Windows 10 OS, where you have clear menus and squares representing applications, settings, and functions, that allow you to navigate to wherever you want to go. We decided to emulate that in a similar fashion, as the interface would be implemented in the HoloLens either way, and it could prove effective by listing all devices in one space like the second model, limiting possible distractions that our floating icon model could cause. For the study we wished to do later (comparing the different models) we decided it would be astute to limit the amount of differences between the models, by using the same icons in all models for instance. The only real differences we wanted were the general way in which information was located/presented, either by spreading it out in one s world, or focusing it within a 3D-model, or clicking up a large screen that blocks your view but shows you the information you have access to. 3 Theoretical considerations for an AR design solution Whenever new technology is introduced, there is a danger of overwhelming the users with too much functionality, a high learning curve, hard to understand interfaces and difficult to perceive patterns. Which can, for instance, cause a negative impression of the technology and reduce the general interest in it. Therefore, we attempted already from the start to design our system so that it takes into consideration human cognition and what we know from interaction design, creating a system which helps solve problems for users, not causing new ones; we wanted to create a system which made the user smarter and more efficient in their daily interaction with the world and people. Below, we discuss the theoretical framework we have used in our interaction-model developments, and the design process that has followed from it. A framework for human-technology interaction A powerful framework that can be applied to humantechnology interaction comes from cognitive science and is called connectionism. It attempts to make sense of how mental states (thoughts, emotions, making decisions, problem-solving 3
96 processes) work at a physio-causal level, while also approaching a model of how the brain actually works (Clark, 2001, chapter 4). It explains cognition as the structured activations within neural networks, that together compute and represent information, enabling things such as intelligent decisions and actions, consciousness, and such. This type of model works well in explaining what intelligence is, as the brain actually works by computing information in large sets of populations, that together constitute interconnected networks. The attributes of such networks are what is interesting for the study of human-technology interaction. What networks are great at is learning patterns, and being able to appropriately respond to them. They do so by processes which involve changes being done to the structure of the nets according to certain rules, which evolve networks that can selectively respond to certain stimuli but not others. The networks respond dynamically to input (which could be information gathered from sensory organs or other input from other networks) as activations are fired between neurons, sometimes resulting in patterns of activations that are sent to other appropriate nets or muscle fibers controlling body movements. In this way (leaving many details aside) you can construct a system that can control a body, represent objects in space, understand concepts, among much else, as networks are selectively trained for certain patterns, and together they constitute a full-scale pattern-recognition machine which can do everything that brains do for a living. Assuming that human interaction is in many ways patternrecognition-like, many principles from interaction design make sense and fit into a larger framework, principles we have attempted to follow in our designs. One of these is affordances (Norman, 2002), an affordance being a perceivable feature of a thing that signals what one can do with that thing. For instance, an affordance within an AR system could be a feature of a hologram that invites a specific action to do with it, such a perceivable feature to pull a handle on the hologram. But affordances are just another name for patterns, patterns that are recognized by neural networks that have been trained to recognize certain features in the world, such as an object s grab-ness och push-ness, and it is these patterns when recognized which promptly activates outputs from nets that can be used by other networks that make motor decisions for instance. Another interaction design principle, that also naturally comes out of looking at human-technology interaction as dynamical and pattern-recognizing, is the avoidance of long sequence of arbitrary steps to reach a specific device state. In the light of connectionism this makes sense for several reasons, one being that one does not make use of the power of pattern-recognition when patterns are hidden in layers that are not visible until one reach that point in the arbitrary sequence, and sometimes these sequences do not involve any feedback or update on the device on is using, so that it is not clear what one has done and needs to be done. Another reason arbitrary sequences are a bad idea is that problem-solving in many ways needs this powerful pattern-recognition system to be fed appropriate patterns, but static remotes, or small screens on radios, for instance, do not feed significantly different patterns for such a system to work as effectively as it can. A third reason is that problem-solving in many ways is dynamical, meaning that serial step-by-step actions that computers are good at are not what humans are good at. We are not good at meticulously building detailed plans beforehand and continually updating this plan as we encounter unplanned events. This is why systems providing constant feedback is such an important attribute to have, and to design that in a system, something we have attempted to follow in this project. There should for instance be feedback of how the system is progressing and what result came from the user s action, which also helps the user to recognize, diagnose and recover from errors (Norman, 2002). Loading bars are a great example of such an implementation, but one thing one could do in an AR environment would be to highlight active holograms, meaning that for instance if it is hard to tell that the air conditioner is turned on in the room, but it is hard to tell, the hologram that is used to control it could be highlighted, either with a green blinking light or some sort of change in shading compared to other devices that are turned off. Pushing and pulling attention to the right active areas is also an important principle to work by, since in such a manner the pattern-recognition networks can be fed appropriate input, as one s attention shifts to the right spot with the gaze following. This can be implemented by making task-relevant holograms stand out, with some highlighting or such in this case as well. In summary, one of the primary features a system needs to have according to these principles and this framework, is to make information visible, not necessarily by visual means though, as other sensory modalities such as hearing and feeling can be exploited as well. For instance, patterns should be available that tell a user what function a thing has, what current state a thing is in, or what you are allowed to manipulate (Norman, 2002). Or, if we would want to show what access a user has in an office, we could for instance gray out the virtual objects a user does not have access to. The framework of connectionism bring these principles together in a way that shines light on how human-technology interacts work, and argues for why one should follow these principles if one want to create a type of interaction with humans and technology that is natural and functional. Technological limitations for the current system As of to date, the currently best AR-technology available to the public is the Microsoft HoloLens and the Meta 2. The product we have used is the HoloLens, and a number of limitations are present. First, the field of view (FOV) seems to be limited to 30 x 17 degrees (Kreylos, 2015), although an exact number is hard to get. The human eye has an FOV of 210 x 125 degrees, and other Virtual Reality (VR) technology such as HTC Vive can reach an FOV of 110 x 100 degrees. In comparison, the HoloLens has a very small FOV, which is obvious for the user. This gives the user a limited screen to interact with holograms with, making it more difficult. The AR world is then perceived as a small box which becomes very visible compared to the real world and not as a part of the real world as desired. Secondly, the number of gestures available is roughly four depending on how you count and adapt them: a bloom gesture which takes the user back to the Windows menu, a click gesture which selects and/or activates a function, a hold gesture which is done after the click to keep something active, and a pulling gesture which can be used to move holograms, scroll on a page, or move a slider for instance. This limits the type of interactions available and the speed of interactions. For instance, there is no way of using both hands to quickly zoom in or out of a hologram, or changing the size of the hologram. You can also not do twisting gestures to flip a hologram for in- 4


97 stance. These functions just listed, zooming and flipping, can be done through the available gestures, although it is bothersome and takes unnecessary time to complete. In the future, we hope this will change, so that there is a vastly increased gesture library, which also can be designed by the user for customizable gestures, easy to implement. Thirdly, is the lack of eye-tracking technology in the HoloLens. This is certainly something that will be included in future AR-technology, although at this point it is not easy to implement yourself. The potential with including eye-tracking is very favorable, since it could increase interaction speed tremendously. Another thing to take into consideration with today s technology is that the primary focus is on vision at the moment, but potentially touch could be incorporated through vibrations or heat. Sound obviously already has a role but not much has been done to exploit this information channel compared to the visual channel. If the technology developed in ways including other sensory channels, many benefits would ensue, although it seems difficult to add touch and sound when the systems shrink in size as they hopefully will, but that might just be a technological problem. Figure 2. Floating Icon model, the icon states that the gaze is currently colliding with the icon by lighting up. Design process For the design process, brainstorming was used to identify problems and ideas for solutions. Following that, iterative development with several stages of prototyping was done. Paired with discussions and use cases, different low-fidelity prototypes was used to convey proof-of-concept and identify requirements. Low-fidelity prototyping has the big advantage of being a quick and cheap way to explore multiple design concepts (Rogers et al. 2011). Because of the limited ways of hi-fidelity prototyping for AR environments, an iterative approach for actual implementation was used. For the development and implementation of the models in the HoloLens, two main applications have been used: Unity 5.4.0f3 Hololens edition (Unity Technologies, 2016) and Microsoft Visual Studio 2015 (Microsoft, 2016). Unity is a highly optimized game design program ideal for creating 3D applications for virtual and augmented reality. Visual Studio was used as an IDE for creating scripts used in Unity. 4 First Iteration of the Three Models The research question and the theoretical background for the project resulted in three different interaction models: the floating icon model, the WIM model, and the menu model. As it was important to keep the interaction between each model as consistent as possible, all three models have the same icons that behave in similar ways when gazed and tapped on. Since the number of gestures is limited in the HoloLens, the interaction in all models are based on the ready, tap, hold and pull gestures. The Floating Icon Model The first model proposed is centered around the idea that interactable holograms are placed in the surrounding environment, in proximity to the device it represents. The virtual icons are presented in a first person perspective, meaning that depending on where you are in a room, the virtual icon will adjust to your position and gaze in a natural way. All the icons have been designed to be flat 2D holograms, and always presented Figure 3. Floating Icon model, the icon states that the gaze is not on the icon. from the front to the user, so as to prevent decreased recognition of icons due to viewing the icons from an unusual angle, e.g. from behind, underneath, above etc. By always presenting the icon from the front, it is predicted that user familiarization will be faster than if the icons would dynamically change depending on your position to it. A user has the ability to gaze on an icon, whereby the icon changes dynamically, informing the user that actions can be performed on that icon (an icon that does not change color when gazed at signifies that the user does not have access to that device), see Figure 2 and 4. Thereafter the user can simply tap to activate the device s most basic function, e.g. for a lamp icon, clicking on it would turn on/off the lamp. As is shown in Figure 2, the microwave is active when the color is blue. When the gaze is not on the icon the color is slightly less bright as shown in Figure 3. If the user taps on the icon, the microwave is turned off and the icon changes color to gray, see Figure 4. The gray color is less bright when not gazed on. All icons have different colors but have the same gray color when turned off and are less bright when not gazed on. These digital behaviors have been developed to help the user to more easily perceive changes and active states, while also giving feedback for actions one has performed. The World-in-Miniature Model The second model developed is built on the idea that the environment a user wants to control in can be modeled as an interactable hologram with icons at appropriate locations just as in the first model. This hologram can be resized, adjusted, and should in the future be quick to generate and customizable for whatever function a user wants to have, e.g. modeling a 5
.")


.")
98 Figure 4. Floating Icon model, the icon states that the device is not active. Figure 6. Menu model, the start menu is shown with four icons. Figure 5. First iteration of the WIM model. Figure 7. Menu model, a sub-menu appears when a device is selected. whole office building, a smaller area of a larger open space, a specific room, a home etc. (see Figure 5). The same ideas in the first model are relevant in this second model: icons are still presented in a first person perspective, the icons are interactable and change dynamically, and the same menu will appear when pulling at the icon. The user can then control or see what devices that are available in the building without seeing them physically. The icons are placed where the actual device is located in the room, see Figure 5. The icon is put on top of a hologram of the device and the room is furnished as the real room to create recognition. Icons only appear on devices that the user can or has access to interact with. In the current state of the WIM model, the room is not representative of the space the user is in. This would, however, be a desirable feature in the future. The Menu Model The last model was designed to represent the more common ways of interacting with devices (computers and smartphones being the most common). Since the development was done in the HoloLens environment, it was designed to resemble the Windows 10 operative system, see Figure 6. The menu follows the users head movements so that the user does not lose the menu if he or she moves in space or gazes somewhere else. The first iteration of the third model consists of a start menu with a list of all devices. If tapped on another menu appears on the closest side of the main menu. The sub menu shows how the user can interact with the device, e.g turn on and off a lamp, see Figure 7. This model has no indication of where in the room (or which room) the device is located. To indicate which device that has been selected in the menu a red outline appears and the head of the submenu has the same color as the device s icon, see Figure 7, to create resemblance for the user. If the user wants to deselect the device she simply taps the icon again and the submenu disappears. If another icon is selected when a submenu is displayed the submenu changes to the newly selected device. 5 First user evaluation A short testing suite was created for exploratory testing of the projects middle stage, as a good way to get input for further development (Rubin & Chisnell, 2008). Six preliminary tests were performed. A short introduction manual was written as well as a debriefing document to provide consistency in the tests. Method The participants got a short introduction to the Microsoft HoloLens and the project itself, as well as an introduction for how to interact with the different models. User behaviors were observed and after evaluating the design the test subjects went through a short debriefing. Only qualitative data and input was gathered in the form of an interview, apart from some quantitative data about users previous HoloLens experience. There was no screening or selection of the participants and they were selected only based on availability. Results There were six tests performed in total. Some who previously used the HoloLens and some who were new to the concept of Augmented Reality. 6

99 Table 1. HoloLens experience. Previous Experience with HoloLens Yes 2 No 4 The participants had some problem seeing the connection between the different models. Depending on scenarios, context, and usability, the users preferred different models. Table 2. Model preferences. User Preferred models Most usable model 1 2, ,3 2,3 3 1,2-4 1, , The Floating Icon model Some three main issues with the floating icon model were identified: 1) big icons might hide information, but they are clear and easy to see, 2) users need to have the devices in sight in order to interact with it, which could be annoying, and 3) there might not be much use with the model if you have to stand next to the device. In general, there is not much functionality within the model. The World-in-Miniature model The WIM model was very bare-bone and got more feedback. This could be summarized into five points: 1) the perspective of the model is very important in order to see icons properly, 2) it would be good if the walls were more see through so they don t obstruct the view, 3) it is hard to use and to see the different icons in the model, and annoying to only have one gesture to manipulate the model with, 4) scaling the model was difficult, and 5) the WIM model is good in unfamiliar environments to get an overview of the room, but not so useful at home/work. The Menu model The feedback of the menu model can be made into four main points: 1) the menu could be obstructing reality since it is rather big, 2) the model seems like a good way to interact with and handle devices, however, it can be hard to see the mapping to reality, 3) everything is done in one place as physically moving around is not required, which is good, and 4) it could have issues with scaling as the number of devices grows. User evaluation summary The variation of the participants during the test was rather good despite having no clear screening process. The biggest problem the participants had with the floating icons model is the lack of functionality as well as obstruction and filtering in situations with many devices. This can be combated with context-aware filters and user customization, whereby only the icons that are relevant in one given moment Figure 8. The gaze would illuminate slightly upon detecting a hand in a ready position. will be shown. This model does have some cognitive benefits though, as in a logical placement of the icons if one is in an environment one is used to. The tests hint that using spatial memory is the main benefit of the model. The WIM was missing all of the essential manipulation features at this stage. The problem with occlusion of walls was identified, which at this point did not seem tough to solve. The desired realism of the model was also discussed. The positive with the model was identified as the fixation of information in a small visual space. The menu model was more appreciated than expected. It is comparable to a regular computer screen, placed in virtual reality. The participants identified issues with scaling but liked the fast interaction and the similarity to smartphone interaction. These results from the user evaluation were used to direct the following development of the models. 6 Final Iteration of the Three Models General Improvements Some general fixes were still in the backlog of the development since the first part of the project, as well as some new issues discovered with the user evaluations. One of the issues was the ready-state for inputting a tap command to the HoloLens. The HoloLens can only detect the tap gesture if the hand has first been identified. Without this functionality, a user will often tap the air thinking the command was issued, with frustration to follow as the application does not respond. To improve the usability of all models, this ready-state was represented in the second iteration. This was done by illuminating the gaze slightly when a hand is detected by the HoloLens, see Figure 8. This distinguishes it from the normal state of the gaze, see Figure 9. The second general point in usability improvement was also done to the gaze, this time with wall colliding, see Figure 10. Sometimes when users tried to interact with the models they lost track of their gaze, as it only collided with holograms. This was fixed in the second iteration of all models, making it easier for the user to know where they were currently gazing. However, this also introduced some issues with the floating icon model, discussed in the next chapter. During the pilot testing of the last iteration, a problem was identified with the blinders. It was not clear to users what the different states of the blinders were and what was considered the on state. To make the states clearer, a second icon was 7


100 Figure 9. Without a hand detected, the gaze is not illuminated. Figure 12. Every icon is placed in x,y,z-relation to a real world anchor point Figure 10. The Gaze collides with walls and objects for easier navigation. introduced in the off state to show the blinder going up and down as well as the change of the color, see Figure 11. The Floating Icon model The floating icon model did not get much-added functionality for the final iteration, other than placement of icons. Every icon got placed at the location of a device in the environment of the VR lab. This was done by iterative fine tweaking of each icon, placed a certain x, y and z distance from a common anchor point, see Figure 12. This anchor point represents a real world point scanned with the HoloLens depth camera, and attaches the hologram to this position. This ensures that every icon stays at the position of its corresponding device. This Figure 13. The Floating Icon model with icons placed around the VR lab. resulted in a room filled with icons, as seen in Figure 13. A problem that arose with the general inclusion of gaze wall collision in the models, was that some icons would end up behind a wall, rendering it unusable. This was solved by implementing a special filter, detecting if a device was behind the wall, and then placing the gaze on this device instead of the wall. This resulted in a behavior seen in Figure 14. The World-in-Miniature model Figure 11. The two states of the blinds. The WIM model was updated in several ways. First of all, the room model was replaced with a miniature representation of the VR lab environment. Icons were then added to the miniature, with locations corresponding to the floating icon model. In order to control the model, four different modes of interactions were introduced: Use, Move, Scale and Rotate. These interaction modes are represented by four colorful buttons. The currently selected mode is represented by a red bar, as seen in Figure 15. The Use mode was added for two reasons: 1) So that a mode with no manipulation could be set. 2) To remove wall collides of the invisible outside walls of the model. The second point is represented in Figure 16. When any other mode than the Use mode is selected, the gaze will not enter through the wall of the model, making it impossible to 8


.")

101 Figure 14. The gaze goes through walls when looking straight at a icon. Figure 17. The Menu model. The Menu model The menu model received several changes due to feedback and implementation difficulty. Icons were enlarged and a paging system was introduced, with 6 icons per page. The currently selected page was represented by a slider at the bottom of the model, see Figure Second user evaluation: The experimental study Figure 15. The WIM model in scale mode. click on most of the icons. However, the wall collision on the outside of the model was still desirable, as it provided easier manipulation in the three other modes. To move the model one simply tap and hold the model when that function is active, and then moving it around by dragging and holding. Scaling was done by tapping and holding, then dragging the hand to either the left or right to shrink or enlarge the model (when that function is active). The rotatemode works in the same way as scaling does, but instead rotates the model around its center axis. This introduced a problem with the controls, represented in Figure 16. If the model was rotated, the controls would rotate with it and therefore be occluded by the model. The ideal way would be to always keep the controls towards the user, however, this was not implemented due to a lack of time. Introduction The first user evaluation provided feedback for improvement of the models, and after subsequent development, the models were ready to be pitted against each other in a controlled study. The purpose of this evaluation was to examine, in a controlled manner, the differences in using the models in a task that required interaction with devices, by gathering both quantitative and qualitative data, which includes the participants perceived workload, their duration of interaction, and the number of errors made by the them. As these models were newly developed, it was difficult to make predictions about their use prior to the testing, as we did not have any valid informative data we could use from previous testing, and we could not find any previous studies that present data that pertains to the use of our models. As such, this study was exploratory, and no hypotheses were made prior to the test, thus only post hoc analysis was performed. Design Figure 16. The Gaze does not pass through the walls in the rotate mode. In the study, all participants were to complete an interactive task using all three models. Half of the participants were to solve the task in what we call a low icon density environment, meaning that the the models presented few smart devices, whilst the other group had to solve the task in a high icon density environment, with models presenting many devices. Due to the limitations of our system, we did not have any actual smart devices we could connect to the HoloLens, but virtual devices were used instead, devices that were presented as if they existed in the world, when they in fact did not exist in our laboratory. Thus, each group had three conditions for their data, such that a 2x3 design resulted. With this design, we made comparisons within each group and within each model. 9
, with the only person who had any known form of colorblindness (male, red-green). Group 2 had 10 participants (2 female), mean age 24,0 years (SD = 1.05).")

102 Materials and participants Participants were enrolled at the university, with the majority being students from the engineering department. Group 1 had 11 participants (3 female), mean age years (SD = 3.33), with the only person who had any known form of colorblindness (male, red-green). Group 2 had 10 participants (2 female), mean age 24,0 years (SD = 1.05). The participants did not receive monetary compensations for participation. The system used was an application developed in Unity 5.4.0f3 HoloLens edition, together with the Microsoft HoloLens Development Edition. Video from the HoloLens was streamed to a computer, and recorded with OBS (Open Broadcaster Software) Studio 17 (OBS Studio, 2016; Thompson, 2016), while a standard USB webcam recorded the participants as well. The experiment was performed in the Virtual Reality lab at the Department of Design Sciences in Lund. The surveys were answered on a desktop computer in the Virtual Reality lab. For the task description, see Appendix B. Procedure The test was performed according to Figure 18. Participants were first introduced to the lab, where they signed a consent form, to enable us to record them (Appendix A). Then they filled out a pre-test survey (Appendix B), asking them for personal information, and how much they regarded themselves as savvy with technology and computer games. Then they were introduced to the HoloLens, and went through a small guide with a training-model we created, where they could practice gaze placement, the click-gesture, and the four functions we included with the WIM model. When they were deemed fit to begin our task, they were placed at a predetermined location, where they had unlimited time to prepare for the task. They read through the instructions, and were told that they had access to the instructions during all time. When they were ready, we told them to start and recording began. When the participants were done with the tasks and surveys, a short semi-structured interview was performed with them (see Appendix E for details on the questions). Results All participants completed the task for each model. Only three data points were lost, since we lost the recording from the HoloLens in three tests (63 tests were conducted). This made it impossible to count the number of errors made in those three trials. A comparison of the groups revealed that the group that had tests in a low icon density environment were slightly more confident as proficient with technology and computer games, with low variability (Table 3). Table 3. The scores on the pre-test questions, asking for the participants confidence in their technology and computer games skills. Group Technology Games Low icon density 7.0, IQR = 1 6.0, IQR = 1.5 High icon density 5.5, IQR = 1 5.0, IQR = 1.75 The distribution of weighted TLX-scores can be seen in Figure 19. Overall, the low icon density group responded that the task they performed was less demanding than the group with a high icon density environment. The group with more icons provided more varied responses to their workload as well. With the distribution split between group and model, we found that the low group had fewer outliers for all models (see Fig. 20), while in the high group the variability was especially high for the WIM and floating icon models. The menu model was perceived fairly equal between the participants in perceived workload, both within the group and within the model itself, compared to the other models. Figure 18. performed. An overview of the different steps each test participant The task was free to be solved in whichever way the participant wanted to. It included shutting off all the computers in the room, turning of two specific lamps by the whiteboard, and pulling down the blinders on all windows (see Appendix C for details). When the participant was done with the task, he or she had to answer a short survey asking questions regarding how difficult the task was to complete, and if they were distracted by the icons not included in the task (Appendix D); and after this survey they did the NASA-TLX questionnaire online (Sharek, 2009). After having done both surveys, the participants were placed at the same location as before, and had time to read through the instructions again. The task and survey were repeated two more times, for a total of three times, one for each model. Figure 19. Density plot showing the weighted TLX-scores from all participants. The group with fewer icons in their models responded more evenly between all models, compared to the group with many icons in their models. Post hoc comparisons of the mean values for all subscales on the NASA-TLX test within each group, determined by the 10

.")
103 Table 5. Workload values from the NASA-TLX test for the high icon density group. Measure Icon World Menu p-value Total score Mental Demand Physical Demand Temporal Demans Performance Effort Frustration Table 6. Mean weighted TLX-scores between the same model but with different icon density. Model Low icon density High icon density p-value Icon World Menu Figure 20. Density plot showing the weighted TLX-scores from all participants divided by group and model. Friedman-test, revealed significant differences, which varied between the two groups (Table 4). In the low icon density group, participants responded that mental and physical demand was lower for the menu model compared to the other models, and that the mental demand for the WIM model was higher. But differences for the complete workload measure was non-significant. high amount of icons, and it took much longer to complete compared to the other two models in the high icon density condition. The distribution can be seen in figure 21. Table 4. Workload values from the NASA-TLX test for the low icon density group. Measure Icon World Menu p-value Total score Mental Demand Physical Demand Temporal Demand Performance Effort Frustration Differences for the high icon density group were in different measures, specifically for effort and frustration, but also mental demand again, and there was a significant difference for the complete workload measure as well (Table 5). To compare the mean weighted TLX-scores within each model, conditioned by the number of icons, Mann-Whitney U tests were done for each model. A significant difference for the number of icons and how that affected perceived workload was only obtained for the WIM model (Table 6). The measure of duration for task completion revealed that for the low icon density group, the duration did not vary significantly between the models (Table 7). There was also no significant difference for the icon and menu models when compared with themselves in different icon densities. What was significant was the WIM model compared to itself, with the participants taking much longer to complete the task with a Figure 21. Box plot showing the median and first to third quartile range, with the whiskers extending to ± 1.5 quartiles from the median. The variability for the task duration between the models is higher in a high icon density environment. Comparisons were also done on the mean number of errors (we defined errors as any gesture that was unsuccessfully tracked, and any action on the task-irrelevant devices), divided per model and group (Table 9). The only significant difference was for the WIM model, where with a high icon density environment, the amount of mistake rose sharply. The results from the post-test survey, which asked a number of questions, is presented in figure 22. The participants were asked 1) if they found it difficult to find the virtual devices they were looking for, 2) if the irrelevant virtual devices 11
104 Table 7. Median duration (s) for task completion, divided by model and group. Model Low icon density High icon density p-value Icon 78, SD = , SD = World 73, SD = , SD = 165 <.001 Menu 51, SD = , SD = p-value Table 8. Means for the number of mistakes per model and group. Model Low icon density High icon density p-value Icon 8.73, SD = , SD= World 4.40, SD = , SD= Menu 10.0, SD = , SD= p-value were distracting, 3) if they felt it was difficult to complete the task, 4) if they were not aware of the real world as they completed the task, and 5) if it was easy to understand what virtual devices the icons signified. Within-model comparisons revealed that the only significant differences were for the WIM models, on question 2, W = 13, p =.0027, and 3, W = 16, p = Generally, the data says that the participants did not find it difficult to find what they were looking for (but high variability for the floating icon model). The irrelevant icons were distracting especially for the WIM model, but also for the other models in the high icon density group. The task itself was not difficult to complete except for the WIM model in the high condition. The participants were generally focused on the holograms and not their surroundings, but less so with the floating icon model for some participants, as the data is more varied here. Most agreed that the icons were easy to read, except for the menu model with many icons, as there was more variability in that set of data. To control if the participants became better at the task as they repeated the same task but in with different models, data for all participants was compared according to what order they did it in (taking no consideration of what model it was, as the order of the trials were randomized from the beginning). A Friedman test revealed that the duration for completing the task dropped significantly, but not the complete TLX-score. A Spearman correlation test revealed that duration and complete TLX-score was significant though, r s = 0.41, p <.001, complicating the matter. Table 9. Average duration and complete TLX-score for all participants divided by order of trial. Measure 1st trial 2nd trial 3rd trial p-value TLX-score Duration (S) Interview answers Initial thoughts. The participants generally thought that using AR to control devices was a new, cool technique, with a very promising future. They felt that the interaction with the HoloLens was not perfect, and that the gesture recognition system was not intuitive. Despite this many saw AR as potentially being implemented full scale in the future, that could be used to interact and control different devices in the home or office. Some also had troubles connecting what the virtual icons in the menu model were connected with in the real world, which essentially is the problem with the menu model. But they agreed in that as long as you know your items and name them properly, you can know what the icons connect to in that way. Had you preferred to control the objects by hand if you could? Overall everybody was positive to use holograms to control different devices. Those who hesitated said that for nearby devices they would prefer to use normal means of control instead, simply because it is a habit or the fastest way. They also said that they would only use an AR-system if they already wore it as in the case when such systems would be an everyday thing, but not put it on if they could manually manipulate their device instead. Was it easy or hard to use HoloLensen, and if so, why? The participants responded generally that is was quite easy to use the HoloLens, although there were adjustments issues when fitting it on the head for some. Many complained about the small FOV and that they had to turn their head more than usual to see everything. Some also described that they forgot about the real world around them. How did you feel it was like to read the icons, to understand which object they belonged to? The participants agreed that most of the icons were easy to understand. The difficulty to connect the icon with the device varied between the models. The menu model was especially hard. In particular deciding which lamp to turn off. Many did not read the text but only looked at the icon and could not tell the difference between the lamps. It also became clear that there were some troubles with the colors of the icons and the lighting conditions in the room. For example, the green color of the computers when turned on was hard to separate from the gray color when turned off. Many also had troubles with conceptually understanding when a blinder is on or off, even if the icons for our blinders changed to represent being up or down. Was it easier to do the task for the third time as you recognized the virtual objects you would control? Most thought it was easier to complete the task the third time. They had learned the scenario, mastered the gestures and were more familiar with the icons. Those who said that it was equally difficult each time said that they forgot the scenario and had to reread it. Or that the difference between the three models made the task essentially different. When there were few icons, would it have helped with the larger icon size, and vice versa? Overall most test persons thought the sizes of the icons were good. Some would have wanted to be able to set the sizes themselves, especially in the floating icon model. Some thought that the only time you wanted different sizes on the icons were in WIM model, and there you could resize the model either way. Some people found it perfect, while others had problems with the WIM model. How was it to interact with the world-in-miniature model, given that there were several extra ways of manipulating it, and more was visually represented at the same time? While many found the instructions easy to follow, they still found it somewhat problematic to manipulate the WIM. Many had missed the point of the Use -mode (we did specifically tell them about this), which enabled interaction through the walls, which was frustrating for the participants at first. When they figured out that, and that they could move their 12

105 Figure 22. The distribution of answers for the post-test survey. DiffFind = if they found it difficult to find the virtual devices they were looking for, Distraction = if the irrelevant virtual devices were distracting, DiffComplete = if they felt it was difficult to complete the task, UnawareReal = if they were not aware of the real world as they completed the task, and EasyRead = if it was easy to understand what virtual devices the icons signified. own body to get a better angle, the interaction worked much better. But a couple of participants did not use the different modes to manipulate the WIM at all. Which model you prefer? There was high variability in which model they preferred. Most people preferred floating icon model, since they felt it was the most intuitive to use. Still many felt that there were situations where the WIM and menu model would work better, since they do not require you to walk around. Some speculated that the floating icon and WIM model would work in unknown environments, giving the user an overview of his current location, while the third model would be effective to use at home, since you already know where everything is. Other thoughts The general consensus was that using AR to control devices felt very futuristic, and that it was very fun to use. Discussion It is important to note that all hypothesis testing has been done post hoc and in high numbers, as this is an explanatory study. Nonetheless, some patterns in the results are clear, and much of its implications are unsurprising. Beginning with the differences between the groups, we found that the group which did the experiment with low icon density answered in the pre-test survey as being more confident in their technology and computer game skills, which needs to be taken into consideration when making group comparisons. But it is not clear how that would affect the results, since there was no significant difference in the mean completion time of the tasks in the icon and menu model between the groups, even if the second group had more distracting icons in their environment. The fact that the second group was much slower in the WIM model also points to the fact that that model is especially difficult to deal with in such conditions, as compared to the other models where there was no significant difference for the perceived workload measure and the number of errors made. It does not seem that the group was worse at technology interaction in general. The pre-test survey might also not actually measure how proficient the person is in technology-interaction in general, possibly only measuring confidence instead. Examining the variability of the workload measure within each group and finding that it was much higher in the high icon density group, indicates that the ease of using the models diverge when there are more holograms and interactions available (Fig. 19). What distinguishes these models is that in the WIM model, the user sees everything there is to see, while in the other models the visual information is partitioned depending on where you look in your surrounding environment, or on what page you are in the menu. In the latter case, you have a visual information filter always active, built into the model itself, something that the WIM model would have to have added onto, where the user could manipulate what holograms are visible. Thus, with few devices to manage, neither model has to be more demanding than the other, suggesting that if an AR system for IoT-control is in use, and there are few devices to manage, it does not matter much how these are presented in terms of perceived workload. But it does matter when there 13
106 are many devices to manage. The variability of the workload score between the participants within each model, in the high icon group, was also much higher (Fig. 20.2), except for the menu model. The menu model even had lower scores on the means for the weighted workload measure (significant in the high icon density condition), which was a bit surprising. Why most people are equally burdened by menus, but some being slightly burdened and some heavily burdened by the two other models, might be because people are used to using menus in daily life already. For the mean scores of the workload measure, we did not expect that the menu model would get the lowest, for any of the two group conditions, because in the low condition we thought the WIM would be a perfect combination of providing spatial information for device localization, while not displaying too much visual information, and in the high condition we thought the floating icon model would make it easier to find the devices the task required. But it is easy to see why that was not the case afterwards (also from discussing with the participants), as a menu can be a very effective tool for clicking on a couple of icons. In the low condition, there were few pages and icons to scan through, while in the floating icon model a user still had to look through the room to find everything, even if there were fewer distracting devices dispersed throughout the room. And in the high condition, there was not much else added but a couple of pages of icons. Hence, most participants found using the menu to be rather easy, even if they did many mistakes (Table 9). Focusing in on the subscales, it becomes clear what differences are involved in influencing the total workload measure. In the low icon density group, the menu was simply less demanding both physically and mentally for the participants (Table 4), which might also reflect in the median duration for completing the task (Table 7), although not significantly (due to a single outlier who took more than 10 times as long to complete the task with the menu than the others, resulting from the real world not changing as input is made in with the HoloLens and hence not understanding what needed to be done). For the high icon density group, mental demand was again significantly lower when doing the task with the menu, but physical demand was not, maybe because the participants had to browse through the additional pages back and forth to make sure they had done the task correctly. But effort and frustration stand out as big factors when comparing the WIM model with the menu model (Table 5). And this becomes more clear when looking at the number of mistakes made in the WIM model (Table 8), as it was higher there. There is probably some correlation between the number of mistakes and how frustrating or effortful the interaction with a model feels, although no such tests have been made. We did predict that it would be frustrating to find the right lamps to shut off in the high condition with the menu model, but we were wrong, as the participants either started turning off all the lamps without bothering with the consequences, or they looked for the right lamps (as the lamps were named) and shut them off immediately. The drawbacks of the menu model, e.g. being unclear with the connection between an icon in the menu and the actual device in the world, did not seem to affect workload then, at least when not affected by penalties from shutting off the wrong devices. Of course, the experiment could have been adjusted so that the participants would be disincentivized to shut off the wrong devices, which might have made the menu model more difficult, but the other models would also become more difficult in such a case so it is not clear that it would have mattered for the differences between the models. As a summary for the workload measure, great differences between the models were only found for the high icon density group due to much higher mean score for the WIM model, suggesting that the WIM model is not optimal for environments with many devices when they are presented in the way our model has been designed. Of course, there are benefits with the WIM model, such that getting a gist of the room layout, and knowledge of where devices are located, but for it to work effectively, there probably needs to be some filtering involved. Taking a short look at how long it took to complete the tasks in different conditions, there were significant changes between the icon density condition only for the WIM model which was unsurprising, and within the same icon density condition there was a significant difference for the high group, also due to the WIM model, so one can also here give the suggestion that for the WIM to be a functioning model, one probably wants some type of visual filtering when many devices are available, for the interaction not to take to long. The correlation between the duration of task completion and the workload measure was high (r s = 0.41), also supporting this view. For the results of the post-test survey, we found significant differences between the low-high group for question two and three with the WIM model. The second question asked whether the irrelevant devices were distracting in the model, and as one can see (Fig. 22) most of the participants in the high group thought that the irrelevant icons were distracting. Their data was also more varied for the floating icon and menu model, but not enough to be significant, indicating that more devices can be distracting in the other models as well, but not as much as with the WIM model. The third question asked whether the task was difficult to complete, and the results match what the participants answered in the NASA-TLX test, that more irrelevant devices increase workload and difficulty. For the first question, which asked whether it was difficult to find the correct holograms to interact with, there was no significant difference between the group, but slight indications that it might have been more difficult for some participants in the WIM and menu model. Same goes for question four, which asked if they become less aware of the real world, where most answered the same between the groups, but with a slight indication that with more holograms required more focus on the models, and less on the world. For the last question, which asked whether it was easy to understand which device was meant for any given icon, there was no significant difference between the groups, but an indication that the menu model made it more difficult for some as the responses were more varied, which could be explained by the fact that the menu does not explain which device is which with its icons, only providing names. Being tasked with shutting off the lamps by the whiteboard might then be difficult to complete if you do not know how they have been named in the menu. To investigate whether there was a learning effect after doing the same task three times, we compared the results for duration and workload measure according to the order done by the participants. As the results show (Table 9), the workload score did not go down significantly as the participants repeated the task, which is a good indication that any learning effect has not influenced the data from the NASA-TLX test, even if there 14
107 is a small trend down. Duration did go down though, as we predicted. We tried to hamper this learning effect by changing the colors of the icons between the models, but as the task was the same they would still get faster predictably. Changing the task for each model would make it more difficult to compare the results we believed, which is why we gave them the same task. In a larger experiment, it would be possible to produce different but similar tasks, where one could randomize which task and which model one would perform, but that would include developing different models for each condition, which we did not have time for in this project. Going over to the qualitative data, we found that almost all users were positive to AR technology and the possible future for this type of technique. Some had troubles with the HoloLens but were positive to use AR with smaller glasses and more gestures. Most liked the idea of controlling objects from a distance. Many said that the icons were clear and easy to understand. With the menu model, many said they had trouble connecting the icon to the device. What is interesting is that many said they did not read the text or name we gave each icon to help the user to identify which lamp to turn off. Most users did not think much about which lamp to turn off, but simply tried turning off all or some lamps off. The same pattern where shown with the blinder icons. Many thought the icons were unclear but simply tried clicking on them to determine which was the correct way. With the blinders, most users said that after the first model it was easier to determine what was on and off. Some said the WIM model was hard because of the large number of icons, which made the model feel crowded. Many said they learned the mapping from the WIM model which made it easier the next time. Most agreed on that the third time the test was easier to do, which clearly shows that novice users of AR systems learn quickly about how to use the the system and how to control holograms, even after using it only a couple of times. After a while when using the HoloLens, it becomes more natural to interact with different virtual things. The problems with the WIM model will also resolve themselves when more gesture and more exact interaction available in the future. The icons size was overall considered good. The possibility to individually set the icon size was possible in the WIM model but for some it was also desired in the floating icon model. This together with the possibility to name each icon is features that hopefully will be available in the future when AR is more individually adapted after each user. Since the model the users preferred varied a lot, and many could not even decide, this indicates that the best model is both personal, location and situation dependent. A mix of how to interact with icons would be the best solution. Finally, the limitations with our tests are a few, the primary being the fact that we did not have actual smart devices to connect with the HoloLens. An experiment which includes that in the future would be great. This leads into the other problem, which is that the participants did not receive an indication when he or she made a mistake. This resulted in that many tried clicking on several icons to see what happened, unnecessarily. This lead to a lot of errors, which we counted. But making it impossible to interact with irrelevant holograms would be an unnatural constraint. 8 General discussion This project has attempted to develop a system that could eventually manage the looming problem of the invasion of the IoT. By developing different interaction-models, and comparing them, we have tried to find the key attributes of what a functioning system should have. We think we have found some of them. The most important one seems to be the need for an effective and intelligent information-filter, to make sure that just the right set of information at the right time is readily represented for the user, reducing perceptual and cognitive load, attention distractors, and the time it takes to solve a given problem. In addition to a future context-aware filter, an artificial intelligent agent could learn what a user typically wants in the situation he or she is in (how a system can appropriately analyze situations is a problem for artificial intelligence researchers to solve), relieving the workload for the user. Our tests also showed that the three models were best suited for different applications and situations, and each came with their own set of advantages and disadvantages. The floating icon model requires the user to move around in order for it to be effective. However, it gives the icons a very clear relationship to the device they control, making it easy to figure out what does what. The same relationship can be found in the WIM. However, the WIM can easily become overwhelming to the user. Our test was conducted with a WIM consisting of only one room, which still overwhelmed users in the group using high icon density. One could only imagine how confusing a WIM representing an entire office building could be. An improvement for the WIM model is to group the icons, i.e. all lamps in on row connect to one icon, much like a normal lamp button controls several lamps in an office environment, when the icon density is high. This would be a way to make the WIM model a lot less crowded, which would improve the user experience. In addition to the filters, a grouping/macro-system could perhaps be used in the WIM, allowing for less detailed control over devices, but making it less likely to overwhelm the user. The test showed that the menu model was effective when the user knew the environment and quickly wanted to control devices. The model, however, lacks a good connection to the real device which makes the orientation difficult. Another problem is the naming of devices. For example, how do one name all lamps, and easily know which icon belongs to which lamp? This implies that the menu model only works in an environment that the user is comfortable in and know well, such as a home environment. In the future, when AR technology will be more developed, it is likely that AR devices will be able to scan the room, not requiring the model of the room to be built manually, and on its own place out icons where the actual devices are located. It would also hopefully identify where regular objects are located, such as tables and chairs, as the regular objects are important to get an overview of the room, and for the users to be able to identify themselves in the model. With more gestures implemented in the systen, it will be easier to control different objects and manipulate them as the user desires. During our tests, some wanted more gestures like the zoom function one uses on touchpads, while some wanted eye tracking so that they would not have to turn their head more than usual. Hopefully, with the next generation of AR glasses, the 15
108 FOV will also be improved. This is a big problem with the HoloLens today, as it makes the user feel limited in their interactions. The small FOV also leads to extra movement of the head which feels abnormal for most users. As for further work, there is a lot still to be done. We only studied how to discover different devices, and there is a lot left to examine, like how to control different devices using AR technology. Since this is only a prototype, our icons do not actually control the real devices. The feedback would be perceived by the user as much better if they actually controlled the real device. This was very apparent in the case of the blinders, as everyone had their own mental image of what on/off meant. There are ways to achieve this already, but a lack of time stopped us from implementing it. In this area, there is a lot of further work to be done. The conclusion from our work is that users do want to control devices in their home or at the office using AR technology if it is functioning and provides with a pleasant user experience, and they would even use the HoloLens in some cases already today. This opens for a lot of future work to be done in this area. With more advanced AR-technology, it can be used to improve everyday life. 9 Conclusion With our society becoming more and more connected by the hour, there is a strong need for a simple way to discover and interact with nearby devices. With some improvement to the current AR-technology, we strongly believe it to be the future of interaction, both with devices and with other people as well. 10 References Bell, B., Hllerer, T., & Feiner, S. (2002). An annotated situation-awareness aid for augmented reality. In Proceedings of the 15th annual ACM symposium on User interface software and technology, ACM, Chen, Y. H., Zhang, B., Tuna, C., Li, Y., Lee, E. A., & Hartmann, B. (2013). A context menu for the real world: Controlling physical appliances through head-worn infrared targeting, UCB/EECS Edwards, W. K., & Grinter, R. E. (2001). At home with ubiquitous computing: Seven challenges. In International Conference on Ubiquitous Computing, Springer Berlin Heidelberg. Evans, D. (2011). The internet of things: How the next evolution of the internet is changing everything. CISCO white paper, 1, Gelles, D. & de la Merced, M., J. (October 21, 2014). Google Invests Heavily in Magic Leap s Effort to Blend Illusion and Reality. New York Times. Retrieved from php=true& type=blogs& r=1 Hermodsson, K. (June 2010). Beyond the keyhole. Positional paper for the W3C Workshop: Augmented Reality on the Web (PDF). W3. Retrieved from the keyhole slides.pdf Jim (2016). OBS Studio (Online). Retrieved from Kreylos, O. (August 2015). HoloLens and Field of View in Augmented Reality (PDF). Retrieved from Ledo, D., Greenberg, S., Marquardt, N., & Boring, S. (2015, August). Proxemic-Aware Controls: Designing Remote Controls for Ubiquitous Computing Ecologies. In Proceedings of the 17th International Conference on Human- Computer Interaction with Mobile Devices and Services, Microsoft. (2016). Microsoft Hololens webpage. Retrieved from Microsoft (2016). Microsoft Visual Studio 2015 (Online). Retrieved from Norman, D. A. (2002). The design of everyday things: Revised and expanded edition, Basic books, New York. Rogers, Y., Sharp, H., & Preece, J. (2011). Interaction design: beyond human-computer interaction, Wiley, cop., Chichester. Rubin, J. & Chisnell, D. (2008). Handbook of Usability Testing (PDF). Retrieved from 438a-b81492db3dde0eb6.pdf Samuelsson, D. (2016). UbiCompass - IoT Interaction with Wearables (PDF). Retrieved from File&recordOId= &fileOId= Sharek, D. (2009). NASA-TLX Online Tool (Version 0.06) [Internet Application]. Research Triangle, NC. Retrieved from Thompson, D. TruthLabs (2016). OBS Hololens Profile (Online). Retrieved from Hololens-Profile Unity Technologies (2016). Unity Hololens Technical Preview 5.4.0f3 (Online). Retrieved from 16
109 Designing mental states in a humanoid robot Hannes Sandberg, Marcus Liljenberg, Max Eriksson, & Markus Lindberg dic12hsa-, dic13mli-, dic12mer-, sta14mli@student.lu.se The interaction between human and robot is an area which still needs further development before natural interaction can occur. To further knowledge in this area, the following project sought to explore to what degree facial features, such as eyes and mouth, could be used to convey mental states. The project was connected to the Ikaros project, an collaboration between several research groups in robotics, and used a humanoid robot called Epi. By conducting multiple experiments, several key findings regarding robot design was observed and tested. In the final part of the experiment, five mental states had been thoroughly developed. Two out of these states were judged as properly designed, with near perfect scores in terms of identification and distinctness, and as such should be applicable in other projects employing human-robot interaction. The other three states still require further testing and implementation. 1 Introduction The design of robots with human appearance is a field which has seen rapid development in recent times. With realistic examples such as Jia Jia (PatrynWorldLatestNews, 2016), there seems to be few steps left before robots can be made visually indistinguishable from humans. The question that remains is if the robots in question can behave in a way which humans attribute mental states to. The collaboration between human and robot, human-robot interaction (HRI), is one of the most central fields in robotics. By creating hardware and software which imitates humans, it is the hope of several scientist that answers can be found regarding how human interaction takes place (Broz, Lehmann, Nehaniv, & Dautenhahn, 2012). Another goal is to create robots which are as easy to interact with as possible (Gielniak, Liu, & Thomaz, 2013). The following paper will describe a project which sought to explore how the design of a humanoid robot s facial features can affect an interacting human s ability to attribute and discern internal mental states. It built on the hypothesis that specific facial features are able to significantly signal mental states. To test this hypothesis, several experiments were carried out, with each experiment building on findings from the previous experiments. General information regarding interactive robots, human communication, and the Ikaros system will be presented, followed by descriptions of implementations in the ikaros platform, the experiments that were carried out, which results were gathered, and what these results can tell us. Suggestions for future developments are also included. 2 Background information To understand why the study to be presented was carried out and what information formed its design, the following section will list some background information. The first part will focus on key findings regarding what features of the robot s appearance and behavior is important for natural HRI. Following this, data on facial features in human-human interaction will be mentioned, illustrating the importance of eyes and mouth when communicating. Then, in the last part of this section, the creation and use of modules in the Ikaros system is described. 2.1 Robot as an interactive agent Several key findings have been made regarding what features of a robot should be present to facilitate natural interaction with humans. A frequently appearing theory claims that robots with human appearance are easier to interact with in social settings (Gielniak et al., 2013). Features such as eyes and mouth are able to convey much information, and so these can be used by humans to infer different mental states. More specific parts of these features can also significantly alter human perception, as seen in the study by Foerster, Bailly, & Elisei (2015) where robots with eyelids were judged as more lifelike. The features do not, however, have to follow human design blindly. Research has displayed that robots which use big round irides in their eye-design are judged as more friendly by humans (Onuki et al., 2013). Humans have also been the main model when designing behavior in HRI robots, with the general consensus being that collaboration within HRI is improved if the robot imitate human-like movements (Gielniak et al., 2013).This is not an easy task though, as the robot has to consider social rules that have been built throughout thousands years of evolution in human societies. Therefore, the robot must have the ability to analyze human behaviors and, given that information, generate relevant behaviors. Due to the robot s limited sensory-motor and cognitive resources, this behavior does not always have a satisfying result (Foerster, Bailly, & Elisei, 2015). Furthermore, even behavior which the robots resources are appropriate for can cause difficulties when carrying out experiments. As the agreed upon appropriate behavior varies between countries, experiments carried out in a certain way might not provide the same results if carried at different locations (Broz et al., 2012). The previously mentioned phenomena can be derived from cultural behavior, which is a wide concept. In the area of computing, culture can be defined as making the user experience an interaction that is closely attributed to the fundamental aspects of the user s culture (Samani et al., 2013). This, the cultural aspect of robotics, can be argued to be one of the most central issues in designing robots. Robots that do not follow cultural norms will likely be difficult to integrate in a human society. It has been argued, though, that the integration of robots that are designed through cultural context will also in turn affect the culture in which they appear, eventually leading to a codeveloped human-machine culture (Samani et al., 2013). To demonstrate the impact of culture, one can imagine the phenomenon Throbber (Fig. 1), which has been used to display that an action is carried out in computers. Using this mov-


 to iris ratio as the human.")
110 ing image to display loading can be an efficient tool in communication, but only when the person interacting has the background knowledge which associates image to meaning. Figure 1 Throbber, a common symbol to display loading in computers (Stuart, 2015). 2.2 Facial features as communicative tools As the previous section displayed, human features are frequently used when designing robots. To do this appropriately, it is necessary to first distinguish which features are especially important when humans communicate with humans. The human race are unique in many ways, and the eyes are no exception(fig. 2). No other animal, including apes and primates, have such a large and visible sclera (white space in the eye) to iris ratio as the human. This unique structure of the eye facilitates the ability to express feelings or enhance already shown feelings. Consequently, the eyes have an important function to enrich the communication between humans. Another aspect is that the spherical shape of the eye allows one to infer the position of the iris not only when the facing a person head-on, but also when seeing someone from the side. Therefore, is it possible for a human to read another human s gaze direction from many different positions (Delaunay, de Greeff, & Belpaeme, 2010). or listening, periodic gaze aversion may serve to modulate the overall level of intimacy in the current conversation. Floor management function, by looking away while pausing during a speech, the speaker indicates that the conversational floor is being held and that the speaker not should be interrupted. These three primary functions are a big challenge but also essential for a human-like robot to achieve conversational goals. There is an optimal time for how long we spend gazing into each other s eyes, and a study prove that a social robot found to be more intentional, thoughtful, and creative when it used gaze aversion. There is also a correlation indicating that the more lifelike robot is, the more important gaze aversion may be (Andrist et al., 2014). To blink is an essential social function for a human-like robot to be accepted in HRI. The normal blink rate for a human is 17 blinks/min, and can increase to 26 during a conversation (Bentivoglio et al., 1997). This subconscious function is seen as a normal behavior for humans. Foerster and colleagues (2015) built a robot with eyelids and tested it in relation to the same robot but without eyelids, to show that a robot with eyelids that blinks are more socially accepted by humans than a robot without eyelids that cannot blink. While sclera och iris provide a lot of important information for communication, more recent works have focused on what influence pupillary dilation has on judging the internal states of others. The pupils are generally very small, with a diameter of about 3 millimeters in a lit room, but several tasks and situations can significantly alter the size to as tiny as 1,5 millimeters or as big as 9 millimeters (Sirois & Brisson, 2014). Arousal has shown a strong correlation with pupillary growth. In one study mothers displayed a clear growth in pupil size when shown pictures of babies. The same study also showed growth in pupil size for people shown pictures of naked individuals of the preferred sexual gender (Hess & Polt, 1960). Another facial feature which has large influence on the display of emotions is the mouth (Adams Jr & Kleck, 2005). Russel (1997) supplied an overview of how different facial features relate to emotions, and created a chart of arousal and pleasure to distinguish them (Fig. 3). It clearly displayed how both the mouth and eyes change between emotional states. Figure 2 Left, the appearance of the human eyes. Right, a comparison between human and chimpanzee eyes (Foerster et al., 2015). Gaze is an significant nonverbal behavior for human-tohuman interaction. Eye gaze can tell us when someone is speaking to us and can also convey information about the environment. Research in HRI has investigated the impact of gaze behavior in various situations, including presentation of information, open-ended conversation, and storytelling (Andrist, Tan, Gleicher, & Mutlu, 2014). One important aspect of gaze in the area of HRI is gaze aversion. Gaze aversion may be defined as the intentional redirection of gaze away from the face of an interlocutor. It is used in conversations to achieve three elementary functions: cognitive, intimacy modulation, and floor management. Cognitive function, as a speaker you spend much more time averting your gaze when compared to a listener. This results in better planning and delivering of their utterances as well as limiting external distraction. Intimacy modulations function, while speaking Figure 3 Illustration of the arousal/pleasure chart developed by Russel (1997) (Breazeal, 2003). 2


. could be implemented in the employed robot.")
111 2.3 Epi and the Ikaros system The robot most commonly employed in interaction studies at Lunds University Robot Group is Epi (Fig.5). As the picture displays, Epi has LED lamps for sclera, a camera for pupils, and several motors for head and eye movement. To control these different parts of Epi, a platform called Ikaros has been used. The purpose of the Ikaros project, started 2001, was to develop an open infrastructure for system level modeling of the brain where researchers would have an easily accessible platform for neuromodeling and robotics. In the environment it is possible to implement modules which also can be connected to each other. Every module can have one or more inputs and outputs. Consequently, module A can receive an input from an arbitrary module and with this data create an output. A module can be written in C or C++, and several modules are connected with XML-files. The system operates in ticks, where the modules at each tick read the input values, do their operations, and set the output values. Maximum number of ticks depends on the system which is running the code (Balkenius, Morén, Johansson, & Johnsson, 2010). could be implemented in the employed robot. Initial work focused on building understanding regarding how the Ikarossystem was to be used and how it works, while at the same time identifying which mental states were feasible to implement in the robot. Following this, a pilot study was carried out, to assess if the mental states implemented in the robot were somewhat useful for communication. 3.1 Implementation of the Ikaros System All modules used and how they are connected can be seen in Fig.4. Yellow modules are hardware, green ones are already existing modules in the Ikaros system (Ikaros, 2015), and blue ones are implemented for this project. InputVideo: Module for catching video input. MarkerTracker: Analyses a picture (frame in video) input and finds markers. DecisionModule: Depending on the marker identification from MarkerTracker it chose which program for mental state that will be executed. Output to the different modules for eyes and neck. EyeModule: For different mental states EyeModule decide the intensity and color for the different LED lamps. PupilModule: For the different mental states PupilModule operate the servo of he pupil through MotionGuard and Dynamixel to make the pupil dilate or constrict. HeadMovementMOdule: For the different mental states, HeadMovementModule operate the servos through MotionGuard for the neck, as well as the servos adjusting the eyes horizontal. Figure 5 Epi, a robot used by the robot group at Lunds University. Neutral state to the left and mental state of sad to the right. FadeCandy: The module that operate the LED lamps by changing the color and intensity of it. MotionGuard: Guards Epi from exaggerated movement by having maximum and minimum values for the movements. Dynamixel: Communicates with the servos. 3.2 Designing Mental States Figure 6 Mental state of happy to the left and mental state of angry to the right. 3 Pilot Experiment Relying on previously gathered information, the project at hand sought to explore how behavior displaying internal states In parallel to the acquisition of knowledge regarding how the Ikaros-system works, data was gathered on how mental states are displayed in humans. Information was also collected regarding how this has been used in robot research. This approach, combining the current knowledge of machine implementation and background knowledge, resulted in an dynamic development of several mental states. A neutral state was identified, which all other mental states were related to throughout development. The mental states developed were thinking, angry, happy, confused, indifferent and sad. A summary of the mental states used in the pilot experiment can be seen in Table 1. Also developed was a behavior corresponding to blinking, and a focus component for identifying objects Neutral The neutral state was designed to include a minimal amount of communicative features. The eyes used white for color, as this was hypothesized to be the most neutral color. Intensity 3

112 Figure 4 Pilot experiment: used camera as input and did not use the Mouth module. Follow-up and Final experiment: used the terminal as input and all four modules that are tied with Decision module. Table 1 Table of mental states and corresponding implementations in Epi. Mental state Color Intensity Mouth Pupil Neck motor Eye motor Blink Neutral White 0.5 None Unchanged None None Used Thinking Blue Used Unchanged Up Normal None None Angry Red 0.5 None Constrict None None Used Happy Green 0.5 None Dilate None None Used Confused (1) Blue Used Unchanged Up Normal None None Confused (2) Red 0.5 None Unchanged Left Right Normal None None Indifferent White 0.25 None Unchanged Right Normal Left Right Normal Used Sad Blue 0.5 None Unchanged Right & Down Both Eyes Middle Used was kept constant with a value of 0,5, on a scale where 0 corresponds to no light and 1 corresponds to maximum light. No light or color was used in the mouth. Pupils were kept at an initial state, with no change in size. No movement was included in either neck or eyes. Blinking was included, as the neutral state should still convey human behavior. How Epi looks in the mental state of neutral can be seen in Fig Thinking The idea behind the first mental state developed, thinking, occurred while the group still only had access to a circle of LED lamps, the same type of lamps used in the eyes of Epi. As it soon became apparent that thinking is a difficult mental state to capture in terms of human facial features, it was decided that a computer metaphor would be able to convey the appropriate meaning while making the process of implementation significantly easier. The metaphor decided on was that of loading with Throbber (Fig. 1). Like previously mentioned, Throbber has been accepted as a standard visual effect of displaying loading in computers. The act of loading for computers has, at least in western culture, been equated to thinking in the computer. Since Epi is a robot, a machine closely connected to computers, it was decided that implementation of Throbber in the eyes of Epi should be able to convey the mental state of thinking. Once Throbber had been implemented in the eye movements, by having lamps with different intensity being lit in a serial manner, it was decided that the color blue should be used to convey a calm thinking process. Lamps in the mouth also used the color blue, and were also lit in a serial manner. In later stages of development, it was decided that pupils should be held constant in size, and blinking should not be used. This was decided on because the mapping used related to computers rather than humans, something which will be further explained in the discussion. The final addition to this mental state was the inclusion of motor movement. An upwards movement of the entire head was implemented, as it was judged to enhance the experience Angry Once access of the robot had been acquired, development of the second mental state ensued. This state, angry, was agreed to be easier to model in terms of human facial features. Because of this, the use of pupillary changes was included. Following a generally agreed on fact in research, anger was displayed by constricting the pupils. The state was, however, not only modeled based on human features. When coding color, it was decided that red would convey anger more effectively than white. Intensity was a feature judged as irrelevant, so it was kept at the baseline value of 0,5. Color in the mouth was not included, as these were difficult to use in any manner which resembled human appearance. Movement was not used with for either neck or eyes, as other features were judged to provide sufficient information. Blinking was included. The mental state of angry in Epi can be seen in Fig Happy The third mental state, happy, was developed shortly after angry, and followed the same principles as the design of angry. Pupils were programmed to dilate instead of constrict, which was connected to the chart displayed in section 2.2. The color used was green, on the basis that it was opposite of red in the sense of traffic light coding. Mouth color was excluded again, for the same reason mentioned with angry. No movement was used with neck or eyes, also connected to the reasoning in angry. Blinking was included. How Epi looks during the mental 4

113 state of happy can be seen in Fig Confused During discussions with the projects supervisors, it was mentioned that the display of a confused mental state would be useful for further research. After internal discussions regarding this, the design agreed on was one which combined the previously designed thinking state with some additional behavior. The initial thinking behavior was included to display that the error occurred as a result of problems identified when thinking, and is captured in Table 1 as confused (1). The second part of the confused state, confused (2) in Table 1, was used to display that an error had occurred. This part included a change in color and movement. Colors were changed to red, relying on the mapping that red means something has gone wrong. In combination with this, movement of the neck from left to right in a head-shaking manner were used to further display that a problem had taken place. Blinking and pupillary change was not included in this mental state, for the same reason that it was not included in thinking Indifferent Indifferent was a mental state created in later stages of design, and as such was connected to the growing awareness of which aspects of the robot were possible to effect. By changing the intensity to half of the normal value, it was hypothesized that less interest could be signaled. This would then be further signaled by performing movements of the neck and eyes in a left-right manner, indicating that the robot was looking for something more interesting in the room. The illusion of a mental state in the robot was further supported by the inclusion of blinking. Pupillary change was not included, as change in pupil size is used to convey focus and interest. Since the experiment includes showing cubes, a small focusing confirmation behavior was implemented in Epi. When showing a cube that Epi can see and read, Epi s pupils dilate to show confirmation, and then return back to neutral state. 3.3 Designing the pilot experiment The experiment involves Epi and a human test subject sitting face to face of each other. Before the test, the test subject was given an informed consent form and a short description of Epi and the purpose of the experiment. During the test, the test subject was given six different barcode cubes, that all represented one of the six mental states. An example of a barcode cube used in the experiment can be seen in Fig. 7. By showing one cube at the time for Epi, Epi expressed a mental state. The test subject should then map Epi s behavior with one of the given mental states. The name of the six given mental states were written on a paper placed on the table next to Epi, with a circle drawn beneath each mental state. The test subject placed the cube on the circle mapped to the mental state they thought were the correct one. It was possible for the test subject to show the cubes in any order desirable, to show each cube multiple times, and to change their answers after one had been made Sad The final mental state, sad, was modeled through a combination of awareness about robot capabilities and lucky coincidences. While members of the group tried moving different parts of the robot around, it was observed that directing both eyes so they focused inwards made the robot appear sad. Knowing that this behavior was possible to implement in Ikaros, it was decided that sad should be included as a mental state. Blue was judged as the most appropriate color for the eyes, with average intensity. A movement of the neck, directed right and down, was used to display remorse. Blinking was included for the same reason as mentioned in indifferent. The mental state of sad can be seen in Fig Confirmation of cube and blinking To achieve a more human-like appearance in Epi, an eye blinking behavior was implemented. This was programmed by letting the top and bottom of the LED lamp (representing the eye) gradually switch off until they reach the middle at the same time. The whole LED lamp is completely turned off in 50 milliseconds, and then turned on again. The whole blinking procedure takes 200 milliseconds. A human blinks 17 times per minute during normal circumstances, and Epi follows this pattern. To make this behavior appear more natural, a randomization element was added so that the behavior is performed within the range of ±10%. Figure 7 A cube with barcode used in the pilot experiment to interact with Epi. 3.4 Results The result from the tests can be seen in Fig. 8. As seen, none of the five test participants were able to interpret confused or indifferent. All five participants guessed correct with sad. Because of the test s design, with the test person mapping a mental state of Epi with a pool of given mental states, it is of interest to know what mental state the test person thought was shown by Epi. This is presented in Table 2. This table shows that 80 % of the test persons thought that Epi was confused, when the robot actually was indifferent. 3.5 Discussion As can be seen in the results, the mental state that was easiest to identify was sad. A possible explanation for this finding is that the act of moving both eyes together and looking down adds the illusion of other facial features in the robot. The lack of eyebrows has been hypothesized to significantly diminish the 5

114 Table 2 Results from the pilot experiment. The numbers represents how many of the test persons associated the programmed mental states of Epi to the different mental states. Epi s mental state Thinking Angry Happy Confused Indifferent Sad Interpreted mental state Thinking Angry 3 2 Happy 3 2 Confused 1 4 Indifferent 2 3 Sad 5 Figure 8 Results from the pilot experiment. Each bar represents a correct mapping between designed mental state and interpreted mental state. possibility of creating behaviors comparable to humans in Epi. By performing this specific pattern of behaviors, Epi appears to both have and use eyebrows. Another aspect of this finding relates to the appearance of robots in movies. The current behavior in sad closely resembles that of the robot Wall-E, from the movie with that same name. As this is a well known robot in our western society, it is likely that people can map visual memory to the current situation and as such infer the sad state in Epi. Overall, most people had problems distinguishing the different mental states it the pilot test. Four out of five participants identified indifferent as confused, making these two mental states the hardest to distinguish. One reason why these were more difficult to identify, as compared to mental states like sad and angry, could be that they are not as basic in appearance. We believe that the behaviors used to signal these states significantly differ between individuals, making the states harder to be visualized with the limited set of facial features available to Epi. Another thing which might make these states difficult to separate is the inclusion of a searching behavior in indifferent. This was included to signal that Epi wanted to find something more interesting to look at, but it could be interpreted as Epi searching for a solution to that which caused it confusion. With movements appearing to be a central to interpret mental states, something which will be discussed later, the inclusion of a difficult to interpret movement like this might make the identification process significantly more difficult. Two other state which people often confused with each other was thinking and happy. The test subjects explained that this was because they associated Epi looking up with being happy. Apart from that, many mistook confused for angry. According to the study participants, this was because of the aggressive head movements and blinking red eyes. People also mistook indifferent for thinking, something which likely is connected to the previous discussion that some mental states are very individualized and therefore difficult to distinguish from each other. The fact that options were provided appears to have forced the test people to categorize Epi s display of states according to what options they had left, instead of intuitively guessing what kind of state Epi displayed. Having these options also created large differences in how people attempted to solve the task. While some people only looked at each behavior once before deciding on a corresponding mental state, other individuals tried the cubes several times and frequently changed their decisions. This difference became especially clear in hard to identify states, such as indifferent and confused. The blinking implemented in Epi gave quite a big effect in making the robot feel more lifelike. To create a natural blinking behavior, we found and utilized a visual illusion. In our implementation, Epi is shutting it s eyes gradually by extinguishing parts of the lamps, but when Epi opens it s eyes all lamps are lit instantaneously. We found this behavior much more lifelike than to let Epi open it s eyes gradually, as this made Epi look very mechanical. Soon after this behavior was implemented it became a natural part of the robot, and as such seldom drew attention. It was only when the behavior was removed from Epi that the features importance became apparent, causing Epi to immediately appear less lifelike. Blinking worked quite well with all mental states which used human behavior as a basis for modeling. Limitations of the behavior were first observed when an attempt was made to implement blinking in the mental state of thinking. Because this behavior primarily used a mapping between Epi and a machine, the inclusion of a human behavior only made the mapping less reliable. Based on these observations, it was agreed that blinking is useful when attempting to improve the illusion of Epi as an agent with mental states comparable to humans, but not so when creating behavior based on mapping with other objects. Our initial study helped us form the hypothesis that people associate Epi s movement with a mental state, more so than the color of Epi s eyes or the size of its pupils. This could be seen in how most of the test subject expressed that Epi, while in the mental state of thinking, was showing a feeling of happiness. Several times participants expressed that they connected happy with Epi looking up towards the person. Epi s behavior connected to happy used a clear color coding and employed pupillary dilation, but this was still insufficient to clearly dis- 6


115 play the mental state. Despite this, it still appeared that LED lamps and pupil can be used to greatly increase the effect of a state shown by Epi. It was agreed that follow-up experiments could use this information and improve upon it by adding distinct and thought out movements, and by doing so improve the illusion of Epi having mental states. 4 Follow-up experiments Once the pilot experiment had been carried out, it was clear that this type of testing provides several idea for how the robots design could be improved. To further develop the usability of EPI for displaying mental states, two additional tests of the same type as the initial experiment were carried out. Both tests had five participants, and each experiment involved changes in how the mental states were displayed. This iterative working process is illustrated in Fig. 9. After a test, the results were analyzed. This was followed by an internal discussion where adjustments and perspectives could be discussed. A new implementation with the adjustments were made and then tested again. Figure 10 The implementation of a shaking head movement in the mental state angry. Figure 11 Two different designs of smiling, through discussion the left one was superior and therefore used in later experiments. Figure 9 The iterative working process used during the follow-up experiments. 4.1 Changes Among the mental states developed through our initial test, indifferent was the most difficult to find valid ideas for in terms of improvement. In its initial state it not only received very few correct guesses, but also made the other emotions less reliable. Through discussions it was decided that this mental state should not be included in further experimental designs, as no idea for improvement became apparent. The first stage in the design of mental states focused on adding movements to their display. Results from the initial experiment provided evidence for the claim that movements can create more identifiable mental states. Because of this it was decided that all mental states should include some degree of movement. Thinking was already judged as proper in terms of its movement, as was sad. Angry was improved by adding a forceful shake of the head. This act seemed to be proper because several people judged confused as angry in the initial experiment. For the same reason, the act of moving the head upwards was included in happy, which had been a part of the movement in thinking. As for confused, it first received a searching movement around the room, looking at different directions but not forward, but at later stages this was changed to a movement of the eyes back and forward. An example of changes in movement can be seen in fig. 10. The second stage of development focused on the use of mouth to display emotions. As previously mentioned, the mouth was very simple in its overall design, with only two vertical and six horizontal lines. Because of this, all attempts at creating a fitting pattern of lighting included several trials before anything was decided on, and even after this the results often appeared lacking. Fig. 11 displays two design choices for the mental state happy. When deciding on a design for thinking, it was judged as a useful endeavor to retain the computermetaphor. Another classical symbol for loading in computer is a loading bar, and this appeared to be reasonably realistic to implement in the mouth of EPI. As for the design of angry, making the mouth appear to be a thin line seemed fitting. This was achieved by only using four of the six available horizontal lines, and having a lower intensity for the outer lines. Happy in turn involved a very obvious design, namely a smile. This was very difficult to achieve with the current mouth, but finally a design was agreed on. Similar to this, sad used a frown in terms of mouth appearance, which was an inverted variation of the smile. Finally, confused involved a random blinking pattern of the mouth. In terms of changes to other features of the robot, only two mental states were judged to need a change of color. The first 7

116 new design of confused used the same color coding of the eyes, with a blue loading movement followed by red. This appeared lacking, and as such a second design was developed. This design built on the same change used in the mouth, with random blinking of different colors in different parts of the eyes. For the mental state happy, an attempt to improve the state was made by using the color yellow. All changes to the robots design can be seen in table 3. Apart from changes in the robots behavior and appearance, some changes in experimental design were also included. One of the larger developments was the inclusion of a scale, where the participants rated distinctness of the displayed behavior. Initially, this scale went from the numbers 1 to 10, but was later changed to 1 to 5. The change was judged as necessary because a 1 to 10 scale appeared to create to large variance as a result of personal methods for assigning values. The reason this scale was developed was to gain another tool for judging the utility of our new implementations. Another change involved the exclusion of a cube. As the act of showing the cube before each mental state could be shown was judged to be both unnecessary and complicated, the cube was completely excluded from the final experiment. 4.2 Procedure The follow-up experiments involved a procedure which was somewhat similar to the one used in the pilot study. Epi was placed on a table, and the participant was asked to sit in a chair facing Epi. Between Epi and the participant was a paper with different mental states written on it, and five pieces of paper with the number one to five written on them. The participant was asked to display a number, and then watch Epi as a behavioral pattern was presented. This pattern was started by an experimenter sitting at a computer behind Epi, who had to observe what number was shown by the participant. Following this, the participant was asked to place the piece of paper at the written mental state that they felt corresponded best with EPI s behavioral pattern. Participants were allowed to display the same number several time before making a decision, and could change their choices during the testing. Once all five pieces of papers had been placed on the paper with mental states, the second part of the experiment was carried out. Here each mental state was displayed again, and participants were asked to judge to what degree they felt the behavior managed to capture the mental state they had attributed to it. This judgment was made on a 1 to 5 scale. 4.3 Results As seen in Fig. 12, three of the five mental states were easier to identify when a designed mouth was included. All participants were able to identify both angry and sad. Less than half the participants could identify happy and confused. As for the participants judgment of distinctness, table 4 shows that angry and sad were judged with scores above 2.5, and both were also improved as a result of including a mouth. Happy and confused on the other side both had low ratings that were decreased in the second follow-up experiment. Thinking had a generally low score that did not display any large change between the two tests. Figure 12 Results from the follow-up experiments. Each bar represents a correct mapping between designed mental state and interpreted mental state. Table 4 The mean value of the participants judgment regarding distinctness of the five mental states represented with a numeric rating scale, where 5 was very distinct and 1 was indistinct. Results from test 1 were originally on a 1 to 10 scale, but here they have been converted to a 1-5 scale by dividing values by two. 4.4 Discussion Mental state Test 1 Test 2 Thinking Angry 3 4 Happy Confused Sad Overall, movements appeared to improve participants ability to identify mental states. Comparisons with the pilot experiment shows that angry, happy, and confused were all easier to identify, while thinking was judged correctly by an equal number. Sad in turn received less correct identifications when compared to the pilot experiment. These results lend some support to the argument that movements can improve peoples ability to judge mental states. Angry and happy were two states that did not include any movement previously, and they both appear to have become easier to identify after this was added. While confused also received a higher rating as compared to previous results, it should be mentioned that these tests did not include the mental state indifferent. This state was identified as confused by four out of five participants in the previous study, and the exclusion of this state should likely make the identification of confused easier in this type of test where only one behavioral pattern can be connected to an predefined mental state. Thinking was not improved in regards to peoples ability to distinguish it from other mental states. This is not surprising, as the mental state was not at all changed in the first followup experiment. Sad, however, received a lower rate of correct judgments. While this may appear strange at first, as sad also did not include any change in this experiment, it likely is connected to one of the larger limitations of these initial studies, namely the fact that they were only carried out with five participants each. Because of these low numbers, the likelihood of confounding variables significantly influencing the results are high. While this was seen as a reasonable risk to take in this stage of testing, with each test giving several ideas for improvement, it was agreed that later stages of the project should include testing with a larger amount of participants. 8
117 Table 3 Table of changes for the robots design in follow-up experiments. Mental state Neck motor Eye motor Mouth intensity Mouth row Thinking Up Normal None 0 1 Both rows Angry Left Right None Outer: 0 Middle: 0,5 Inner: 1 Happy Up Normal None 1 Confused Sad None Right & Down Left eye left & right eye right Left eye right & right eye left Both Eyes Middle Mouth movement Serial movement, left right Other None Bottom row None None Outer top row, middle & inner bottom row 0 1 Both rows 1 Outer bottom row, middle & inner top row None Random blinking pattern None Brown color Random color None As for the addition of a mouth, it appeared to then further improve participants ability to distinguish mental states. It also seemed to make participants more willing to claim that the robots behavioral pattern actually was a good display of the mental state they choose. When comparing to results from the first follow-up experiment, these behavioral patterns were better for identifying mental states in three out of five cases, and received a higher judgment of distinctiveness in two cases. Angry appears to be the mental state which gained the most from the addition of movement and a mouth. While it was identified by a large number of participants in the first test, this number increased in the first follow-up experiment, and in the second follow-up experiment all participants were able to correctly identify it. The participants judgment of distinctness for angry was also improved following the addition of a mouth. Happy and confused both received lower rates of identification and distinctness in the second follow-up experiment. One possible interpretation is that the mouth did not help in making these states easier to interpret. Another possible interpretation is that the other additions to these mental states were interfering. Several participants expressed confusion regarding the use of color in happy, and most participants, while amused by it, did not consider the use of random patterns and colors fitting for the display of confused. 5 Final experiment Results from the follow-up experiments showed that the new designs for mental states were able to improve both correct identification and subjective judgment of distinctness for several of the states. As these results were gathered from a low number of participants, a final experiment was designed. This experiment involved very few changes to the mental states, but were based on a larger number of participants. A display of the final design for mental states in Epi can be seen in Appendix A. The projects source code can be found at (Group-14, 2016). 5.1 Additional implementation One module was implemented in the later parts of the project, MouthModule. MouthModule decides the intensity and color for the different LED lamps used in the mouth of Epi. How the modules are used and connected can be seen in the flowchart in Fig 4. The two mental states that appeared lacking in the second test were happy and confused. To improve happy it was decided that the previous version of using green for color coding would be more appropriate. In terms of improvements to confused, several discussions provided no answer to how this mental state could be improved. As a result of this, the mental state was kept the same as in the second follow-up experiment, with the hope that additional data could provide more reliable results in terms of its usability. The final design for the mental states as such was identical to that of the mental states in the second follow-up experiment, with the exception that happy used green as the color for mouth and eyes. 5.2 Designing the final experiment To improve the reliability of previous results, it was decided that more individuals needed to be part of the study. 20 participants were recruited, all of which were found on the university grounds at Lunds University. No reward was promised for participating, but interest for observing a robot was very high and made recruiting a reasonably fast procedure. The procedure for carrying out this experiment was kept the same as that used in the follow-up experiments. Fig.13 displays the experimental setup. 5.3 Results As seen in Fig 14 the result of the final test was much more consistent. All participants identified sad and angry. The majority of the participants in the previous tests were not able to identify Confused, but in the final test 75% of the participants were able to do it. The mean value of participants judgment regarding distinctness of the mental states has all increased (except sad which was unchanged) compared to the previous test, as seen in Fig 15. Thinking, happy and confused all had low score with a comparatively high standard deviation, whereas angry and sad had high score with a much lower standard deviation. 9


118 Figure 13 Experiment setup for the final test. 1: Paper used to map mental states to robot behavior. Small pieces of paper were shown, and then placed on the large paper to indicate which mental state the robot had displayed. 2: The robot. 3: Experimental supervisor. 4: Participant. Figure 14 Results from the final experiments. Each bar represents a correct mapping between designed mental state and interpreted mental state. 6 Final Discussion The final experiment provide evidence for the claim that at least two of the five designed mental states can be easily identified and have a high degree of distinctness. Both angry and sad were correctly identified by all 20 participants, and received values of distinctness close to 5. The variability regarding distinctness was also kept reasonably low for both states, indicating that close to all participants considered these states to be very distinct. While angry and sad appear to be useful in their current design, thinking, happy and confused still seem lacking. The majority of participants were able to identify these states, but judgment of distinctness was about average. The variability in participants judgment of distinctness is also very large, which shows that the mental states created likely won t be universally useful. This variability does, however, also show that some participants considered these states to be highly distinct, and further testing might reveal that some features included in these tests can be used to infer the mental state. An example of this was observed when testing the mental state happy, which several people mentioned became much more distinct once they had come to realize that the mouth was indeed lit. Figure 15 The mean value of the participants judgment regarding distinctness of the five mental states represented with a numeric rating scale, where 5 was very distinct and 1 was indistinct. Also including standard deviation. As previously mentioned, the mouth used in this experiment was very limited in its design, and even when the robot was looking up it was often difficult to notice the light. Regarding the mental state of thinking, the results seem to show that the computer metaphor used in the current design is limited. Adding another feature frequently associated with loading, in the form of a loading bar, did not increase its usefulness as a tool for conveying thinking in the robot. It can be argued that people who notice and understand the throbber symbol in Epi s eyes are the same people who will understand the loading bar in Epi s mouth, and that people who do not make a connection for one of these metaphors will not understand the other. When considering this, it appears that the cultural factors as such seem to have large influence on the results for this behaviors usefulness, and that the cultural understanding that is relied on with this mental state might not be as widely distributed as initially assumed. These more extensive tests reaffirmed the results that the current design for confused is not efficient in conveying the mental state. After trying three significantly different designs and still not getting any improvements to the results, it seems reasonable to assume that this mental state is difficult to display with the tools available. Different images displaying confusion in humans and popular communicative tools, such as smileys, shows three features that has great importance for this mental state. These include hands on top of or close to the head, eyebrows with differing heights, and tilting of the head. The current design of EPI lacks hands and eyebrows, while also having very limited motor options for neck movement. By excluding these three features it seems unlikely that a useful design for confused can be created. While the results are very positive for two mental states, it is important to mention that the test allowed for different methods of exclusion. The participants knew beforehand which mental states were to appear, and they could only connect one behavioral pattern to one mental state. Even if a mental state was not very clear it would still be possible for the participant to reach a correct conclusion by excluding behaviors that had already been mapped to another state. Considering that the participants were also allowed to change their decisions after having seen all mental states, and could see each mental state more than once, it seems likely that this method could be used. Not knowing if the mental states could be identified 10
119 without methods of exclusion makes the gathered results less useful. It is possible that the mental state can not be properly distinguished on their own, and if this is the case they would be much less useful in any more natural situation. An attempt to reduce this problem was to include the scale of distinctness. If a mental state is rated as highly distinct by the participants, it seems more likely that it would be able to convey the correct mental state in a natural setting. These ratings might arguably also be affected by knowing which states exist beforehand, but it seems likely that state which received both high values for identification and distinctness should be employing a good design. 7 Future Development Overall, there are several possibilities for further development and testing related to this project. First of all, it would be useful to conduct an experiment where the test person has to guess the state of Epi without knowing any options beforehand. This will remove the factor of exclusion methods in the test, and better test the interpretation of the mental states. Second, further development of EPI should allow for better designs in several of the mentioned mental states. Another design of the mouth could be followed by a new test of these mental states, to see if the previously mentioned designs of mouth indeed could convey mental states when visible. By including new features such as eyebrows, hands, and more flexible neck movements, some of the less reliable mental states could be improved. A third possibility for development relates to the inclusion of different gaze behaviors. While this is not a feature this project has focused on, it appears to be central for conducting natural communication. By combining different displays of mental states with behaviors such as gaze aversion, it seems possible that EPI can become a quite natural conversational partner. 8 Conclusion This project sought to design and implement behavioral features in a robot, with the goal of creating behaviors that could be interpreted as the display of certain mental states. Focus was on facial features such as eyes and mouth, but also included motor movements. Results from the initial study displayed that certain states are especially difficult to model in a robot, while other states can be reliably mapped by relying on precis movement and cultural references. Follow-up experiments built on findings from the initial experiment, and found support for the claim that movement and mouth could improve the representation of mental states, with overall better scores for identification and distinctness. The results of the final experiment displays that two out of five mental states, angry and sad, were very easy to map to a mental state. The high score regarding their distinctness makes them likely to be useful in other social environments in the future. As for the other three mental state, thinking, happy, and confused, they seem to require further development in that they appear quite limited in the present situation. Suggestions for further development were presented, including different experimental setup, additional facial and bodily features, and the inclusion of gaze behavior. References Adams Jr, R. B., & Kleck, R. E. (2005). Effects of direct and averted gaze on the perception of facially communicated emotion. Emotion, 5(1), 3. Andrist, S., Tan, X. Z., Gleicher, M., & Mutlu, B. (2014). Conversational gaze aversion for humanlike robots. In Proceedings of the 2014 acm/ieee international conference on human-robot interaction (pp ). Balkenius, C., Morén, J., Johansson, B., & Johnsson, M. (2010). Ikaros: Building cognitive models for robots. Advanced Engineering Informatics, 24(1), Bentivoglio, A. R., Bressman, S. B., Cassetta, E., Carretta, D., Tonali, P., & Albanese, A. (1997). Analysis of blink rate patterns in normal subjects. Movement Disorders, 12(6), Breazeal, C. (2003). Emotion and sociable humanoid robots. International Journal of Human-Computer Studies, 59(1), Broz, F., Lehmann, H., Nehaniv, C. L., & Dautenhahn, K. (2012). Mutual gaze, personality, and familiarity: Dual eye-tracking during conversation. In 2012 ieee ro-man: The 21st ieee international symposium on robot and human interactive communication (pp ). Delaunay, F., de Greeff, J., & Belpaeme, T. (2010). A study of a retro-projected robotic face and its effectiveness for gaze reading by humans. In Proceedings of the 5th acm/ieee international conference on human-robot interaction (pp ). Foerster, F., Bailly, G., & Elisei, F. (2015). Impact of iris size and eyelids coupling on the estimation of the gaze direction of a robotic talking head by human viewers. In Humanoid robots (humanoids), 2015 ieee-ras 15th international conference on (pp ). Gielniak, M. J., Liu, C. K., & Thomaz, A. L. (2013). Generating human-like motion for robots. The International Journal of Robotics Research, 32(11), Group-14. (2016). Source code. Retrieved , from Hess, E. H., & Polt, J. M. (1960). Pupil size as related to interest value of visual stimuli. Science, 132(3423), Ikaros. (2015). Modules. Retrieved , from Onuki, T., Ishinoda, T., Tsuburaya, E., Miyata, Y., Kobayashi, Y., & Kuno, Y. (2013). Designing robot eyes for communicating gaze. Interaction Studies, 14(3), PatrynWorldLatestNews. (2016).. jia jia the china s most realistic humanoid who recognises faces and can learn new skills. Retrieved , from Samani, H., Saadatian, E., Pang, N., Polydorou, D., Fernando, O. N. N., Nakatsu, R., & Koh, J. T. K. V. (2013). Cultural robotics: The culture of robotics and robotics in culture. International Journal of Advanced Robotic Systems, 10. Sirois, S., & Brisson, J. (2014). Pupillometry. Wiley Interdisciplinary Reviews: Cognitive Science, 5(6), Stuart, A. (2015). Throbber. Retrieved , from 11


120 Appendix A - Final implementation of Epi s behavior during the five different mental states Figure 16 To the left, Epi s behavior during the mental state of loading. To the right, Epi s behavior during the mental state of confused. Figure 17 Epi s behavior during the mental state of angry. 12


121 Figure 18 To the left, Epi s behavior during the mental state of happy. To the right, Epi s behavior during the mental state of sad. 13
122
123 Implementing natural gazing behaviour in a social robot Simon Holk, Sara Lindgren, Rasmus Olofzon, Julia Rosén Because humans have a particular way of behaving around other people in terms of attention, we wanted to explore the possibility of implementing this in a social robot. By doing this we can not only understand our own cognitive capabilities better, but also produce a social robot that is human-like in its manners. Two pre-tests were done, the latter using an eye tracking system, where a participant sat on a chair in a small room, observing a person that entered the room and performed small tasks. Based on these studies we could implement this behaviour on Epi, a humanoid robot using the Ikaros system. We tested this system by letting participants interact with Epi, and afterwards answering a questionnaire. From this we found that participants indeed thought Epi acted, in some extent, natural. We hope that our project contributed to a more natural behaving robot. 1 Introduction We humans are capable of vast emotional expressions. Naturally, this coupled with complex social rules means that the behaviours a person may exhibit while in the presence of other people are extremely diverse. Nevertheless, people are somewhat predictable in their behaviour when you isolate the specific context they are in. For example, where does a person look when another individual is entering a room? One way to explain this behaviour is looking at attention, which is defined as focus on mental capacities on selections o the sensory input so that the mind can successfully process the stimulus of interest (Duchowski, 2007). When an individual enters a room, the person in the room will draw their attention towards the direction of the stimulus because they heard, saw and possibly felt (from the draft) the door opening and an individual entering the room (Balkenius, 2015). Attention is an integral part of how a person acts naturally in any setting since the person will look and act in the direction their attention dictates. Moreover, one of the ways to show attention is through eye contact, which is used in part to gather feed-back on the other person s reaction. When having eye contact, the a liated does not hold eye contact consistently, but rather looks away every 3-10 seconds, when glances are longer than this, anxiety is aroused (Argyle & Dean, 1965). An e ective tool to measure attention and eye contact is through eye tracking. Eye tracking records eye movements and is used to investigate the cognitive processing, cognitive load, and usability. In other words, the main assumption behind eye tracking is the so-called eye-mind hypothesis, which assumes that when the eye focuses on an object, the brain is engaged in some kind of cognitive processing and thus it is assumed that gaze is related to attention (Doherty et al., 2010). An eye tracker is capable of measuring fixations (how the eye moves), and the pupil dilation or pupillometrics. Lastly, If we track someone s eye movements, we can follow along the path of attention deployed by the observer. This may give us some insight into what the observer found interesting, that is, what drew their attention, and perhaps even provide a clue as to how that person perceived whatever scene she or he was viewing (Duchowski, 2007). The interest of human behaviour does not only lie in the interest of understanding ourselves but also to emulate this in robots and artificial intelligence. We do this not only to model human cognition, but to create social robots for everyday use. The emergence of social robotics has led to rapid developments, and researchers in the field predict the applications of the robots in domains as diverse as tourism, mass media, health services, and education. They expect robots to be capable of directing people through museums and supermarkets, broadcasting the latest news, providing comfort and care to the elderly, and guiding children in learning foreign languages (Alač, 2009). When it comes to social robotics, a physical form with motor and sensory abilities needs to exist in order to interact with humans and other robots in a natural matter. To reenact such natural behaviour, observational studies on humans should be done, to carefully observe the richness of everyday activities in the environment in which the bodies of social actors are designed and enacted (Alač, 2009) In this study, we wanted to implement such a natural behaviour and pattern in Epi, a humanoid robot. Epi was created by the LUCS Robotic Group at Lund University and is used to study the many aspects of cognition. Epi is controlled by the system Ikaros, a project for system-level cognitive modeling and is used for cognitive experiments (see more at ikaros-project.org). For our study, we chose the behaviour one has when another person is entering the room. We started our study with two tests, the first observing human-to-human interaction, and the second one, observing human-to-human interaction with an eye tracker to get more precise data. After this, we implemented our findings in Epi via the Ikaros system. We then carried out tests in order to test how natural the test participants deemed Epi (with our system running) to be. 2 Method Pretest This served as a mix between a pre-test and a pilot study. The test was carried out in a small room. The instructions given to the participants were to sit in a chair in the
124 corner of the room, and that the study concerned studying/learning environments. The subject was to play the role of a student, and consequently just sit still and observe the situation. The experiment consisted of this: the test leader (TL) walked into the room, walked up to a whiteboard on the wall and wrote a greeting ( Hello or Hello again ). After that, TL walked to the chair on the opposite side of the table from the participant and sat down. TL proceeded to pick up a cube, look at it, and then put it down again. The scenario was filmed with a camera that was aimed towards the participant to see the di erent reactions and where the participant was looking. The purpose of this study was to observe the person sitting down in order to explore their behaviour. This would give us pointers as to which (similar) behaviours we should implement in Epi. For this part, we had a total of five participants (N=5). Eye tracking test The eye tracking test was in large part similar to the pretest. Three changes were made: firstly, the test leader draws a simple symbol (circle, square or triangle) on the whiteboard. Secondly, instead of picking up a cube while at the table, they instead draw another simple symbol (di erent from the one on the whiteboard, random combinations of these between tests) on a piece of paper. Thirdly, instead of filming the participants, we were given the opportunity to borrow a pair of eye tracking glasses from the Humanities lab at Lund University (see more at, These glasses tracked exactly where the participant was looking. The reason for aforementioned changes are that we may well want to expand the scope of this project further on, if our first implementations work well. This will be discussed further in the Discussion sections of this paper. For this second test, we had a total of six participants (N=6). Evaluation Test In the evaluation test the participant now take the role of the person walking into the room and drawing symbols (the test leader, TL). Epi takes the role of sitting down and observing. Unlike before, the participant did not draw on the whiteboard. The participant had the mission to walk into the room, sit in front of Epi and then draw a circle or a piece of paper. There was no test leader having an active role this time, only Epi and the participant were active in the test. We had an observer that sat outside the room and wrote down observations about the interactions. The instructions the participants received changed as the tests progressed, as we realised that the features in our system were not tested adequately. Some of the participants were told that they were teaching Epi to recognize symbols before they went in, some were told straight out that we tried to make the robot look at a person naturally, some to deliberately seek eye contact, the first participants were told basically only the description in the paragraph above. Afterwards all participants were asked to fill out a survey in which they rated how human-like the robot was, how much the eye colors helped and other general questions about robots. Throughout the tests we made adjustments like changing the position slightly back on Epi (in order to avoid the closest point being the table), tell the participant to try to establish eye contact with Epi (in order to test this behaviour; the earliest participants carried out the test very rapidly and this feature was almost not tested at all) and to not keep their hands on the table (also to avoid the Closest point module triggering on the hands). For this test, we had a total of eleven participants (N=11). The Ikaros system and its modules The Ikaros system is composed of modules. Each module has a specific task or purpose. The general form of a module is that it is fed with an input, does something with this input and then outputs the result. However, the modules can have several inputs and outputs. The modules are written in C++, JavaScript and C, and are connected in a HTML-like manner. 3 Results In our pre-studies we wanted to observe humans in a natural environment; specifically when a person enters a room with another person already in the room. With this information we aimed to create modules that could be implemented in Epi in order to create a natural behaviour in a social robot. Our pre-studies found that people have specific behavioral patterns in an isolated environment. This will be elaborated upon below, as well as a description of our final system and results from the evaluation tests of that system. Pre-test All the participants in the pre-test displayed similar behaviour: when the test leader entered the room, the participant looked in the direction of the door. While TL walked to the whiteboard the participant alternated between looking directly at TL and the space around TL. This may be because in most cultures it is deemed awkward or even rude to stare intensely at a person for an extended period of time (Argyle & Dean, 1965). When TL walked towards the table where the participant sat they continued with the behaviour pattern of looking at TL, looking away, at TL, away... and so on. This pattern was maintained also when TL sat down at the table. When TL held up the cube the participant focused more on the cube than TL. Despite this, some eye contact was still made while looking at the cube. Our main conclusion after this pre-test was that people do in fact track another person with their eyes while the person is walking around; however, the participant will look away now and then, possibly to avoid awkwardness. Eye tracking test Similar to the pre-test, all our participants in the eye tracking test displayed behaviour similar to one another. With the eye tracking device we could confirm our results from the pre-test people will follow the test leader with 2
125 Figure 2: This is the state machine representing the system we designed and implemented in Epi. Figure 1: The movements in the test and the placement of the participant their eyes, but will alternate between looking directly at TL and the space around TL. The first part of the test, up till the point where TL is sitting in front of the participant, had similar results. For this test we decided to skip the cube and include drawing symbols instead, both on the whiteboard and on a paper on the table. Based on the eye tracking data we could see that the participant will not only follow the pen that is used to draw the symbol, but also to predict the forthcoming movement; most often the last line or last part of the symbol. This indicates that the participant had prior knowledge of these symbols; thus they could predict what it would portray once enough information to complete the pattern was presented (e. g. three of four lines in a rectangle). All our participants predicted the symbol once it was on its last line (or last part, for the circle). The participants predicted by drawing the last line with their eyes, i. e. quickly looking between the points where they symbols need to be connected in order to complete the symbol. We have not included these behaviours in our modules and our project; however, it could be a possibility for future projects, namely ones that focus on prediction. This will be discussed further in the Discussion section of this paper. tected ) the system goes in to state 2. This state changes Epi s eye color to a bright green. In this state, the system will look for objects that are moving closer to Epi and if the face is lost. If the face is lost ( face lost timeout ), the system will go back to state 0. However, if the system in state 2 detects an object that is close enough ( closest point detected ), it will go into state 4. While in this state, Epi s eyes will be a dimmer green with a bit of red in it. When the object is no longer close ( closest point lost ), the system will go back to state 2. If the system has been in state 2 without changing for a period of time ( lookaway timeout ), Epi will change to state 3 and Look away. This will turn Epi s eye color to a lighter green. When some time has passed (timeout), the system will go back to state 2 again. Modules Below is information on the individual modules realising the state machine. The completed system From the results of the pre-tests we could identify behaviour patterns, that we were able to break out and model as di erent states in a state machine. We then designed our system based on this state machine. A description of the system and its states follows. A visual representation of the state machine can be seen in Figure 2. The system starts in a discovery mode, or in state 0. This state gives Epi a blue eye color, and Epi looks for movements. If a movement is found ( mvmnt detected in Figure 2) the system goes into state 1, in which Epi starts looking for a face. If enough time passes without a face and the movement stops ( timeout ), the system returns to state 0. Otherwise, if a face is found ( face de- Figure 3: The modules we implemented and how they connect to each other. White are standard Ikaros modules, gray are the ones we implemented. The connections to and from the module StateHandler are shown in Figure 4 further down, in order to allow for more clarity in this figure. 3

126 Closest point The closest point module takes in an input matrix in the form of depth per pixel. In our project we use a Kinect 640x480 resolution camera. This module takes the Kinect s depth image. It divides the input matrix into smaller matrices and calculates the average depth in these matrices. It then compares the depth of all the matrices and chooses the matrices with the lowest value; these then represent the closest point. We take the middle pixel coordinate of the matrix and send it as output. With parameters you can decide how big you want the matrices to be. Movement detector This module was created as an.ikc-file (Ikaros control file) with mostly existing, standard Ikaros modules. However, one module was written in order to add compatibility with the StateHandler. The Movement detector is a module that takes an input matrix from a video camera. In this project we use a Kinect s camera, as mentioned above. This image matrix (not depth, as in the case of the Closest point module) is given as input to an instance of the ChangeDetector module. The module then splits the output from ChangeDetector into six equally sized regions (two rows, three columns). This is done with the module Submatrix. Each one of these submatrixes are input to Mean modules. This makes the region of the image with the most movement out of the six parts have a higher mean, since ChangeDetector only routes through changes in image compared to the previous image. This highest mean is then found with a Arbiter module, and the number representing the region of the image corresponding to the highest mean is given as input to the Movement detector chooser (described below), as well as current state and the if any detected movement is above the set treshold (above which movement is deemed to be detected, lower movement than this is filtered). The Movement detector chooser returns direct to Movement detector s outputs: coordinates to look at, a weight (explained in the section The connections to StateHandler below) and the requested state. Movement detector chooser This module was created to create compatibility with our StateHandler module, the behaviours needed did to our knowledge not exist in any standard Ikaros module. It basically checks which the current state is: if it is the first state, it checks if there was enough movement detected in Movement detector to warrant a state change. If so, it sends the requested state (state 1) as output as well as the coordinates for the region with the detected movement. There are six regions, but if movement is detected in any of the lower regions coordinates for the region above is output. Face location Face location is a module that has two inputs, one of which is a matrix from Ikaros standard module CIFaceDetector s output FACESINPUT. This provides a matrix with the x and y coordinates (in the form of a scale from 0 to 1) of the detected face. The other input is the depth output from the Kinect. Face Location then finds the depth (z coordinate) by converting the x and y coordinates to coordinates in the depth matrix and use them to find the z coordinate. Its output is either the x, y and z coordinates one by one or a 4x4 matrix, which is the form that Epi can understand. Look away This module uses Face location s output in the form of a 4x4 matrix as a first input and the image matrix from the Kinect as a second input. It then takes the X value and changes it slightly and double checks that this coordinate is in the Kinect image, otherwise it will change the X value to look at the other side of the face. It then creates a new 4x4 matrix which it uses as an output. This output value will thus be slightly to the side of the face in the picture. Figure 4: This is a complement to Figure 3. These dependencies are not shown in Fig. 3 to allow for more clarity. Nevertheless, these dependencies do still exist. The connections to Statehandler All of these four modules (not counting Movement detector chooser since that is only a part of Movement detector) have one thing in common: how they handle states to send to the Statehandler, as seen in Figure 4. They each have an input for which state the system is currently in, and depending on the module and the current state the modules will send a value to the Statehandler saying if they want to change state or if they want to maintain status quo. They send two things: their requested state, as well as a weight that tells how much they should be listened to. If the system is in a state that a specific module wants to be heard on, e.g. if Closest point in state 4 wants Epi to look at a specific point, said module will send a value higher than 0 to an Arbiter module, as seen in Figure 3. In some states, multiple modules can send non-zero values to said Arbiter module. If this happens, the highest value will be selected and the data from the associated module will be sent to Epi. Statehandler The system is built on states, as described in the section The completed system above. The Statehandler has an input from the modules above in which the modules send the state they want to be in. It also has an output that are sent to the modules that says which state the system is in at the moment. If one or more modules wants to change state, the Statehandler handles this and sends the change to the modules. Some states are only supposed to occur 4
127 in a certain period of time and therefore Statehandler has a timer in it which controls that some of the modules are not listened to for too long, e.g. Look away. Statehandler also handles eye color, which changes depending on which state the system is in. Pixel to meter converter The pixel to meter converter is a module that basically receives pixel coordinates and turns them into real world coordinates (in meters). This is to make certain modules easier to create, since every specific module that are created don t have to perform the underlying math and calculate its coordinates to be compatible with how Epi handles coordinates. Instead they just send in their coordinates as an input to this module and the calculations are done for them, e ectively reducing redundant code. Pixel coordinates here refer to the x, y, and depth value of the pixel in an image. The idea is to calculate the vertical and horizontal coordinates by using the field of view (FoV) of the camera and the depth of the pixel. Most of the code could be found in another existing module called DepthBlobList in Ikaros, so we used parts of that code and made a converter module that more modules can use in general. Evaluation Test In this test we ran our system, which mimics the behaviours that we observed in the pre-tests. The participants of this last test were brought in in order to evaluate how well our modeled behaviour in Epi matched those behaviours. We had to be adaptive when we performed the tests, as some unnatural behaviour in Epi showed up when participants didn t behave as we expected (as is the case with most users of systems). The unexpected behaviours were, amongst others, the participant resting their hands on the table. This caused Epi to look at the participant s hands instead of the face. This lead to some participants feeling like they didn t get any contact with Epi, and this can be seen in some of the free text answers in the survey included in Appendix A. We also had to move Epi further back at one point and lift it up on a box to make the interaction as natural as possible. Every test took less than one minute, which in some cases lead to people not really taking the time to look into Epi s eyes. This may be another reason to why some people felt like they didn t get much contact. The result of our test was the following: Epi was perceived as more on the natural side than the unnatural, but still some more improvements can be done. Most people thought the eye-colors of Epi was a good help when it came to interacting with Epi. Most people felt like they got contact with Epi. More information about the test result can be found in Appendix A. 4 Discussion In our two pre-tests we found a unified behaviour when it comes to where a participant looks when a person enters into a room. From this data we could create modules to model that behaviour. In order to make these modules and modeled behaviours useful, we designed a system that emulated the behaviour patterns of real persons; activating these modules when appropriate, to act like the real persons in our pre-tests did. Our studies The validity of our tests should be discussed. Is the situation we chose (a person entering a room) applicable to other situations, in other words, does the study have ecological validity? Can we draw conclusions about natural behaviour, or, for that matter, only behaviour, in this specific situation? Furthermore, we cannot say that people will always display these behaviours when a person enters the room. The participants were well aware that something would happen and that they were being watched. This may have lowered the reliability of the study. For example, perhaps a complete stranger would cause less looks for the participant. This problem can be found in any study that is not observational, not just in social robotics. Despite these things, we chose not do it another way since we still wanted a controlled study. For the scope of this study we needed to make up a specific situation because of time constraint, lacking resources to make a larger study on behaviour, and simply because it is near impossible to study all kinds of behaviour and then implementing them in a robot. Perhaps it is more correct to say that we wanted to create a natural behaving robot in the terms of someone entering a room with the knowledge that the person in the room is supposed to be somewhat familiar to the person entering the room. Perhaps the result will not be as applicable to all situations Epi can end up in, but to make sure that the behaviour is more universal, more studies should be done in other situations and other pretenses. By doing this, one could say with more confidence that Epi acts in a natural manner in general. An interesting question arises: what, really, is natural? Which definition of natural should we use? The term natural of course di ers between cultures, class, age, and almost every other factor one can take into account. To complicate matters further, the fact that Epi actually is a robot may mean that its behaviour will be judged on di erent terms than would the same behaviour displayed in a human. We chose to use the unified behaviour described above as our definition of natural in this context. Nevertheless, it is a very interesting aspect to take into consideration. It is worth investigating and discussing further. Possible improvements of the modules There are always aspects in a project that can be improved. Here, we will discuss which implementations we would prioritize if we were to have more time. Perhaps it may facilitate for later similar projects, or give birth to new ideas. Closest point This module could possibly be combined with other modules like the face detector, since the relevance of the closest point greatly depends on where the other interesting points are, (and) if any exists. For example, it might receive the coordinates from the face detector. This can then add extra value to the coordinates around the face, 5
128 making those coordinates weighted higher and thus indicating that they probably are more interesting than the absolute closest point. The threshold for a closest point could also be made to depend on the depth value of the detected face. There are also some optimization that can be done, e. g. doing the value comparison inside the master loop and to add parameters that skips pixels, so you don t go through all the pixels of the depth image. As of now the module tracks the absolute closest point within 0.6m of the Kinect. An improvement could be to have a timeout or comparison of previous images. This would both enable a more natural behaviour, as well as fix the problem we had in the evaluation tests with participant resting their hands on the table and Epi looking only at their hands. Movement detector chooser The fact that Movement detector e ectively only has three regions due to the filtration in Movement detector chooser was a change made after our evaluation tests. There we noticed that if Epi looked at one of the lower regions it seemed to look at peoples legs. To change it to have Epi look at the upper regions and consequently approximately at peoples faces correlated better to the behaviours observed in the pre-tests. The Movement detector module could also be modified to reflect this change. Movement detection In our early vision for Epi, we thought it was necessary to have some sort of movement detection while in State 2, i. e. when a face is found. This for if the participant moves e.g. their arm to the side, which would not be picked up by Closest point. This would also correlate with the behaviour of real persons, when there is much movement our eyes are drawn to the movement (Balkenius, 2015). We started to work on a module like this. It built on the Movement detector described above, but used another module we wrote, called Splitter, that could handle splitting of the image with relative size of the image. An input to this smaller Movement detector received as input coordinates from Face location that specified a small matrix around the detected face. This was split by the Splitter above, run through an Arbiter as in the regular Movement detector, and then input to a small Movement detector chooser. Then coordinates, a weight and requested state is output. So, the module was in principle finished, but due to lack of time we did not integrate it into the complete system. We instead focused on carrying out the evaluation tests. Possible paths to tread This project has only scratched the surface of what Epi is capable of. While working with this project, we could see some developments to Epi, that might not be too far of a reach in the near future. Prediction After carrying out the eye tracking study, we observed the interesting behaviour that people predict the symbol that is being drawn and completes it with their eyes. This is something that would be very interesting to explore further, albeit hard with today s capabilities; relatively simple behaviours like looking at a face can be done thanks to image analyzing software and that the behaviour only needs to operate in real time. Adding prediction capabilities probably lies in the future; although, with a well-defined and narrow use case it may be possible to achieve. Irregardless, it could be valuable to explore the possibilities. Symbol recognition and a classroom environment The project description we received at the start of the project stated that we should explore di erent situations a robot could be subjected to. One such scenario or situation could be if a social robot is incorporated in a teaching or classroom environment, especially in a teaching role. This would require the robot to be able to recognize symbols (and, with that, written language) in order to understand the student s grasp of the subject at hand and to decipher if further explanation is necessary. To connect this to our project, one reason for us choosing to include the test leader (TL) drawing symbols in the eyetracking study was what is described above. We deemed it interesting to see if it was possible to make Epi understand simple symbols drawn by a person, i. e. big squares, circles or triangles. Due to lack of time, we did not explore this. However, we had a couple of ideas on how to accomplish this. Firstly, by tracking the person s hand during the actual drawing of the symbol; either by tracking the persons skeleton and/or hand (using Kinect and some sort of skeleton tracking system, e. g. OpenNI (OpenNI web page)), or having a QR code on the pencil (since Ikaros modules exist that can track a QR code). Secondly, to use image processing on the finished symbol; there exists a number of image processing modules in the Ikaros system that could be used for this purpose. Either while the paper still lies on the table, or held up for Epi to see better (also to avoid extra calculations due to the need to compensate for the viewing angle if the paper lies on the table). A problem with the first strategy could be that it is hard to tell when this is to be done. Always when tracking movements? After some sort of symbol or signal from the user? The second strategy may be easier in this regard, especially if the paper is held up towards Epi. Another problem with the first strategy could be if the user is moving very rapidly, or if something else happens; then important information needed to decide which symbol was written may be lost. Of course, there are also di erences in the complexity in the problem of recognizing simple symbols like big circles and squares and in the problem of recognizing and understanding e. g. written language in small font. There already exist robots whose purpose are to be in a teaching environment; a notable example is NAO (see more at, This is a humanoid robot with two memorable characteristics; it is cute and it can dance. More interestingly in the context described above is that it was made to, amongst other things, take on a role as a teacher s assistant. It is especially well suited to interacting with children with autism (Huskens et al, 2012). A robot such as this could be well served by understanding symbols in order to facilitate teaching. 6
129 Conversation simulation Another path that may be interesting to take is to try to simulate conversations between a person and Epi. Our system could work well for this; discovering a person coming into the room and then looking at their face, averting its eyes from time to time in a manner similar to humans, and if something is held up towards Epi it will look at that. Right now there is only sound output on Epi; however, if this was to be combined with a microphone to the computer used, and in this computer use some sort of voice recognition connected to a chatbot or AI assistant, this software s output routed through Epi s speakers, conversations with Epi could be a possibility. Of course, this depends on the quality and speed of the software used for the conversations. This is, however, an area that is evolving rapidly. A possibility for future group compositions in this course could be with participants from one of the machine learning or language technology courses on LTH. Otherwise, NAO (described above) has support for real-time audio output of text input by a person in the web interface. Something similar to this could possibly be used in order to carry out a study where participants are asked to have a conversation with Epi, and a test leader is nearby, perhaps hidden, so that they hear what the participant is saying and can respond to this through text input read aloud by Epi. This could use our system, possibly combined with other modeled conversation behaviours. Natural behaviour constraints To reconnect to above discussion about what natural really is: Epi s physical body should also be considered in regards to natural behaviour and the validity of our studies because of it. Since the version of Epi we use only has shoulders and a head, with no capability of facial expression, it is hard to determine how much human-like traits Epi could posses overall. In addition, Epi lacks mouth, eyebrows and is only capable to move the eyes horizontally, which once again could hinder participants to experience Epi s expressions as natural. It could be advisable to consider this when creating new versions of Epi for future studies. It may also be interesting to do a study comparing the reactions to the same behaviour displayed in either Epi or a human. One could also argue that, due to the fact that Epi couldn t be mistaken for a human, people interacting with Epi will set di erent standards on it than they would on a human. They might analyze if Epi s behaviour is natural based on what they think a human would do, instead of what a human actually would. on adjusting these further. Of course, the aim to create a natural robot, in any matter, has its limits. More studies should be done to figure out how to get around these limits or as technology progresses, solve them. The more the Ikaros project can be fine-tuned, the more realistic will Epi s natural behavior be. We hope that our project contributed to the advancement of a more realistic humanoid robot. References [1] Alač, M. (2009). Moving Android: On Social Robots and Body-in-Interaction. Social Studies of Science, 39(4), [2] Argyle, M., & Dean, J. (1965). Eye-Contact, Distance and A liation. Sociometry, 28(3), doi:1. [3] Balkenius, C. (2015). Lecture on Cognitive Neuroscience. Personal Collection of C. Balkenius, Lund University, Sweden. [4] Duchowski, A. T. (2007). Eye tracking methodology: Theory and practice. London: Springer. [5] Doherty, S., O Brien, S., & Carl, M. (2010). Eye tracking as an MT evaluation technique. Machine Translation, 24(1), [6] Humanities lab, Lund University se/reflex/laboratories/humanities-lab/, last accessed [7] The Ikaros Project s web page, http: //ikaros-project.org/, last accessed [8] Web page for OpenNI openni, last accessed [9] Web page explaning NAO (by the company that makes NAO), softbankrobotics.com/en/cool-robots/nao, last accessed [10] Huskens B., Verschuur R., Gillesen J., Didden R., Promoting question-asking in school-aged children with autism spectrum disorders: E ectiveness of a robot intervention compared to a humantrainer intervention, com/sites/default/files/publications/ huskensverschuurgillesenbarakova_2013_ promotingquestionasking.pdf, last accessed The future of Epi In this study, we tried to re-enact natural behaviour in a humanoid robot. We did this by pre-tests to learn more about human behaviour, so we could subsequently implement this in the robot. Several modules were built and then tested on humans. They were asked to interact with Epi and then answered a questionnaire. From this we found that Epi does indeed display some natural behaviours. Both Epi s body and the modules showed certain constraints, and thus should future studies focus 7

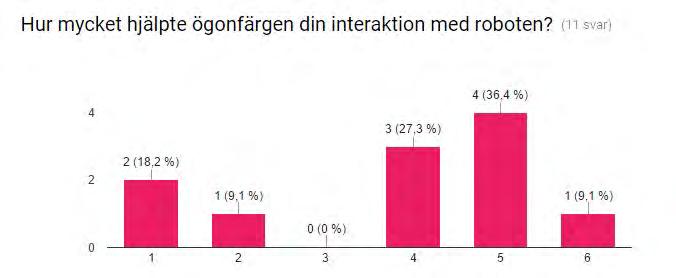
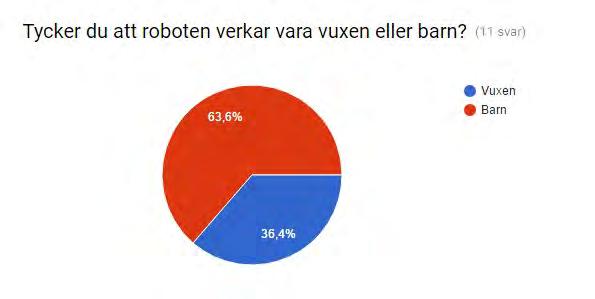
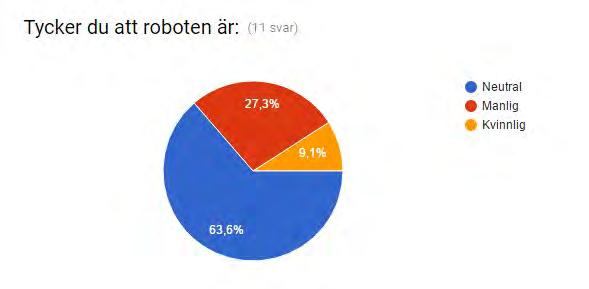
130 Appendix A Survey, Evaluation test 8


131 Hur upplevde du ögonfärgerna på roboten? den gröna ögonfärgen gjorde att han upplevdes vänlig Stimulerande. igen särskild reaktion. Neutrala A little bit scary bra Konstiga och ganska distraherande Trevliga bra att den bytte färg när jag ritade lampatiga Hur tolkade du färgernas innebörd? jag uppfattade det som att den blev glad den fick besök, därav den gröna fägren KOmmunikativa. Grön - kontakt, Blå - stand by tolkade de inte. Grön - roboten har förstått, Gul - roboten bearbetar informationen, Blå - roboten är i stand by I did not think about it vet ej Jag kunde inet tolka dem alls. Kanske blev dom blåa när den tittade på mina ögon? Lugnande att den registrerar något Hur är dina känslor för roboten efter experimentet? spännande Var det något särskilt du tänkte på i interaktionen med roboten? reagerade på att den följde mig Aningen långsam Ögonfärgen - att den ändrades tydliggjorde att jag fick kontakt när jag såg den i ögonen kändes inte riktigt som jag fick ögonkontakt med den. Nej ledsen Det var svårt att få kontakt med den Neutrala. inför dess funktionalitet är mina känslor positiva, inför roboten som sådan känner jag som inför min gräsklippare, den känsla man får inför ett nytt husdjur (besjälande) neutrala, intressant att delta men annars ingen speciell känsla. Har inga cute bra Liet förvirrande. neutralt, med en viss spänning för framtiden. Tycker om hen! 9
132 Är det något du känner man skulle kunna förbättra med interaktionen med roboten? Kanske skulle den kunna ha någon typ av ljudsignal för att underlätta kommunikationen ytterligare - framförallt om den ska lära sig mer komplexa saker (i fler steg) kanske inte skiftande ögonfärg och vridbart huvud är nog få en mer mänskligkänsla, ex en kropp til? Nej speak something vet ej Den borde ge mer ögonkontakt. Jag förstod inte vad den tittade på, och det störde interaktionen väldigt mycket. 10
133 Are you looking at me? Erik Andersson Filip Olsson Hanna Andréason Björn Holmstedt Filip Ström CONTENTS I Introduction 1 II Related Work 2 III Social behavior recognition 2 IV Human-Robot Interaction 3 IV-A Gesture recognition IV-B View-based object recognition V The project 4 V-A Ikaros V-B Theory V-B1 Multiple Degrees of Freedom 4 V-B2 Point Cloud Library (PCL). 4 V-B3 Iterative Closest Point (ICP) 4 V-B4 Sample Consensus - Initial Alignment algorithm (SAC- IA) VI Process 5 VII Solution 6 VIII Experiment 7 VIII-A Purpose VIII-B Method VIII-C Result VIII-D Discussion IX Result 8 X General Discussion 8 XI Acknowledgements 9 References 9 Abstract The human visual system can interpret the movement patterns of the head naturally, but it is a challenge to give a computer this ability. Robots are about to emigrate from the factory floor and into our homes. If these robots are to be seen more as partners rather than machines, the robots must be able to understand and interpret people. In addition to that they need to be able to interact and communicate in a human-compatible way. The ability to estimate the direction and the movement of the head will have an important role in succeeding to cover the gap between computers and humans in the future. The goal of this project was to, by using a Microsoft Kinect and the interface Ikaros, develop a robust system that can track the movement of a person s head and calculate the current head pose. The system will be used by a robot to estimate in which directions people are aiming their attention. The solution uses the Point Cloud Library to create pointclouds representing the face at various angles. By registering a template in the beginning of the process and then comparing this with the current point cloud the direction of the head can be calculated. The solution uses the ICP algorithm and a SAC-IA algorithm to track and guess the current location of the nose. We also wanted to study existing proposed solutions for head pose estimation and the cognitive aspect of the movement of the head. Therefore, this report briefly mention some different methods that can be used for real-time head pose estimation. It describes the importance of the movement of the head in human behavior analysis and also mention a theory regarding how humans are able to recognize different objects in a viewbased approach. Furthermore the report presents the problems that appeared during the project and it also provides a foundation for further development of the system. Index Terms Head pose estimation, Human behavior analysis, Point Cloud, ICP algorithm, SAC-IA algorithm. I. INTRODUCTION Head pose estimation is a critical component of human behavior analysis and an active research topic in the computer vision field. The ability to see the direction of a person s head conveys information that allows one to understand an important nonverbal form of communication and to catch the intentions of others nearby. The Human visual system is able to interpret the orientation of the head naturally, but it is a challenge to implement this ability into a computer. With the development of sociable robotic systems there comes a need to develop robust and automatic tools that can estimate the orientation of a human head from digital imagery. A head pose estimation tool is also required when developing tools for face recognition, gaze tracking and facial analysis [1]. There are a lot of different factors that affect the estimated result when building an optimal model for finding the direction of the head. Both the biological appearance like different facial
134 expressions and the presence of accessories like hats or glasses and the physical factors like camera distortion or projective geometry must be taken into consideration [2]. The head pose and gaze direction are often exploited in different Human-computer interaction- and Human-robot interaction applications. The mutual gaze and partial gaze awareness plays a role in for example video conferencing environments for remote groups of people. Preservation of gaze awareness and other non-verbal cues is a known challenge in the area and researchers tries to develop specialized systems to handle this kind of challenges[14]. Another area where the head pose is highly usable is in driver assistance systems where the recognizance of the driver awareness is an important prerequisite [15]. Most of the robotics existing today are largely used at the factory floor and not as much for social interaction with humans. The interests for the developing robots that can interact with us humans more as a partner and not a machine is growing and the ability to estimate the head pose and gaze direction will have an important role for succeeding with covering the gap between computers and humans [2] [16]. II. RELATED WORK As mentioned in Chapter 1, head pose estimation is a prerequisite for the development of other problems regarding facial modeling and tracking. Over the last decades there have been an increasing interest in finding the best solution for the head pose estimation problem, specially in the Human-Robot interaction field. There is a large amount of different models that have been presented regarding the computer vision based head pose estimation problem and in this Chapter a few of them will be mentioned. Before the emergence of inexpensive RGB-D cameras the head pose estimation traditionally was performed on RGB images. The algorithms that uses RGB images to find the head pose is generally based on finding the localization of any special facial feature like the eyes (feature based algorithm) or analyzing data from the whole face-region and fit it to 3D templates (appearance based algorithm) [2, 3]. Some of these appearance based methods are based on learning the computer direct mapping from high dimensional eye images to the gaze coordinates in the low dimensional space using regression support vector machines, gaussian processes or localized linear regression [5, 6]. As mentioned the RGD-images are depending on the quality of the images and with this method the gaze coordinates can be extracted without the need of high-resolution images. The problem with these methods are the ability to handle the invariance of the head pose of the person that the eye appearance is depending on. Learning the model to handle due to an increased required time for the learning step and the difficulty to address a wide range of head poses in 2D images [6]. With the use of RGB-D cameras new methods have been developed using regression performance together with the given information from the depth images. By letting the system learn to map between real-valued parameters such as rotation angles and 3D head position and different depth features a good estimation of the head pose can be made. In [5], the proposed method is based on a random forest regression method that can be used for real time head pose estimation that also can use the information to determine facial features. Some of the presented works uses the given depth parameters in a combination with the 2D image data [7, 8]. Even though good result have been achieved when only using the depth information to determine the head pose, semantic information, such as the location of the eyes, is lost. In [1], they present a solution that is built on a combination of the 2D image data (to locate the eyes) and the depth parameters from a RGB-D camera. The nose is located with the Iterative Closest Point (ICP) algorithm (The ICP algorithm is described in Chapter V-B3 in this report). The ICP algorithm can be combined together with particle swarm optimization (PSO) to register a morphable face model. This morphable model can be used to continuously track the head pose. The method depends on an adaptive 3D matched filter that can detect the head before the morphable face model is registered. The idea of combining this two concepts in an effective manner showed significantly improved accuracy of the 3D head pose estimation [1]. III. SOCIAL BEHAVIOR RECOGNITION The ability to estimate the head pose is highly useful when it comes to, as mentioned, interpretation of non-verbal gestures. By tracking small head movements you can interpret an important meaning of different social cues as for example the focus of attention and different form of gesturing in a conversation. For us humans it is fundamental to be able to quickly and effortlessly interpret the different gestures as for example gaze recognition and movement of the head [2]. Our faces are a highly overlearned stimuli and we can recognize faces in a wide range of different views and poses [17]. The human face recognition system can handle extreme rotation-angles and even in the presence of some occlusions of the face we still manage to recognize that person [18]. The head pose estimation is strongly linked with the eye gaze recognition and physiological studies have showed that the prediction of gaze depends on both the eyes gaze direction and the head pose. The head pose in combination with the eye gaze direction gives a more accurate prediction of the gaze direction than the eye gaze direction would do by itself[32]. William Wollaston was an English chemist and physicist who claimed, nearly 200 year ago, that the underlying mechanism of gaze direction perception depends on the head orientation [19]. In On the Apparent Direction of Eyes in a Portrait he writes that our brains seem setup to predict the gaze direction in which the eyes are looking in relation to the face. He also writes that the prediction depends in which position the pupils are in relation to the whites of the eyes. In figure X
135 an animation of gaze illusion from Wollaston s original paper visualize how the head orientation influences the perceived direction of gaze [20]. In [21] the fenomeen is further studied and supported. Fig. 1. Wollaston Illusion. The animation visualize how the head orientation influences the perceived direction of gaze. Face A seems to be looking slightly to the right at the reader of the paper compared to face B that seems to be looking directly at the reader, although the eye regions are identical in both the illustrations. The difference, as clearly noted, are the orientation of the head. Source: The Science of Social Vision by Reginald B Adams Jr. Nalini Ambady, Ken Nakayama Shinsuke Shimojo, Oxford series in visual cognition s. 117 The human visual system is extremely sensitive to the directions of the gazes of others. Research shows that direct gaze depends heavily on the surrounding context and that gaze can modulate actions and act as an arousal cue. The social meaning of a gaze cue can for example imply to different social meanings if the person believes that it is being watched. In [22] studies investigate witch neural and cognitive systems that are involved in different kinds of social cues and also why these systems are activated [22]. The head pose is highly useful in inferring the focus of attention of a person. For example, in a dialogue, the head pose indicate who the current speaker in the conversation is and also indicate when it is time to switch roles, i.e. it is time for a earlier listener to start speaking instead [2]. In [23] the researchers found that there is a 77% probability that the person that is being looked at is the same as the one that is being spoken to in a four-person conversation, and that the probability that the person is being looked at is the same person that is being listened to is 88%. The result shows that the direct gaze is a fundamental social cue and that humans are highly accurate at detecting face-directed gaze of others during conversations [23]. There are many other ways to use the movement of head to imply to different social meanings in a conversation. By observing a person s head you can verify if the person agrees with you, are confused or expose your consideration or dissent. A normal way of showing that you understand what is being said is for example that you nod to the speaker during the conversation. Mutual gaze (two people focus their visual attention on each other) is often a sign of two persons having a discussion where both parts are clearly engaged. The mutual gaze can moreover be a way of showing awareness of another person s presence. A good example is the case where a pedestrian will stop before walking over a crossroad and wait for the potential driver to catch sight of her [2]. Quick head movements can be a sign of alarm or surprise and the gesture is usually hard to ignore for other observers even in the presence of auditory stimuli that comes from another direction [24]. By analyzing the head direction you can convey information about the environment and objects of interests. The reflex to look in the same direction as a person, who is shifting their head towards a specific direction during observation, develops in an early age and is used for filtration of the environment [25]. The head movements can be combined with other body movements to enhance the gesture, for example pointing with the hand and looking in a certain direction to indicate a specific localization. IV. HUMAN-ROBOT INTERACTION Most of the autonomous robots today are being targeted for applications that not is intended for social interaction with humans. Some robots are used for exploring planets, others are being used for sweeping minefields. There are robots that are being used for service applications as for example vacuuming floors and delivering hospital meals. This robots might interact in the same environment as people, but they are mostly treating them as obstacles [26]. Moreover the robots are mostly viewed as a kind of tool that can be controlled by us humans rather than a social being that we can interact and cooperate with. The number of applications for robots that are aimed to interact with people in a more social way, where the robot can be seen more like a robot-companion rather than a tool, is now rapidly growing [?].To build this future companions we need to give the robots skills to interact and communicate in human-compatible way. To accomplish natural human-robot interaction (HRI) in an everyday situation the robot needs to be able to understand and interpret different meaningful social cues in its current social environment [27]. The robots also need to be able to act in comprehensible way for us humans and it needs to be efficient and consistent [16]. This is a very complex task and in order to achieve a natural HRI the gestures of the whole body needs to be comprehended and automatically recognized [27]. A. Gesture recognition It is difficult to spot different gestures due to that the human motion sequences often have a dynamical variation in both duration and shape. The problem of recognizing human motion can be divided into two component: recognition and segmentation. The last mentioned, gesture segmentation, is used to extract the boundary points of a certain gesture, ie. start and end of the gesture. After the gesture segmentation is identified, the next step is to match the gesture against an existing predefined gesture in a library of different gestures. This step is called the gesture recognition [28].

136 B. View-based object recognition A core question in cognitive research is how humans learn, represent and recognize objects. We are able to effortlessly, in a fraction of a second, detect and classify objects from tens of thousands of different possible objects even if the variation of appearance are enormous [29]. If researchers can understand how humans do this, they maybe can find a way to enable computer systems to recognize objects with a performance similar to humans and thereby improve the way computers recognize objects [30]. Psychophysical and neurophysiological experiments have been made in the ambition to find the answer to the biological visual object recognition system. But we do not yet fully know how the brain solves the task. One theory that have been proposed by Prof. Dr. Heinrich H. Bülthoff is that recognition performance is affected and dependent of the viewpoint of the object. This means that the amount of viewchange between tested and learned object view is critically dependent of each other. Bulthoff believes that the object representations in our mind consist of snapshot-like views rather than a full 3D-reconstruction that the first theory in the research area claims (made by David Marr 1982) [30]. Moreover Bulthoff has investigated the effects of face recognition when it comes to a variation of viewpoints on the human face. The result of the psychophysic experiments strengthen Bulthoff s theory that the biological object recognition could be explained in terms of a view-based approach [17]. The solution to estimate the head pose in this project is built on that the system register a template of the face pointing in one direction that later on can be used to detect the face in a different viewpoint. This can be seen as a view-based computer vision system. The solution is further described in Chapter 7. A. Ikaros V. THE PROJECT The purpose of this project is to develop a head pose estimation program that can be used by the platform called Ikaros. The Ikaros system is developed to provide an open infrastructure for neuromodeling and robotics research. Ikaros contains a number of modules that can be connected to each other and has a plug-in architecture that allows new modules to easily be added to the system. A module consists of one or more inputs and outputs [9]. B. Theory 1) Multiple Degrees of Freedom: It is often assumed that the human head can be modeled as a disembodied rigid object when constructing a system for head pose estimation. This means that the head pose estimation applies to algorithms that identify a heads angular measurement from three different degrees that can be characterized by yaw, roll and pitch angles. In this project we will refer to these at the multiple Degrees of Freedom, DOF (see figure 1). Furthermore the ability to infer the orientation from the head is usually interpreted from the view of the camera instead of relative to the global coordinate system that in reality is a more correct way of rendering the head pose [2]. Fig. 2. The figure is describing the multiple Degrees of Freedom, DOF, that identify a heads angular measurement. The three different degrees that can be seen in the figure are pitch, roll and yaw. Source: https : // fig1 Fig 1 Orientation of the head in terms of pitch roll and yaw movements describing 2) Point Cloud Library (PCL): Point Cloud Library is a C++ library used stitching together point clouds and processing 3D geometry used in computer vision. A point cloud is a representation of an object or an environment made out of points in a 3D space. The information is collected using a 3D camera such as the Kinect. As seen in the picture below information is missing because the 3D camera can t see what s behind objects. To get a complete point cloud environment the user has to move the camera around the environment to fill up the unknown areas. The raw point cloud data shows a rough representation of the environment which the user can navigate through. To make it more realistic triangulation can be used (draw triangles between three points) and a mesh can be added to the triangles. After applying color to the mesh you ll have a realistic 3D model of the environment. This technique can be used in many different areas such as virtual reality, robotics and augmented reality. In virtual reality point clouds can be used to create real world environments that the user can navigate through. This can be done by ordinary 3D modelling as well but a lot of extra work has to be done to get sizes and proportions correct. Augmented reality applications can use this technique to map real world objects and make virtual objects interact with them. For example the user can put a virtual cup on a real world table, and the cup will stay on the same spot on the table and not fall through. In robotics point clouds can be used for navigation in unknown environments and without GPS. The robot maps the surroundings in real time and will be able to avoid obstacles and calculate the best route (optimal path planning). Figure 3 shows a point cloud made from a single 3D image. [10] 3) Iterative Closest Point (ICP): Iterative Closest Point is an algorithm used to calculate the difference between two point
 [11]. Fig. 3. A point cloud made from a single 3D image.")
 Pair each point of P1 (Point Cloud) and P2 (Point Cloud template).")
137 Another use case is to map the surrounding environment cropping together a number of point clouds into one 360 degrees point cloud. ICP finds where point clusters are the same and can then stitch together the different images into one larger image (See Figure 5) [11]. Fig. 3. A point cloud made from a single 3D image. The blank parts of the point cloud is where the sight was blocked by objects. Source: http : // cs236329/tutorials/icp.pdf clouds. ICP is calculated by using the following four steps: 1) Pair each point of P1 (Point Cloud) and P2 (Point Cloud template). 2) Compute motion that minimizes mean square error (MSE) between paired points. 3) Apply motion to P1 and update MSE. 4) Iterate until convergence. In each iteration a fitness score is calculated to see how well the two point clouds converge. If the two point clouds are identical the fitness score is zero. For a non-rigid transformation, it is rare to get a score of zero and a very low score is considered a match. In this project a fitness score under 5*10ˆ-5 is considered the threshold for an acceptable match. The calculations used to get the fitness score are shown in figure 4 below. p i is a single point in the template point cloud and q i is a single point in the actual live point cloud being analysed. All points are compared and a fitness score is generated showing how well the two images match. [33] Fig. 5. A rotated hat is gradually fitted to its template, giving the placement of the hat compared to the initial placement. Source: http : // cs236329/tutorials/icp.pdf 4) Sample Consensus - Initial Alignment algorithm (SAC- IA): The Sample Consensus - Initial Alignment algorithm (SAC-IA) is an algorithm that can be used instead of the ICP algorithm for bringing two 3D point cloud datasets into convergence. Sometimes the ICP algorithm might get trapped in a local minimum when it is trying to find the best match between two datasets. In these situations the SAC-IA can be used instead. The SAC-IA runs for a number of iterations to find the best transformation result between the sample points and randomly selected correspondence candidates. An error metric gives a value on the quality of the transformations and the best transformation result is stored and used to roughly align the points [31]. The SAC-IA is used in this project for finding the nose when the ICP algorithm is returning a fitness score that is above the given threshold. Fig. 4. The fitness score is calculated by comparing each point in both clouds with each other. Source: 7iu5BAAAQBAJ&pg PA 169&lpg=PA169&dq=icp+fitness+score+calculated&source=bl&ots=qXbSS2gtJU &sig=psnm7bw2e2zqjqbkopc7lmzcxz8&hl=sv&sa=x&ved=0ahukewjpw5ia 4sTRAhVD2CwKHYpLDI4Q6AEIYDAI#v=onepage&q=fitness%20score&f=false The Iterative Closest Point will be used in this project to calculate the direction of a person s head. The first step is to save a template of the face while looking straight forward. This template will later be used to compare with the robot s current view. Using the ICP algorithm will allow us to get the rotation, roll and jaw of the head. VI. PROCESS After discussing the problem and possible solutions we agreed to solve the problem by comparing the current image to a previously acquired template image of the same person facing forward. Using something similar to the Kabsch Algorithm[12], the optimal rotation matrix between the two images could be found and used to extract the rotation angle. This presented two problems. 1) We needed to gather the template image. 2) Since the image is likely to be somehow distorted (small differences in facial expressions, hair moving, etc.) ordinary matrix operations would not yield a sensible rotation matrix. In solving the first problem our first idea was to look at the point closest to the camera then save all matrix cells with the same x-value. With this information we replaced the x-values with the z-values for each matrix cell hopefully giving us the
 but wasn t accurate enough to be a viable option for us to continue with (see Figure 6). Fig. 6. Head facing straight forward, nose is showing. Fig. 7. Head facing sideways.")

138 profile of the head in the point closest to the camera. If the face then was looking forward we would be able to see the nose sticking out from the rest of the face. This approach worked (see Figure 7) but wasn t accurate enough to be a viable option for us to continue with (see Figure 6). Fig. 6. Head facing straight forward, nose is showing. Fig. 7. Head facing sideways. Nose is not visible. After we realized the first idea wasn t accurate enough we had to come up with a different approach. We still wanted to use the protrusive depth characteristics of the nose. If the head is facing forward the tip of the nose will most likely be the closest point. To validate if the closest point really is the nose we examined the areas below, left and right of the closest point to see if the difference in depth was equal to a nose s. This method works well but there are a few drawbacks. The difference in nose size between people forces us to broaden the interval of the distances and depths from the nose tip which increases the risk of false positive results. For example a protrusive cheekbone could be mistaken for a small nose. It is important to note that we cannot single out a rotation in a specific plane when deciding whether the pose is neutral, i.e. forward facing. If someone is looking straight forward with a forward pitch of the head, the forehead will be the closest point. This means the image will not be a candidate for a forward-looking template. Similarly, making a tilt in the roll plane results in the same. However, since we were only interested in a pose that was neutral along all planes, this was not an issue at the time. For the second problem, we are using Point Cloud Library[13] together with a method called Iterative Closest Point (ICP). The goal of the method is to find the optimal transformation given two subsets of points A and B. Where A either will be a predefined template or our previous frame and B will be the current frame. The computational strain of this method was yet to be determined at this stage, but we suspected to find more issues later. We thought a likely solution was to not test for all points, but for a subset of the most important points initially, and perform a full test once a match seemed likely. At this point of the process our algorithm could only handle one person at the same time. We prioritized a good result for one person and decided to add support for multiple persons simultaneously if given time. If the point cloud solution would have turned out not to be working we had a backup solution using eye tracking. We considered using the eyes positions together with the information obtained from the depth data from the Kinect to estimate the head pose. Eye tracking is already implemented in Ikaros so we created a simple module that uses data from the head tracking module found in Ikaros to possibly later implement in conjunction with our Kinect module. We would however prefer not to use the eye tracking module since it is very computationally demanding. So our preferred method going forward was to focus more on the depth data and only resort to the eye tracking if the Point Cloud solution would fail. During testing of our ICP solution we found that the algorithm worked well until we got a bad match. This resulted in the algorithm continuing giving bad matches and not correcting it self. Our first solution to this problem was to crop the template at extreme angles resulting in the template being able to follow the head pose for a longer duration e.i. enabling matching at wider angles. This did work but not as good as we hoped and the main problem persisted with the template not being able to find new matches after a bad match. Thus we needed something that could make a rough and fast estimate of the head pose and then we could resort to ICP to refine the result. This was solved by using the SAC-IA algorithm to make a estimated guess when the ICP fitness score is deemed too low. The combination of ICP and SAC-IA improved the estimations considerably but performance was still slow. Thus focus was shifted to try and improve the performance by decreasing the number of points used during the calculations but also tweaking the number of iterations used by the algorithms. We managed to decrease the points used in the calculations by downsampling both the template and the point cloud that the template is matched against. In addition to this we removed unnecessary points from the template by making it T-shaped. VII. SOLUTION The solution can be divided in 3 steps: 1) The depth image is analyzed and pixels containing the head is located. The pixels where the head is located is used in the next step. 2) In the following steps the image of the head is represented using a point cloud. To first find the position of the nose Sample Consensus - Initial Alignment is used with a general template which is a mix of different faces.
 Iterative Closest Point (ICP) is then used starting with the best SAC-IA match. If the ICP loop returns a value which indicates a bad match SAC-IA is used to find a better match again.")


139 This means that we test how well the generic template match hundreds of random positions in the image of the head to find the best match. 3) Iterative Closest Point (ICP) is then used starting with the best SAC-IA match. If the ICP loop returns a value which indicates a bad match SAC-IA is used to find a better match again. If the returned value from the ICP loop indicates a good match, the ICP loop continues to the next frame. The returned value contains how good the match is and the rotation of the head. A green template indicates that there is a good match between the two data sets as seen in Figure 8. When the match is below the accepted threshold the template turns red as seen in Figure 9. Fig. 9. A bad match generates a red template. A couple of parameters were tampered with to see which set of parameters gave the best result. Leaf size (resolution) was changed between 0,005 and 0,008. Number of iterations were changed between 5 and 25. For each changed parameter number of good guesses were counted and total time was measured. C. Result The result from the experiment is presented in Figure Fig. 8. A good match generates a green template. A. Purpose VIII. EXPERIMENT The purpose of this experiment was to evaluate which parameters are the most effective while matching a point cloud image with a template using iterative closest point. The parameters that will be tampered with are number of iterations and leaf size. Number of iterations is how many times ICP will iterate. Leaf size is the resolution when making an average point out of many points in a point cloud. The goal of this is to find the best parameters and decrease computational time. B. Method A video of a moving head was recorded showing point cloud data. Iterative closest point was used to compare a template of a face to the actual video footage. When a close match was found it triggered a counter called good match. Fig. 10. Graph showing results with leaf size 0,008. Good guesses per minute is shown based on number of iterations.


140 Fig. 11. Graph showing results with leaf size 0,005. Good guesses per minute is shown based on number of iterations. Fig. 13. Graph showing compute time with leaf size 0,005. Compute time is shown based on number of iterations. square template the algorithm can run faster. When using a faster algorithm one can allow it to make more calculation in the same amount of time as the slower algorithm, thus making the matching more accurate. When using T-template one could visually see better performance but there weren t any tests, other than the visual one, made for comparing T- template with a normal square template. The final algorithm uses kinect depth of field to create point clouds. By converting the data to point clouds algorithms like ICP and SAC-IA can be used to estimate the head position. When a signal for a positive match between template and image is given, it can be verified by examining the visual representation. This method is not exact but gives a good estimation of the performance. Jaw and pitch is often correct but at larger angles the measurement of roll is sometimes not correct. Fig. 12. Graph showing compute time with leaf size 0,005. Compute time is shown based on number of iterations. D. Discussion The most effective parameters to use are the ones which give the highest good guesses per minute. The best score is reached with 10 iterations and a leaf size of 0,008, which gives 31 good guesses per minute. 10 iterations seem to be the sweet spot in performance no matter the leaf size and a higher resolution results in better performance when comparing same amount of iterations but different resolution. IX. RESULT T-template was used because the entropy of a face is higher around the nose and eyes. By removing the less interesting points around the cheeks that were included in the default X. GENERAL DISCUSSION The given fitness score of the final algorithm depends partly on individual facial features and the decided fitness threshold value should probably be individually adjusted for a more correct evaluation of the fitness score. In this project a general fitness threshold value was decided and the fitness score should therefore only be seen as a general estimation of the matches. That is, a given fitness score above the threshold (considered a bad match) could for some people be considered an acceptable match and the other way around. Sometimes the match gives a fitness score that according to the decided fitness threshold is considered a good match even if the guessed value of the roll-parameter appears to be a bad guess. This means that the system sometimes determine a bad guess as an acceptable match and thereby gives an unreliable estimation of the position of the head.
Adding active and blended learning to an introductory mechanics course
 Adding active and blended learning to an introductory mechanics course Ulf Gran Chalmers, Physics Background Mechanics 1 for Engineering Physics and Engineering Mathematics (SP2/3, 7.5 hp) 200+ students
Preschool Kindergarten
 Preschool Kindergarten Objectives CCSS Reading: Foundational Skills RF.K.1.D: Recognize and name all upper- and lowercase letters of the alphabet. RF.K.3.A: Demonstrate basic knowledge of one-toone letter-sound
GeoGebra in a School Development Project Mathematics Education as a Learning System
 Karlstad GeoGebra in a School Development Project Mathematics Education as a Learning System Dé dag van GeoGebra Zaterdag 19 oktober 2013 GeoGebra Instituut Vlaanderen, Brussell 1 2 GeoGebra in a School
Beijer Electronics AB 2000, MA00336A, 2000-12
 Demonstration driver English Svenska Beijer Electronics AB 2000, MA00336A, 2000-12 Beijer Electronics AB reserves the right to change information in this manual without prior notice. All examples in this
6 th Grade English October 6-10, 2014
 6 th Grade English October 6-10, 2014 Understand the content and structure of a short story. Imagine an important event or challenge in the future. Plan, draft, revise and edit a short story. Writing Focus
Methods to increase work-related activities within the curricula. S Nyberg and Pr U Edlund KTH SoTL 2017
 Methods to increase work-related activities within the curricula S Nyberg and Pr U Edlund KTH SoTL 2017 Aim of the project Increase Work-related Learning Inspire theachers Motivate students Understanding
Isometries of the plane
 Isometries of the plane Mikael Forsberg August 23, 2011 Abstract Här följer del av ett dokument om Tesselering som jag skrivit för en annan kurs. Denna del handlar om isometrier och innehåller bevis för
Writing with context. Att skriva med sammanhang
 Writing with context Att skriva med sammanhang What makes a piece of writing easy and interesting to read? Discuss in pairs and write down one word (in English or Swedish) to express your opinion http://korta.nu/sust(answer
Swedish adaptation of ISO TC 211 Quality principles. Erik Stenborg
 Swedish adaptation of ISO TC 211 Quality principles The subject How to use international standards Linguistic differences Cultural differences Historical differences Conditions ISO 19100 series will become
Health café. Self help groups. Learning café. Focus on support to people with chronic diseases and their families
 Health café Resources Meeting places Live library Storytellers Self help groups Heart s house Volunteers Health coaches Learning café Recovery Health café project Focus on support to people with chronic
FORSKNINGSKOMMUNIKATION OCH PUBLICERINGS- MÖNSTER INOM UTBILDNINGSVETENSKAP
 FORSKNINGSKOMMUNIKATION OCH PUBLICERINGS- MÖNSTER INOM UTBILDNINGSVETENSKAP En studie av svensk utbildningsvetenskaplig forskning vid tre lärosäten VETENSKAPSRÅDETS RAPPORTSERIE 10:2010 Forskningskommunikation
CVUSD Online Education. Summer School 2010
 CVUSD Online Education Summer School 2010 A New Frontier for Education This is an exciting time for CVUSD First opportunity for the Online US History course and second time for the Online Health course
MO8004 VT What advice would you like to give to future course participants?
 MO8004 VT2017 Answer Count: 7 1. What was the best aspect of the course? What was the best aspect of the course? Improvement of fortran programming skill, gain some knowledge from several phenomenon, improvement
Kursutvärderare: IT-kansliet/Christina Waller. General opinions: 1. What is your general feeling about the course? Antal svar: 17 Medelvärde: 2.
 Kursvärdering - sammanställning Kurs: 2AD510 Objektorienterad programmering, 5p Antal reg: 75 Program: 2AD512 Objektorienterad programmering DV1, 4p Antal svar: 17 Period: Period 2 H04 Svarsfrekvens: 22%
Stiftelsen Allmänna Barnhuset KARLSTADS UNIVERSITET
 Stiftelsen Allmänna Barnhuset KARLSTADS UNIVERSITET National Swedish parental studies using the same methodology have been performed in 1980, 2000, 2006 and 2011 (current study). In 1980 and 2000 the studies
Module 1: Functions, Limits, Continuity
 Department of mathematics SF1625 Calculus 1 Year 2015/2016 Module 1: Functions, Limits, Continuity This module includes Chapter P and 1 from Calculus by Adams and Essex and is taught in three lectures,
Hållbar utveckling i kurser lå 16-17
 Hållbar utveckling i kurser lå 16-17 : Jag tillhör akademin / My position is in the School of Jag tillhör akademin / My position is in the School of Humaniora och medier / Humanities and Media Studies
FK Electrodynamics I
 FK8003 - Electrodynamics I Respondents: 18 Answer Count: 6 Answer Frequency: 33,33 % 5. Overall impression Overall I am satisfied with this course 4 3 (50,0%) Don't know 0 (0,0%) 6. Student contribution
Stad + Data = Makt. Kart/GIS-dag SamGIS Skåne 6 december 2017
 Smart@Helsingborg Stadsledningsförvaltningen Digitaliseringsavdelningen the World s most engaged citizens Stad + Data = Makt Kart/GIS-dag SamGIS Skåne 6 december 2017 Photo: Andreas Fernbrant Urbanisering
Make a speech. How to make the perfect speech. söndag 6 oktober 13
 Make a speech How to make the perfect speech FOPPA FOPPA Finding FOPPA Finding Organizing FOPPA Finding Organizing Phrasing FOPPA Finding Organizing Phrasing Preparing FOPPA Finding Organizing Phrasing
ASSESSMENT AND REMEDIATION FOR CHILDREN WITH SPECIAL EDUCATIONAL NEEDS:
 ASSESSMENT AND REMEDIATION FOR CHILDREN WITH SPECIAL EDUCATIONAL NEEDS: THE ROLE OF WORKING MEMORY, COMPLEX EXECUTIVE FUNCTION AND METACOGNITIVE STRATEGY TRAINING Avdelningen för psykologi Mittuniversitetet
Biblioteket.se. A library project, not a web project. Daniel Andersson. Biblioteket.se. New Communication Channels in Libraries Budapest Nov 19, 2007
 A library project, not a web project New Communication Channels in Libraries Budapest Nov 19, 2007 Daniel Andersson, daniel@biblioteket.se 1 Daniel Andersson Project manager and CDO at, Stockholm Public
Klicka här för att ändra format
 på 1 på Marianne Andrén General Manager marianne.andren@sandviken.se Sandbacka Park Högbovägen 45 SE 811 32 Sandviken Telephone: +46 26 24 21 33 Mobile: +46 70 230 67 41 www.isea.se 2 From the Off e project
Conversational Pedagogical Agents and Gender Annika Silvervarg, Agneta Gulz, Magnus Haake Linköping and Lund University
 Forskningsmetoder Utveckling av pedagogisk programvara Empiriska undersökningar i skolor Enkäter Intervjuer Observationer Beteendeloggar Dialogloggar Teorier om lärande och teknikanvändingi pedagogiska
Användning av Erasmus+ deltagarrapporter för uppföljning
 Användning av Erasmus+ deltagarrapporter för uppföljning Internationaliseringsdagarna 2016 2016-11-02 Anders Clarhäll Participant Report Form Identification of the Participant and General Information (Motivation)
Michael Q. Jones & Matt B. Pedersen University of Nevada Las Vegas
 Michael Q. Jones & Matt B. Pedersen University of Nevada Las Vegas The Distributed Application Debugger is a debugging tool for parallel programs Targets the MPI platform Runs remotley even on private
Understanding Innovation as an Approach to Increasing Customer Value in the Context of the Public Sector
 Thesis for the degree of Licentiate of Philosophy, Östersund 2014 Understanding Innovation as an Approach to Increasing Customer Value in the Context of the Public Sector Klas Palm Supervisors: Håkan Wiklund
Kursplan. EN1088 Engelsk språkdidaktik. 7,5 högskolepoäng, Grundnivå 1. English Language Learning and Teaching
 Kursplan EN1088 Engelsk språkdidaktik 7,5 högskolepoäng, Grundnivå 1 English Language Learning and Teaching 7.5 Higher Education Credits *), First Cycle Level 1 Mål Efter genomgången kurs ska studenten
FÖRBERED UNDERLAG FÖR BEDÖMNING SÅ HÄR
 FÖRBERED UNDERLAG FÖR BEDÖMNING SÅ HÄR Kontrollera vilka kurser du vill söka under utbytet. Fyll i Basis for nomination for exchange studies i samråd med din lärare. För att läraren ska kunna göra en korrekt
Isolda Purchase - EDI
 Isolda Purchase - EDI Document v 1.0 1 Table of Contents Table of Contents... 2 1 Introduction... 3 1.1 What is EDI?... 4 1.2 Sending and receiving documents... 4 1.3 File format... 4 1.3.1 XML (language
Kursplan. AB1029 Introduktion till Professionell kommunikation - mer än bara samtal. 7,5 högskolepoäng, Grundnivå 1
 Kursplan AB1029 Introduktion till Professionell kommunikation - mer än bara samtal 7,5 högskolepoäng, Grundnivå 1 Introduction to Professional Communication - more than just conversation 7.5 Higher Education
Kursplan. FÖ3032 Redovisning och styrning av internationellt verksamma företag. 15 högskolepoäng, Avancerad nivå 1
 Kursplan FÖ3032 Redovisning och styrning av internationellt verksamma företag 15 högskolepoäng, Avancerad nivå 1 Accounting and Control in Global Enterprises 15 Higher Education Credits *), Second Cycle
Workplan Food. Spring term 2016 Year 7. Name:
 Workplan Food Spring term 2016 Year 7 Name: During the time we work with this workplan you will also be getting some tests in English. You cannot practice for these tests. Compulsory o Read My Canadian
LARS. Ett e-bokningssystem för skoldatorer.
 LARS Ett e-bokningssystem för skoldatorer. Därför behöver vi LARS Boka dator i förväg. Underlätta för studenter att hitta ledig dator. Rapportera datorer som är sönder. Samordna med schemaläggarnas system,
Support Manual HoistLocatel Electronic Locks
 Support Manual HoistLocatel Electronic Locks 1. S70, Create a Terminating Card for Cards Terminating Card 2. Select the card you want to block, look among Card No. Then click on the single arrow pointing
http://marvel.com/games/play/31/create_your_own_superhero http://www.heromachine.com/
 Name: Year 9 w. 4-7 The leading comic book publisher, Marvel Comics, is starting a new comic, which it hopes will become as popular as its classics Spiderman, Superman and The Incredible Hulk. Your job
The Municipality of Ystad
 The Municipality of Ystad Coastal management in a local perspective TLC The Living Coast - Project seminar 26-28 nov Mona Ohlsson Project manager Climate and Environment The Municipality of Ystad Area:
Webbregistrering pa kurs och termin
 Webbregistrering pa kurs och termin 1. Du loggar in på www.kth.se via den personliga menyn Under fliken Kurser och under fliken Program finns på höger sida en länk till Studieöversiktssidan. På den sidan
MÅLSTYRNING OCH LÄRANDE: En problematisering av målstyrda graderade betyg
 MÅLSTYRNING OCH LÄRANDE: En problematisering av målstyrda graderade betyg Max Scheja Institutionen för pedagogik och didaktik Stockholms universitet E-post: max.scheja@edu.su.se Forskning om förståelse
Problem som kan uppkomma vid registrering av ansökan
 Problem som kan uppkomma vid registrering av ansökan Om du har problem med din ansökan och inte kommer vidare kan det bero på det som anges nedan - kolla gärna igenom detta i första hand. Problem vid registrering
3 rd October 2017
 3 rd October 2017 Failures of Scaffold False work Failures Form work Bursting Trench Support Failure Hoarding Failures Can be expensive and result in fatalities and serious injuries Cardiff
The Algerian Law of Association. Hotel Rivoli Casablanca October 22-23, 2009
 The Algerian Law of Association Hotel Rivoli Casablanca October 22-23, 2009 Introduction WHY the Associations? NGO s are indispensable to the very survival of societal progress Local, National or International
The cornerstone of Swedish disability policy is the principle that everyone is of equal value and has equal rights.
 Swedish disability policy -service and care for people with funcional impairments The cornerstone of Swedish disability policy is the principle that everyone is of equal value and has equal rights. The
Examensarbete Introduk)on - Slutsatser Anne Håkansson annehak@kth.se Studierektor Examensarbeten ICT-skolan, KTH
on - Slutsatser Anne Håkansson annehak@kth.se Studierektor Examensarbeten ICT-skolan, KTH") Examensarbete Introduk)on - Slutsatser Anne Håkansson annehak@kth.se Studierektor Examensarbeten ICT-skolan, KTH 2016 Anne Håkansson All rights reserved. Svårt Harmonisera -> Introduktion, delar: Fråga/
Examensarbete Introduk)on - Slutsatser Anne Håkansson annehak@kth.se Studierektor Examensarbeten ICT-skolan, KTH 2016 Anne Håkansson All rights reserved. Svårt Harmonisera -> Introduktion, delar: Fråga/
Measuring child participation in immunization registries: two national surveys, 2001
 Measuring child participation in immunization registries: two national surveys, 2001 Diana Bartlett Immunization Registry Support Branch National Immunization Program Objectives Describe the progress of
Kursplan. MT1051 3D CAD Grundläggande. 7,5 högskolepoäng, Grundnivå 1. 3D-CAD Basic Course
 Kursplan MT1051 3D CAD Grundläggande 7,5 högskolepoäng, Grundnivå 1 3D-CAD Basic Course 7.5 Higher Education Credits *), First Cycle Level 1 Mål Studenten ska efter avslutad kurs ha inhämtat grunderna
The Academic Career Path - choices and chances ULRIKKE VOSS
 The Academic Career Path - choices and chances ULRIKKE VOSS The Academic Path Professur söks i konkurrens 5llsvidareanställning D O K T O R S E X Postdoktor!dsbegränsad max 2 år enligt avtal Biträdande
International Baccalaureate. Rolf Öberg rolf.oberg@taby.se
 International Baccalaureate rolf.oberg@taby.se Open House 29 November 2011 International Baccalaureate Staff: Principal: Henrik Mattisson Head of programme: Mona Lisa Hein IB coordinator: Study councellor:
Goals for third cycle studies according to the Higher Education Ordinance of Sweden (Sw. "Högskoleförordningen")
") Goals for third cycle studies according to the Higher Education Ordinance of Sweden (Sw. "Högskoleförordningen") 1 1. Mål för doktorsexamen 1. Goals for doctoral exam Kunskap och förståelse visa brett
Goals for third cycle studies according to the Higher Education Ordinance of Sweden (Sw. "Högskoleförordningen") 1 1. Mål för doktorsexamen 1. Goals for doctoral exam Kunskap och förståelse visa brett
Kursplan. JP1040 Japanska III: Språkfärdighet. 15 högskolepoäng, Grundnivå 1. Japanese III: Language Proficiency
 Kursplan JP1040 Japanska III: Språkfärdighet 15 högskolepoäng, Grundnivå 1 Japanese III: Language Proficiency 15 Higher Education Credits *), First Cycle Level 1 Mål Efter avslutad kurs ska de studerande
The reception Unit Adjunkten - for newly arrived pupils
 The reception Unit Adjunkten - for newly arrived pupils Shortly on our work Number of received pupils: - 300 for school year 2014-2015 - 600 for school year 2015-2016 - 220 pupils aug-dec 2016 - ca. 45
The annual evaluation of the Individual Study Plan for PhD students at the Department of Biochemistry and Biophysics
 The annual evaluation of the Individual Study Plan for PhD students at the Department of Biochemistry and Biophysics Every year no later than January 31, the PhD student and her/his supervisor shall submit
Information technology Open Document Format for Office Applications (OpenDocument) v1.0 (ISO/IEC 26300:2006, IDT) SWEDISH STANDARDS INSTITUTE
 v1.0 (ISO/IEC 26300:2006, IDT) SWEDISH STANDARDS INSTITUTE") SVENSK STANDARD SS-ISO/IEC 26300:2008 Fastställd/Approved: 2008-06-17 Publicerad/Published: 2008-08-04 Utgåva/Edition: 1 Språk/Language: engelska/english ICS: 35.240.30 Information technology Open Document
SVENSK STANDARD SS-ISO/IEC 26300:2008 Fastställd/Approved: 2008-06-17 Publicerad/Published: 2008-08-04 Utgåva/Edition: 1 Språk/Language: engelska/english ICS: 35.240.30 Information technology Open Document
Senaste trenderna inom redovisning, rapportering och bolagsstyrning Lars-Olle Larsson, Swedfund International AB
 1 Senaste trenderna inom redovisning, rapportering och bolagsstyrning Lars-Olle Larsson, Swedfund International AB 2 PwC undersökning av börsföretag & statligt ägda företag Årlig undersökning av års- &
8 < x 1 + x 2 x 3 = 1, x 1 +2x 2 + x 4 = 0, x 1 +2x 3 + x 4 = 2. x 1 2x 12 1A är inverterbar, och bestäm i så fall dess invers.
 MÄLARDALENS HÖGSKOLA Akademin för utbildning, kultur och kommunikation Avdelningen för tillämpad matematik Examinator: Erik Darpö TENTAMEN I MATEMATIK MAA150 Vektoralgebra TEN1 Datum: 9januari2015 Skrivtid:
PEC: European Science Teacher: Scientific Knowledge, Linguistic Skills and Digital Media
 PEC: Fredagen den 22/9 2006, Forum För Ämnesdidaktik The aim of the meeting A presentation of the project PEC for the members of a research group Forum För Ämnesdidaktik at the University of Gävle. The
IMPROVING CONTINUING ENGINEEERING EDUCATION IN QUALITY MANAGEMENT THROUGH INSTITUTIONAL CO-OPERATION
 lennart.schon@tech.oru.se IMPROVING CONTINUING ENGINEEERING EDUCATION IN QUALITY MANAGEMENT THROUGH INSTITUTIONAL CO-OPERATION A SWEDISH CASE STUDY May 2004 Ingela Bäckström Görgen Edenhagen Lennart Schön
SWESIAQ Swedish Chapter of International Society of Indoor Air Quality and Climate
 Swedish Chapter of International Society of Indoor Air Quality and Climate Aneta Wierzbicka Swedish Chapter of International Society of Indoor Air Quality and Climate Independent and non-profit Swedish
Sri Lanka Association for Artificial Intelligence
 Sri Lanka Association for Artificial Intelligence First Sinhala Chatbot in action Budditha Hettige Department of Statistics and Computer Science, Faculty of Applied Science, University of Sri Jayewardenepura,
Viktig information för transmittrar med option /A1 Gold-Plated Diaphragm
 Viktig information för transmittrar med option /A1 Gold-Plated Diaphragm Guldplätering kan aldrig helt stoppa genomträngningen av vätgas, men den får processen att gå långsammare. En tjock guldplätering
EXTERNAL ASSESSMENT SAMPLE TASKS SWEDISH BREAKTHROUGH LSPSWEB/0Y09
 EXTENAL ASSESSENT SAPLE TASKS SWEDISH BEAKTHOUGH LSPSWEB/0Y09 Asset Languages External Assessment Sample Tasks Breakthrough Stage Listening and eading Swedish Contents Page Introduction 2 Listening Sample
Alla Tiders Kalmar län, Create the good society in Kalmar county Contributions from the Heritage Sector and the Time Travel method
 Alla Tiders Kalmar län, Create the good society in Kalmar county Contributions from the Heritage Sector and the Time Travel method Goal Bring back the experiences from the international work of Kalmar
The present situation on the application of ICT in precision agriculture in Sweden
 The present situation on the application of ICT in precision agriculture in Sweden Anna Rydberg & Johanna Olsson JTI Swedish Institute for Agricultural and Environmental Engineering Objective To investigate
2.1 Installation of driver using Internet Installation of driver from disk... 3
 &RQWHQW,QQHKnOO 0DQXDOÃ(QJOLVKÃ'HPRGULYHU )RUHZRUG Ã,QWURGXFWLRQ Ã,QVWDOOÃDQGÃXSGDWHÃGULYHU 2.1 Installation of driver using Internet... 3 2.2 Installation of driver from disk... 3 Ã&RQQHFWLQJÃWKHÃWHUPLQDOÃWRÃWKHÃ3/&ÃV\VWHP
Swedish framework for qualification www.seqf.se
 Swedish framework for qualification www.seqf.se Swedish engineering companies Qualification project leader Proposal - a model to include the qualifications outside of the public education system to the
DVA336 (Parallella system, H15, Västerås, 24053)
") DVA336 (Parallella system, H15, Västerås, 24053) Respondents: 28 Answer Count: 9 Answer Frequency: 32,14 % Teaching methods The teaching methods in the course, that is their practical implementation and
DVA336 (Parallella system, H15, Västerås, 24053) Respondents: 28 Answer Count: 9 Answer Frequency: 32,14 % Teaching methods The teaching methods in the course, that is their practical implementation and
RUP är en omfattande process, ett processramverk. RUP bör införas stegvis. RUP måste anpassas. till organisationen till projektet
 RUP är en omfattande process, ett processramverk RUP bör införas stegvis RUP måste anpassas till organisationen till projektet Volvo Information Technology 1 Även RUP har sina brister... Dåligt stöd för
Service och bemötande. Torbjörn Johansson, GAF Pär Magnusson, Öjestrand GC
 Service och bemötande Torbjörn Johansson, GAF Pär Magnusson, Öjestrand GC Vad är service? Åsikter? Service är något vi upplever i vårt möte med butikssäljaren, med kundserviceavdelningen, med företagets
Flervariabel Analys för Civilingenjörsutbildning i datateknik
 Flervariabel Analys för Civilingenjörsutbildning i datateknik Henrik Shahgholian KTH Royal Inst. of Tech. 2 / 9 Utbildningens mål Gällande matematik: Visa grundliga kunskaper i matematik. Härmed förstås
Utbytesprogrammet Linneaus-Palme University of Fort Hare (Faculty of Education) och Umeå Universitet (Pedagogiska institutionen)
 och Umeå Universitet (Pedagogiska institutionen)") Utbytesprogrammet Linneaus-Palme University of Fort Hare (Faculty of Education) och Umeå Universitet (Pedagogiska institutionen) Mårten Almerud Internationaliseringsansvarig Pedagogiska institutionen Umeå
Utbytesprogrammet Linneaus-Palme University of Fort Hare (Faculty of Education) och Umeå Universitet (Pedagogiska institutionen) Mårten Almerud Internationaliseringsansvarig Pedagogiska institutionen Umeå
Second handbook of research on mathematics teaching and learning (NCTM)
") Second handbook of research on mathematics teaching and learning (NCTM) The effects of classroom mathematics teaching on students learning. (Hiebert & Grouws, 2007) Inledande observationer Undervisningens
Second handbook of research on mathematics teaching and learning (NCTM) The effects of classroom mathematics teaching on students learning. (Hiebert & Grouws, 2007) Inledande observationer Undervisningens
Webbreg öppen: 26/ /
 Webbregistrering pa kurs, period 2 HT 2015. Webbreg öppen: 26/10 2015 5/11 2015 1. Du loggar in på www.kth.se via den personliga menyn Under fliken Kurser och under fliken Program finns på höger sida en
Innovation in the health sector through public procurement and regulation
 Innovation in the health sector through public procurement and regulation MONA TRUELSEN & ARVID LØKEN 1 14/11/2013 Copyright Nordic Innovation 2011. All rights reserved. Nordic Innovation An institution
Projektmodell med kunskapshantering anpassad för Svenska Mässan Koncernen
 Examensarbete Projektmodell med kunskapshantering anpassad för Svenska Mässan Koncernen Malin Carlström, Sandra Mårtensson 2010-05-21 Ämne: Informationslogistik Nivå: Kandidat Kurskod: 2IL00E Projektmodell
Module 6: Integrals and applications
 Department of Mathematics SF65 Calculus Year 5/6 Module 6: Integrals and applications Sections 6. and 6.5 and Chapter 7 in Calculus by Adams and Essex. Three lectures, two tutorials and one seminar. Important
FANNY AHLFORS AUTHORIZED ACCOUNTING CONSULTANT,
 FANNY AHLFORS AUTHORIZED ACCOUNTING CONSULTANT, SWEDEN HOW TO CREATE BLOG CONTENT www.pwc.se How to create blog content Fanny Ahlfors Authorized Accounting Consultant 5 Inbound Methodology Attract Convert
BOENDEFORMENS BETYDELSE FÖR ASYLSÖKANDES INTEGRATION Lina Sandström
 BOENDEFORMENS BETYDELSE FÖR ASYLSÖKANDES INTEGRATION Lina Sandström Frågeställningar Kan asylprocessen förstås som en integrationsprocess? Hur fungerar i sådana fall denna process? Skiljer sig asylprocessen
Materialplanering och styrning på grundnivå. 7,5 högskolepoäng
 Materialplanering och styrning på grundnivå Provmoment: Ladokkod: Tentamen ges för: Skriftlig tentamen TI6612 Af3-Ma, Al3, Log3,IBE3 7,5 högskolepoäng Namn: (Ifylles av student) Personnummer: (Ifylles
Adjunkt / Lecturer Lektor / Senior Lecturer Docent eller professor / Associate Professor (Sw. docent) or Professor
 or Professor") Denna enkät syftar till att ge en bild av lärares arbete med hållbar utveckling i Högskolan Dalarnas utbildning på grundnivå och avancerad nivå. Den vänder sig till dig som varit eller kommer att vara
Denna enkät syftar till att ge en bild av lärares arbete med hållbar utveckling i Högskolan Dalarnas utbildning på grundnivå och avancerad nivå. Den vänder sig till dig som varit eller kommer att vara
Helping people learn. Martyn Sloman Carmel Kostos
 Helping people learn Martyn Sloman Chartered Institute of Personnel and Development Carmel Kostos Zest for Learning i d k/ t ti www.cipd.co.uk/presentations www.cipd.co.uk/helpingpeoplelearn Some propositions
Kursplan. FR1050 Franska: Skriftlig språkfärdighet I. 7,5 högskolepoäng, Grundnivå 1. French Written Proficiency I
 Kursplan FR1050 Franska: Skriftlig språkfärdighet I 7,5 högskolepoäng, Grundnivå 1 French Written Proficiency I 7.5 Higher Education Credits *), First Cycle Level 1 Mål Kursen syftar till att utveckla
Evaluation Ny Nordisk Mat II Appendix 1. Questionnaire evaluation Ny Nordisk Mat II
 Evaluation Ny Nordisk Mat II Appendix 1. Questionnaire evaluation Ny Nordisk Mat II English version A. About the Program in General We will now ask some questions about your relationship to the program
Collaborative Product Development:
 Collaborative Product Development: a Purchasing Strategy for Small Industrialized House-building Companies Opponent: Erik Sandberg, LiU Institutionen för ekonomisk och industriell utveckling Vad är egentligen
Questionnaire for visa applicants Appendix A
 Questionnaire for visa applicants Appendix A Business Conference visit 1 Personal particulars Surname Date of birth (yr, mth, day) Given names (in full) 2 Your stay in Sweden A. Who took the initiative
School of Management and Economics Reg. No. EHV 2008/220/514 COURSE SYLLABUS. Fundamentals of Business Administration: Management Accounting
 School of Management and Economics Reg. No. EHV 2008/220/514 COURSE SYLLABUS Fundamentals of Business Administration: Management Accounting Course Code FE3001 Date of decision 2008-06-16 Decision-making
INSTALLATION INSTRUCTIONS
 INSTALLATION - REEIVER INSTALLATION INSTRUTIONS RT0 RF WIRELESS ROOM THERMOSTAT AND REEIVER MOUNTING OF WALL MOUTING PLATE - Unscrew the screws under the - Pack contains... Installation - Receiver... Mounting
Språkutvecklande arbetssätt i en ämnesövergripande värld.
 Språkutvecklande arbetssätt i en ämnesövergripande värld. Pernilla Malmgren Ma/NO/Teknik/ Eng Anna Werner SO/ SV/ SvA/ Eng Paradisskolan Trollhättan Ca 450 elever F-9 Undervisning på engelska: English
The Swedish National Patient Overview (NPO)
") The Swedish National Patient Overview (NPO) Background and status 2009 Tieto Corporation Christer Bergh Manager of Healthcare Sweden Tieto, Healthcare & Welfare christer.bergh@tieto.com Agenda Background
The Swedish National Patient Overview (NPO) Background and status 2009 Tieto Corporation Christer Bergh Manager of Healthcare Sweden Tieto, Healthcare & Welfare christer.bergh@tieto.com Agenda Background
JSL Socialstyrelsen. Migrationsverket. Information till dig som är gift med ett barn
 JSL Socialstyrelsen Migrationsverket Information till dig som är gift med ett barn Barnäktenskap är förbjudet i Sverige I Sverige är det förbjudet att gifta sig med någon under 18 år. Det finns många anledningar
Syns du, finns du? Examensarbete 15 hp kandidatnivå Medie- och kommunikationsvetenskap
 Examensarbete 15 hp kandidatnivå Medie- och kommunikationsvetenskap Syns du, finns du? - En studie över användningen av SEO, PPC och sociala medier som strategiska kommunikationsverktyg i svenska företag
What will teachers do with SF?
 What will teachers do with SF? Mikael Thunblom Martin Larsson Martin Larsson Mikael Thunblom Martin Larsson Mikael Thunblom Mikael Thunblom The Principle The Teachers Mikael Thunblom The Swedish
D3.4 Documentation of Training no 1 including input for D3.5 Evaluation Report. Sweden
 D3.4 Documentation of Training no 1 including input for D3.5 Evaluation Report Sweden Transparense project This document has been conducted within the framework of project Transparense Increasing Transparency
State Examinations Commission
 State Examinations Commission Marking schemes published by the State Examinations Commission are not intended to be standalone documents. They are an essential resource for examiners who receive training
Why WE care? Anders Lundberg Fire Protection Engineer The Unit for Fire Protection & Flammables Swedish Civil Contingencies Agency
 Why WE care? Anders Lundberg Fire Protection Engineer The Unit for Fire Protection & Flammables Swedish Civil Contingencies Agency Assignment Assignment from the Ministry of Defence MSB shall, in collaboration
FOI MEMO. Jonas Hallberg FOI Memo 5253
 Projekt/Project Security culture and information technology Projektnummer/Project no Kund/Customer B34103 MSB Sidnr/Page no 1 (5) Handläggare/Our reference Datum/Date Jonas Hallberg 2015-01-21 FOI Memo
Kursplan. NA3009 Ekonomi och ledarskap. 7,5 högskolepoäng, Avancerad nivå 1. Economics of Leadership
 Kursplan NA3009 Ekonomi och ledarskap 7,5 högskolepoäng, Avancerad nivå 1 Economics of Leadership 7.5 Higher Education Credits *), Second Cycle Level 1 Mål Studenterna skall efter genomgången kurs: kunna
Schenker Privpak AB Telefon VAT Nr. SE Schenker ABs ansvarsbestämmelser, identiska med Box 905 Faxnr Säte: Borås
 Schenker Privpak AB Interface documentation for web service packageservices.asmx 2012-09-01 Version: 1.0.0 Doc. no.: I04304b Sida 2 av 7 Revision history Datum Version Sign. Kommentar 2012-09-01 1.0.0
Boiler with heatpump / Värmepumpsberedare
 Boiler with heatpump / Värmepumpsberedare QUICK START GUIDE / SNABBSTART GUIDE More information and instruction videos on our homepage www.indol.se Mer information och instruktionsvideos på vår hemsida
Affärsmodellernas förändring inom handeln
 Centrum för handelsforskning vid Lunds universitet Affärsmodellernas förändring inom handeln PROFESSOR ULF JOHANSSON, EKONOMIHÖGSKOLAN VID LUNDS UNIVERSITET Centrum för handelsforskning vid Lunds universitet