CBA of environmental projects within hydropower
|
|
|
- Andreas Johansson
- för 6 år sedan
- Visningar:
Transkript


1 EXAMENSARBETE INOM ENERGI OCH MILJÖ, AVANCERAD NIVÅ, 30 HP STOCKHOLM, SVERIGE 2018 CBA of environmental projects within hydropower JULIA LINDBERG SARAH HAGMAN KTH SKOLAN FÖR INDUSTRIELL TEKNIK OCH MANAGEMENT
2

3 Master of Science Thesis EGI CBA of environmental projects within hydropower Approved Date Julia Lindberg Sarah Hagman Examiner Professor Björn Palm Commissioner Fortum Sverige AB Supervisor Professor Anders Wörman Contact persons Hans Bjerhag and Birgitta Adell
4 Abstract Hydropower is a fundamental pillar in the Swedish energy system and accounts for a large part of the Swedish electricity production. The regulation power is also essential for balancing the grid load. Fortum is one of the leading energy companies within hydropower and Klarälven is a river with high importance, where Fortum owns and operates nine powerplants. These power plants constitute a barrier for the wild salmonids in Klarälven, which need to migrate upstream to reach their spawning area. Since the 1930s, the spawning salmonids have been trapped and transported upstream by lorry. After the spawning period, the smolts and kelts, i.e. the juvenile and spawned salmonids, have to migrate downstream. Due to the lack of fishways, they are forced to pass the eight remaining power plants. This, together with predation, entails a high mortality rate. Two independently performed studies indicates on survival rates of 16 % and 30 %. To stabilize the wild salmonid population, the downstream survival must increase, and a proposed solution is to implement a downstream trap-and-transport solution. This trap implementation could be a step towards the environmental adaptation of hydropower and a part of the action plan proposed in June 2016, during the Agreement on Swedish energy policy. To find the most cost-beneficial environmental measure, a socio-economic assessment method can be used. A Cost-Benefit Analysis (CBA) is a commonly used socio-economic method, which evaluates the benefits and costs during the entire project lifetime. Energiforsk has, within the project FRAM-KLIV, developed a CBA tool that aims to simplify the socio-economic evaluation. The purpose of this thesis was to investigate whether the CBA tool can be used in future permit processes to prioritize between different project proposals to find the most beneficial environmental improvements. In order to evaluate the tool, it was to be applied on the trap-andtransport project in Edsforsen to evaluate the possibility of a socio-economic profitability. Also, the concepts and theory behind CBA was to be analysed and the suitability of translating environmental consequences into monetary values was to be evaluated. In the analysis of Edsforsen, 13 scenarios were developed. The first scenario served as a basis for the other scenarios, which were created as a sensitivity analysis. The result of the CBA showed a large socio-economic benefit and the most important parameter was identified as people s willingness to pay for an increase of the wild salmonid stock in Klarälven. In the CBA, this parameter had a high uncertainty, as it was based on a survey performed for another project in another part of Sweden. It was found that in order for the socio-economic result to be positive, all households in Sweden must be willing to pay at least 35 SEK. As a complement to the CBA result, an evaluation regarding the marginal cost per fish was performed and an interval of SEK per smolt was obtained. However, the calculations were based on several uncertainties and the interval should therefore be interpreted as a guideline rather than a precise result. It was concluded that in situations when a socio-economic analysis is required, and when it is possible to express consequences in monetary values, the method of CBA is appropriate. It is also a suitable methodology for evaluations of large projects, as it provides a comprehensible overview of the costs and the benefits. Despite the criticism directed towards CBA regarding uncertainties and its anthropogenic perspective, it could be concluded that using CBA as a socio-economic assessment method provides a perspicuous and quantitative result. Thus, the usage of CBA in prioritization processes of different environmental measures can be highly useful. Energiforsk s CBA tool provides a framework with guidelines that can be highly useful and accelerate the analysis process. However, the performance of the tool version used in this thesis was not fully satisfactory due to a few malfunctions. The tool is still under development and it is likely that these errors will be adjusted in future versions. If the malfunctions in the tool would be adjusted, it could become useful for authorities, companies and other actors that wants to evaluate hydropower related environmental measures or when prioritizing between different project proposals to find the most beneficial environmental improvements in future permit processes.
5
6 Sammanfattning Vattenkraften är en grundläggande pelare i det svenska energisystemet och står för en stor andel av den svenska elproduktionen på årsbasis. Vattenkraften har även hög betydelse för det svenska nätets balanseringsförmåga. Fortum är ett av de ledande energibolagen inom vattenkraft i Sverige och en viktig älv för dess kraftproduktion är Klarälven. Denna älv är dessutom fundamental för Klarälvslaxen och Klarälvsöringen och dess nödvändiga lekvandring. Under naturliga förhållanden ska den lekmogna laxen vandra uppströms Klarälven, men denna vandring försvåras av vattenkraftverken. Sedan 1930-talet har laxen transporterats uppströms Klarälven med lastbil för att nå sina lekområden, men när smolten och kelten ska vandra nedåt för att nå Vänern på nytt måste den passera de resterande åtta vattenkraftverken, vilket tillsammans med predation resulterar i en hög dödlighet. Två oberoende studier indikerar en överlevnad på 16 % respektive 30 %. För att stabilisera det vilda laxbeståndet föreslås en uppfångsanordning med nedströmstransport, där fisken fångas upp i en fälla och transporteras nedströms med lastbil. I juni 2016 beslutades det genom Energiöverenskommelsen att vattenkraften ska miljöanpassas och ett genomförande av en sådan fälla skulle möjligen kunna vara en sådan miljöanpassning. För att finna de mest lönsamma miljöanpassningarna inom vattenkraften bör samhällsekonomiska lönsamhetsbedömningar genomföras. En kostnadsnyttoanalys (CBA) är sådan bedömningsmetod där kostnader och nyttor genererade under projektets livstid ställs mot varandra. Genom projektet FRAM-KLIV har Energiforsk varit med och tagit fram ett CBA-verktyg som ska underlätta genomförandet av en sådan beräkningsanalys. CBA-verktyget användes som ram i det här examensarbetet där en kostnadsnyttoanalys gällande laxens förbättrade nedströmspassage genomfördes och utvärderades. Syftet med detta examensarbete har varit att undersöka huruvida detta CBAverktyg skulle kunna användas i framtida prioriteringar under tillståndsprocesser för att hitta de mest lönsamma miljöanpassningarna. Dessutom skulle bakomliggande koncept och teori analyseras. Tillika skulle en utvärdering gällande lämpligheten i att värdera miljövärden i monetära termer utföras. I arbetet utformades totalt tretton scenarier, varav det första ansågs som grundscenariot och utgjorde basen för de övriga tolv, vilka skapades för att identifiera de mest kritiska parametrarna genom en känslighetsanalys. Kostnadsnyttoanalysens erhållna resultat tydde på en stor samhällsekonomisk lönsamhet och den mest kritiska parametern identifierades som människors betalningsvilja för en ökad vildlaxpopulation i Klarälven. Osäkerheten kring denna parameter var stor då den baserats på en annan projektundersökning i en annan del av landet. För att erhålla ett positivt samhällsekonomiskt resultat visade denna undersökning att det måste finnas en betalningsvilja på minst 35 kr per hushåll i Sverige. Som ett komplement till resultatet utfördes en beräkning gällande hur mycket varje smolt skulle behöva vara värd för att den samhällsekonomiska nyttan ska vara lika stor som kostnaden. Beräkningen gav ett intervall mellan 50 och 580 kr, men då använd data innehöll stora osäkerheter bör resultatet ses mer som en riktlinje och inte ett exakt resultat. En slutsats som kunde dras var att det anses lämpligt att uttrycka miljövärden i monetära värden när en samhällsekonomisk analys är nödvändig. CBA som metod anses också vara lämplig och användbar när större projekt ska analyseras eftersom den ger en bred bild över fördelningen mellan kostnader och nyttor. Metoden förser dessutom användaren med ett lättolkat och överskådligt resultat och därav skulle CBA som metod vara lämplig gällande prioritering av miljönyttor. Energiforsks CBA-verktyg kan underlätta processen i och med att det ger användaren en ram med riktlinjer för hur beräkningsprocessen ska gå till. Verktygsversionen som användes i detta examensarbete uppfyllde dock inte full tillfredsställelse vad gällde dess funktionalitet. Verktyget är visserligen fortfarande under utveckling och det är möjligt att dessa funktionsfel kommer att justeras i framtida versioner. Om dessa justeringar sker kan verktyget komma att bli fullt funktionsdugligt och vara användbart för myndigheter, företag och andra aktörer som vill utvärdera vattenkraftrelaterade miljöåtgärder eller som prioriteringsverktyg gällande miljöförbättringar inom framtida tillståndsprocesser.
7
8 Preface This study was conducted as a degree project of 30 ECTS within the master s program in Sustainable Energy Engineering at the Royal Institute of Technology (KTH), in cooperation with Fortum Sverige AB. The thesis topic was initially proposed by Fortum Sverige AB and the thesis was conducted by Julia Lindberg and Sarah Hagman during the spring of The thesis has been approved for publication by Hans Bjerhag at Fortum Sverige AB. We would like to express our utmost gratitude to our supervisors at Fortum, Birgitta Adell and Hans Bjerhag, for their warm support and guidance throughout the spring. We also want to express our gratitude to the employees at Fortum Sverige AB, whom we conducted interviews and meetings with, which helped us broaden our knowledge and enhanced our understanding of the topic. We immediately felt welcome and included at Fortum Sverige AB and we have had a very rewarding and educative spring. We also want to thank Professor Anders Wörman at KTH for taking on the responsibility of being our supervisor for this thesis. We hope that you, as a reader of this thesis, will receive a better understanding of how costs and benefits of hydropower related environmental measures can be evaluated and analysed through a socio-economic assessment method. We hope that you will find the topic just as intriguing as we did. Please enjoy! Best regards, Julia Lindberg and Sarah Hagman
9
10 Acronyms and abbreviations BAU - Business-As-Usual CAPEX - Capital Expenditures CBA - Cost-Benefit Analysis CEA - Cost-Effectiveness Analysis CIOE - Classical and Interval Open-Ended CPI - Consumer Price Index EIA - Environmental Impact Assessment EQS - Environmental Quality Standard ETS - Emission Trading System EU - European Union FRAM-KLIV - Framtagande av relevant och användaranpassad samhällsekonomisk modell för miljöåtgärder för kraft och liv i vatten GDP - Gross Domestic Product ha - hectare HMWB - Heavily Modified Water Body LCA - Life Cycle Analysis MCA - Multi-Criteria Analysis MSEK - Million Swedish Krona NPV - Net Present Value ns nedströms (downstream) NWB - Natural Water Body OPEX - Operating Expenditures RPM - Revealed Preference Method SEA - Strategic Environmental Assessment SPM - Strategic Preference Method TEV - Total Economic Value
11 VAT - Value-Added Tax VISS - Vatteninformationssystem Sverige WTA - Willingness -To-Accept WTP Willingness-To-Pay
12
13 Table of Contents Abstract... Sammanfattning... Preface... Acronyms and abbreviations... Table of Contents... List of figures... List of tables... 1 Introduction... 1 Background... 1 Purpose... 2 Delimitations... 2 Methodology... 2 Report structure Hydropower... 4 Power plant types Impoundment Diversion Pumped storage... 4 History of Hydropower... 5 Hydropower in Sweden... 5 Fortum Hydropower Edsforsen power plant Laws and regulations within hydropower... 8 EU Water Framework Directive... 8 Environmental code... 8 National strategy for measures within hydropower...10 The Agreement on Swedish energy policy...10 Modern environmental conditions Issues related to regulations Social and environmental impacts of hydropower...15 Primary level: Direct effects of the impoundment Barrier effects on migrating species Hydrology Water quality...17
14 4.1.4 Sediment transport and water and ice conditions...18 Secondary level: Physical changes and habitat structure Morphology Primary production...19 Third level: Effects on the aquatic and terrestrial fauna Benthos Fish Effects on terrestrial flora and fauna...21 System level effects...22 Social impacts Socio-economic assessment methods...24 CBA History of CBA Underlying theory Steps in a CBA Non-market goods and externalities Valuing non-market costs and benefits Discounting Advantages and disadvantages of CBA...33 Multi-Criteria Analysis (MCA) The MCA method Differences between CBA and MCA Comparison of strengths and weaknesses of CBA and MCA CBA tool...37 Problem definition...37 Purpose definition...38 Reference alternative...38 Identification and description of project...38 Identification of consequences Classification of consequences Allocation and actor analysis...40 Compilation of consequences The value of ecosystem services and the chain of value creation Quantification of ecological impacts Impacts on ecological status or potential and conservation status...42
15 Valuation of consequences Inflation, NPV and price prognoses Sensitivity analysis Costs of environmental measures Carbon credits The socio-economic discount rate Valuation of environmental improvements Taxes and subsidies Socio-economic valuation of the change of power production The valuation of impacts on the regulated hydropower Valuation of the impact of the emissions on the environment and climate...48 Distribution analysis, sensitivity analysis and conclusions Methodology...50 Scenario 1: Edsforsen Problem definition Purpose definition Reference alternative Identification and description of project Identification of consequences Compilation of consequences Valuation of consequences...57 Other scenarios Scenario 2: Funded by own capital with depreciation, accounting for an opportunity cost with compound interest Scenario 3: Funded by own capital with depreciation, accounting for an opportunity cost with an annual dividend Scenario 4: Funded by own capital with depreciation Scenario 5: Funded as a one-time investment with own capital Scenario 6: Increase of the standstill cost during construction by 40 % Scenario 7: 85 % of the cost covered by Vattenkraftens miljöfond Scenario 8: WTP based on Värmland Scenario 9: Doubled production loss Scenario 10: Lognormal distribution of the WTP Scenario 11: WTP based on Värmland and 85 % of the cost covered by Vattenkraftens miljöfond Scenario 12: Decrease of the discount rate...64
16 Scenario 13: Increase of the discount rate Result...66 Result of the CBA Scenario 1: Original scenario Scenario 2: Funded by own capital with depreciation, accounting for an opportunity cost with compound interest Scenario 3: Funded by own capital with depreciation, accounting for an opportunity cost with an annual dividend Scenario 4: Funded by own capital with depreciation Scenario 5: Funded as a one-time investment with own capital Scenario 6: Increase of the standstill cost during construction by 40 % Scenario 7: 85 % of the cost covered by Vattenkraftens miljöfond Scenario 8: WTP based on Värmland Scenario 9: Doubled production loss Scenario 10: Lognormal distribution of the WTP Scenario 11: WTP based on Värmland and 85 % of the cost covered by Vattenkraftens miljöfond Scenario 12: Decrease of the discount rate Scenario 13: Increase of the discount rate...86 The WTP limit of socio-economic profitability...88 Valuation of the fish Discussion...91 Evaluation of CBA result...91 Evaluation of the value of the fish...95 Evaluation of methodology Valuing non-market benefits Validity of the trap efficiency...98 Evaluation of CBA CBA tool CBA as a socio-economic method The fund solution Vattenkraftens miljöfond HMWB Conclusion Recommendations and future work Bibliography... Appendix A Scenario i
17 Appendix B Scenario xviii Appendix C Excel input data for scenario 1,2,3,6 and 7... xli Appendix D Valuation of smolt production... liii
18 List of figures Figure 1. The three levels of environmental issues related to hydropower. Modified after Petts (1984); Näslund et al. (2013) Figure 2. User and non-user value groups derived from the TEV of ecosystem services. Modified after Naturvårdsverket (2012) Figure 3. The normal, uniform, lognormal and triangular probability distribution (Energiforsk, 2017) Figure 4. The proposed formation of the single-β diverter at Edsforsen hydropower plant (Norconsult, 2017) Figure 5. The proposed diversion facility at Edsforsen hydropower plant (Norconsult, 2014). Downstream view Figure 6. The empirical probability distribution of the NPV for Scenario 1. The x-axis shows the simulated NPV in ksek and the y-axis represents the allocation density in fractions, N= Figure 7. Acceptability curve showing the probability of a positive result for Scenario 1. The x- axis represents the simulated NPV in ksek and the y-axis represents the chance of profitability Figure 8. The empirical probability distribution of the NPV for Scenario 2. The x-axis shows the simulated NPV in ksek and the y-axis represents the allocation density in fractions of N= Figure 9. Acceptability curve showing the probability of a positive result for Scenario 2. The x- axis represents the simulated NPV in ksek and the y-axis represents the chance of profitability Figure 10. The empirical probability distribution of the NPV for Scenario 3. The x-axis shows the simulated NPV in ksek and the y-axis represents the allocation density in fractions of N= Figure 11. Acceptability curve showing the probability of a positive result for Scenario 3. The x- axis represents the simulated NPV in ksek and the y-axis represents the chance of profitability Figure 12. The empirical probability distribution of the NPV for Scenario 4. The x-axis shows the simulated NPV in ksek and the y-axis represents the allocation density in fractions of N= Figure 13. Acceptability curve showing the probability of a positive result for Scenario 4. The x- axis represents the simulated NPV in ksek and the y-axis represents the chance of profitability Figure 14. The empirical probability distribution of the NPV for Scenario 5. The x-axis shows the simulated NPV in ksek and the y-axis represents the allocation density, N= Figure 15. Acceptability curve showing the probability of a positive result for Scenario 5. The x- axis represents the simulated NPV in ksek and the y-axis represents the chance of profitability Figure 16. The empirical probability distribution of the NPV for Scenario 4. The x-axis shows the simulated NPV in ksek and the y-axis represents the allocation density in fractions of N= Figure 17. Acceptability curve showing the probability of a positive result for Scenario 6. The x- axis represents the simulated NPV in ksek and the y-axis represents the chance of profitability Figure 18. The empirical probability distribution of the NPV for Scenario 7. The x-axis shows the simulated NPV in ksek and the y-axis represents the allocation density, N=
19 Figure 19. Acceptability curve showing the probability of a positive result for Scenario 7. The x- axis represents the simulated NPV in ksek and the y-axis represents the chance of profitability Figure 20. The empirical probability distribution of the NPV for Scenario 8. The x-axis shows the simulated NPV in ksek and the y-axis represents the allocation density in fractions of N= Figure 21. Acceptability curve showing the probability of a positive result for Scenario 8. The x- axis represents the simulated NPV in ksek and the y-axis represents the chance of profitability Figure 22. The empirical probability distribution of the NPV for Scenario 9. The x-axis shows the simulated NPV in ksek and the y-axis represents the allocation density in fractions of N= Figure 23. Acceptability curve showing the probability of a positive result for Scenario 9. The x- axis represents the simulated NPV in ksek and the y-axis represents the chance of profitability Figure 24. The empirical probability distribution of the NPV for Scenario 9. The x-axis shows the simulated NPV in ksek and the y-axis represents the allocation density in fractions of N= Figure 25. Acceptability curve showing the probability of a positive result for Scenario 10. The x- axis represents the simulated NPV in ksek and the y-axis represents the chance of profitability Figure 26. The empirical probability distribution of the NPV for Scenario 11. The x-axis shows the simulated NPV in ksek and the y-axis represents the allocation density in fractions of N= Figure 27. Acceptability curve showing the probability of a positive result for Scenario 11. The x- axis represents the simulated NPV in ksek and the y-axis represents the chance of profitability Figure 28. The empirical probability distribution of the NPV for Scenario 12. The x-axis shows the simulated NPV in ksek and the y-axis represents the allocation density in fractions of N= Figure 29. Acceptability curve showing the probability of a positive result for Scenario 12. The x- axis represents the simulated NPV in ksek and the y-axis represents the chance of profitability Figure 30. The empirical probability distribution of the NPV for Scenario 13. The x-axis shows the simulated NPV in ksek and the y-axis represents the allocation density in fractions of N= Figure 31. Acceptability curve showing the probability of a positive result for Scenario 13. The x- axis represents the simulated NPV in ksek and the y-axis represents the chance of profitability....87
20 List of tables Table 1. Median and mean and interval WTP in SEK. Modified after Håkansson (2007) Table 2. Summary of the different WTPs. Modified after Håkansson (2009) Table 3. The weighted original and corrected WTPs (SEK) Table 4. The total intervals and mean WTP for all Swedish households (SEK) Table 5. The total mean NPV for the project together with the NPV for the public and Fortum as well as the magnitude of the NPV that is derived from the CAPEX, OPEX and production loss Table 6. Result of the calculation of the cost per smolt for different habitat sizes and smolt survivals....89
21 1 Introduction This chapter describes the background, purpose, delimitations and report structure of the presented thesis. Background Hydropower accounts for the largest part of the Swedish electricity production on an annual basis and is a fundamental pillar in the Swedish energy systems. It provides a flexible electricity production to a competitive price, with load balancing capacity and close to zero Greenhouse Gas (GHG) emissions (Lindholm, 2017a). Fortum is one of the leading energy companies within the hydropower sector in Sweden, having a total installed capacity of MW (Fortum, 2018). One of the most important rivers for Fortum s hydropower production is Klarälven, where it operates a total of nine hydropower plants in cascade (Vattenkraft.info, 2018). Klarälven has a river stretch with favourable conditions for spawning between the eighth and ninth power plants, counting from Vänern. The eighth power plant is Edsforsen and the ninth is Höljes. The wild anadromous salmonid of Klarälven is a unique species, seen from a global perspective. During its spawning period, they must migrate upstream Klarälven to reach the river stretch between Edsforsen and Höljes power plant (Greenberg et. al, 2018). Since the 1930s, a trap-and-transport solution has been used to trap the wild salmonids downstream Forshaga power plant and transfer them upstream by truck before releasing them upstream of Edsforsen power plant (Fortum, 2017b). However, when the kelt and smolt, which are the definitions for spawned and juvenile salmonids, later are to migrate downstream, they are forced to pass the remaining eight power plants. Studies have shown that solely a small fraction of the migrating smolt survives the downstream passage, two studies indicated on a survival rate of 16 % (Norrgård et. al, 2013) respectively 30 % (Gustafsson et. Al, 2015). This have led to a reduction of the wild salmonid population. An improved wild salmonid population would have a great nature value and be highly beneficial for the biodiversity and there is thus a great wish of improving the migration possibility. The proposed solution that addresses this issue is a downstream trap-and-transport solution located at Edsforsen power plant. The trap aims to divert the kelts and smolts from the turbine intake and collect and transport them downstream to release them at the river mouth of Klarälven (Greenberg et al., 2017). In June 2016, the so-called Agreement on Swedish energy policy was established, and five out of the eight parliament parties agreed on updated long-term regulations for the Swedish energy supply. It was decided that Sweden should have a 100 % renewable electricity production by Two Swedish authorities, Energimyndigheten (Swedish Energy Agency) and Havs- och Vattenmyndigheten (Swedish Agency for Marine and Water Management), proposed a strategy aiming at adapting hydropower plants environmentally. It was suggested that the proposed adjustments should be allowed to cause a production reduction of maximum 2.3 % or 1.5 TWh/year, on a national basis (HaV, 2014). How the environmental measures will be distributed between and within different watersheds will be determined in an upcoming national priority plan (Vattenkraftens miljöfond, 2018). In order to prioritize between different environmental measures to find the most cost efficient and beneficial environmental improvements, different socio-economic assessment methods can 1
22 be used. Cost-Benefit Analysis (CBA) is a popular method that aims to quantitatively compare the benefits and drawbacks of a project by, to the furthest extent, express the consequences in the same unit (Hanley & Barbier, 2009). It evaluates investments, costs and returns of a project over time and can include both direct and indirect market and non-market goods as well as positive and negative externalities. The main objective of the method is to simplify the evaluation for decision-makers and enable a comparison possibility of benefits and costs (Roosen, 2014). Energiforsk has, within the project FRAM-KLIV, developed a CBA tool that aims to simplify socioeconomic profitability assessments of environmental projects within hydropower. It is based upon modern CBA theory and can be used to assess different scales of environmental measures. The tool is still under development but is designed for the purpose of being utilized within authorities and hydropower related industry in the future (Energiforsk, 2017). This thesis aimed to use the CBA tool from Energiforsk to perform an analysis on the trap-andtransport project in Edsforsen to discover whether or not it would be profitable from a socioeconomic perspective. The thesis also aims to investigate and discuss whether or not the CBA tool is convenient to use in future prioritization processes of environmental project proposals and if it is suitable to express environmental values in monetary values. Purpose The purpose of the thesis was to use the newly developed Cost-Benefit Analysis (CBA) tool from Energiforsk to perform a socio-economic analysis of a trap-and-transport project at Edsforsen hydropower plant. The tool was to be evaluated with regard to its potential and usefulness when prioritizing between different project proposals to find the most beneficial environmental improvements in future permit processes. In the evaluation, the concept and theory of CBA was to be described and compared to the supplementary method of Multi-Criteria Analysis (MCA). Another objective was to evaluate the suitability of translating environmental values into monetary values and subsequently apply them in a CBA. Delimitations The conducted CBA was limited to the river of Klarälven and the hydropower plant at Edsforsen. The CBA tool version used in this project was cba -verktyg -v41_tom_ , which was released on January 24, Hence, the analysis of the CBA tool may not apply to later released versions. The CBA was only compared to one other socio-economic assessment method, MCA, and due to time constraints, no project-specific surveys of the trap-and-transport solution in Edsforsen could be performed. Methodology The methodology used to assess the aims stated in the purpose was divided into different modules. Module 1: The purpose of the first part of the project was to gain insight and obtain an enhanced understanding of the topic and the CBA tool, to create a platform of knowledge for the upcoming analysis and evaluation. This module contained an extensive literature review covering topics such as the hydropower technology, environmental issues and regulations 2
23 related to hydropower and a background to the trap-and-transport project in Edsforsen as well as to MCA and CBA as methods. The module also included preparation and conduction of interviews and meetings with internal and external experts within different relevant fields. Module 2: The second module included the collection and calculation of data for the Edsforsen project, as well as the execution of the CBA and a compilation of the results. The most critical socio-economic and environmental factors for the analysis were identified and analysed. The module also included the computation and evaluation of the value of an increased smolt survival. Module 3: The third module comprised an analysis of the results from the CBA as well as an evaluation of the CBA tool, addressing its ability to analyse socio-economic profitability by comparing factors such as improved welfare and environmental benefits versus production reductions and economic losses. The benefits and drawbacks of the tool were identified and analysed, and the concept of CBA was evaluated and compared to the complementary method of MCA. Module 4: In the fourth module, the report was formatted and finalized. Report structure The literature review is presented in Chapter 2, 3, 4 and 5. The second chapter presents a background to hydropower, including a brief description of the technology, the history and a background to Fortum hydropower operations and Edsforsen hydropower plant. Chapter 3 describes the laws and regulations related to hydropower, such as the EU Water Framework Directive (WFD), the Environmental code, the national strategy for measures within hydropower, the Agreement on Swedish energy policy and modern environmental conditions. Chapter 4 provides an overview of the different levels of social and environmental impacts of hydropower and Chapter 5 describes the theory behind CBA together with its advantages and disadvantages and includes a brief summary of its history and application areas. Chapter 5 also includes a description of the basic theory of MCA and how it can be used in addition to or as a comparison to CBA. Chapter 6 describes how the tool is organized into different steps. In Chapter 7, the methodology of the conducted CBAs is described. Section 7.1 comprises a detailed description of the CBA steps specific for Edsforsen and describes how the data for the parameter inputs was collected. Section 7.2 describes the changes that were made from the original scenario when creating the new scenarios for the sensitivity analysis. Chapter 8 presents the result from the conducted CBAs, the result from the calculation of the WTP threshold for when the project becomes socio-economically profitable and the result from the calculation of the value of an increased smolt survival. Chapter 9 comprises a discussion of the results and an evaluation of the CBA tool and of CBA methodology. It also includes a discussion about the valuation of an increased smolt survival. Chapter 10 presents conclusions from the discussion and Chapter 11 provides recommendations and future work. 3
24 2 Hydropower Hydropower is an energy source that can be adjusted and regulated after the current demand and produce electricity when it is needed. There are a few different types of hydropower plants, but they all share the same working principle for how to generate electricity. The power plants take advantage of topographic height differences and use the falling water and the energy conservation principle to transform the energy. The kinetic energy from the falling water is transformed to mechanical energy in the turbine, which is followed by a transition to electrical energy in the generator. The head and the flow are the two crucial parameters affecting the amount of energy that can be extracted from the water (Wisconsin Valley Improvement Company (WVIC), 2018). Power plant types Hydropower plants exist in all different kinds of sizes ranging from micro-scale, with an installed capacity of only a few kw, to large-scale, with a capacity of hundreds of MW. There are essentially three different kinds of hydropower plants: impoundment, diversion and pumped storage plants (U.S. Department of Energy, 2018) Impoundment Impoundment or storage hydropower is globally the most common form of hydropower plant and allows for the water flow to be regulated and adapted to the current need of electricity. The water derives from rainfall and melting snow and is collected and stored in large reservoirs or dams during the spring, summer and fall. Thereafter, when the electricity demand increases in winter, the water is gradually released (Energikunskap, 2011). After it is released, it is led through a turbine. The falling water causes a rotation of the turbine and converts the kinetic energy to mechanical energy. There are different types of turbines and the most common ones for large-scale hydropower plants are Kaplan and Francis. An electrical generator is mounted on the same shaft as the turbine and generally spins with the same number of revolutions. This is the step where the mechanical energy is converted to electrical energy through electromagnetic induction (WVIC, 2018) Diversion Diversion plants, also known as run-of-river power plants, are often small-scale hydropower facilities. They are usually located in rivers where there is no possibility of constructing a dam. The water is led from the river through a channel and a turbine and is thereafter released downstream. The technology that is used for the energy conversion within the plant is the same as the one for conventional impoundment dams (Williams, 2012) Pumped storage Pumped storage is another way of taking advantage of level differences and falling water in order to extract energy. First, the water is pumped uphill from a low altitude reservoir to a reservoir located at a higher altitude. These reservoirs are used as storages and the water is pumped uphill when the demand of electricity is low. When there is an increase in the demand, the water is gradually released through a turbine and led to the low reservoir. The electricity 4
25 generation technology that is used in these power plants are the same as the one used in impoundment and diversion power plants (U.S Department of Energy, 2018). History of Hydropower Humans have utilized hydropower for thousands of years. The ancient Greeks used the mechanical power produced by water to grind grain. The technology spread to the rest of Europe during the medieval period and the usage of hydropower related technology increased. Hydropower was of high importance during the industrial revolution. There was a big breakthrough for hydroelectric power in 1831, when Michael Faraday invented the first electric generator. The generator was a fundamental piece for the modern hydropower generation. Engineers started to use generators to produce electricity in hydropower plants in 1878 and the usage of generators has ever since been growing constantly. Today, hydropower is one of the most important renewable energy sources used for electricity production (Aarre Maehlum, 2013) Hydropower in Sweden Hydropower is a fundamental pillar in the Swedish energy system. It hardly emits any GHGs and produces electricity to a competitive price. Sweden is a country that can produce a large amount of hydroelectric power due to its geographical conditions. About 80 % of the production is located in Norrland, in the northern part of Sweden. Furthermore, the hydropower provides a secure and balanced electricity production due to its regulation possibilities. It can be regulated both on a long term, where it can be stored in reservoirs, and on a short term, where it can be regulated quickly if there is an electricity shortage. The short-term regulation will become even more essential for the Swedish energy system in the future, when there will be an increased fraction of wind and solar power generation, which are both intermittent energy sources with a fluctuating electricity production. Today, no new hydropower plants are built in Sweden. The majority of the big power plants were built during the 1950 s, -60 s and -70 s. The investments within hydropower today are mainly related to modernization, improved efficiencies, dam safety and improving the environmental conditions (Lindholm, 2017a). There are about hydropower plants in Sweden today and the total installed capacity corresponds to approximately MW, the Swedish hydropower produce approximately 65 TWh during a year with normal water flow (Lindholm, 2017b). In 2016, the total Swedish electricity production corresponded to 152 TWh and the hydropower covered about 40 % of it. The entire Swedish consumption reached an amount of around 140 TWh and there was a net export of the Swedish electricity (Energimyndigheten, 2017). This indicates how important hydropower is for the Swedish electricity generation and how big of a role it plays in the work of increasing the share of renewables in the electricity production. Fortum Hydropower Fortum is a leading energy company that offers sustainable solutions within several sectors, such as electricity and heat generation. Its aim is to reduce the GHG emissions and work towards a more sustainable society. Hydropower is an essential part of Fortum s sustainable electricity production. Fortum owns a total of 139 power plants in Sweden and Finland, with a total installed capacity of MW. Sweden has the majority of the power plants and an installed 5
26 capacity of MW. In 2016, the produced electricity from hydropower corresponded to 20.7 TWh, which represented 28 % of Fortum s total power generation (Fortum, 2018) Edsforsen power plant Klarälven is one of the most important rivers for Fortum s hydropower generation. The river meanders through the eastern part of Norway into Sweden and has its outflow in lake Vänern. Klarälven is approximately 460 kilometres long, stretching from the eastern mountain range of Norway down to Vänern. Almost 300 kilometres of the river is located in Sweden. In Norway, the river is called Femundselva and Trysilelva. The total catchment area is km² and the main tributaries connected to Klarälven are Gårdsjöälven, Tjärnälven, Värån and Uvån. At the outlet to Vänern, the average water discharge is m³/s and the average high water discharge is 690 m³/s. There is a total of nine hydropower plants within the Swedish part of Klarälven and Fortum owns and operates all of them. The first eight power plants are located at Forshaga, Dejefors, Munkfors, Skymnäsforsen, Forshult, Krakerud, Skogaforsen and Edsforsen. These power plants are all in relative closeness to each other. Between the eighth power plant, Edsforsen, and the ninth, Höljes, there is an unregulated river stretch of 150 kilometres. During this meandering river stretch, the vertical drop is low, and the river bottom is easily eroded. Due to the mountain sides of the river, the river is entrenched. This is one of the few bonded meandering river stretches in the world, which is why it is classified as a geological site of national interest and is protected from further power plant construction. It is also an important spawning area for certain fish species, such as salmonids (Vattenkraft.info, 2018). The power plant that is the subject for this thesis is Edsforsen. Edsforsen was constructed in 1949 and is the eighth hydropower plant upstream Klarälven from the lake of Vänern in Värmland. It is a run-of-river power plant with a total power output of 12 MW. On average, the annual production is 49 GWh (Norconsult, 2014). The plant has two Kaplan turbines with a discharge capacity of 195 m³/s and six spillways (Greenberg et al., 2018). The head varies between 6 and 9 meters depending on upper water level and current flow. The water level at Edsforsen is regulated with regard to the level at Edebäck, located about two kilometres upstream the power plant. The retention and minimum water level at Edebäck is metres and metres, respectively. Hence, the water level has to be maintained within this limit. In Edsforsen, the retention water level is set to metres between April 11 and October 14 and metres during the rest of the year. The minimum water level is set to metres. During times when the power plant is using its maximum capacity together with its spillways, the water level often drops down to close to metres. This is usually the situation during the spring flood, since an increased flow increases the head loss down to the dam, thus the water level is lower at the power plant. During late fall and early winter, when the ice is setting, the desired water level is metres. This since issues with blocking ice plugs can appear, causing rapid changes in the water level. The inflow to the turbine intake is slightly oblique, which likely reduces the head losses. For future renovation planning, the possibility of directing the intake towards the main flow of the river should be investigated (Norconsult, 2014). According to data provided by Fortum, during the period of , the largest flow occurs during the spring and the maximum turbine discharge rate is in average exceeded during the period between April 30 and June 11. The average flow rate in May varies between 213 m³/s and 271 m³/s. The highest achieved flow rate at Edsforsen power plant during the 50 year period reached values of 950 m³/s. 6
27 Due to the distance of almost 150 kilometres between Edsforsen and the next power plant upstream Klarälven, Höljes, a large amount of drifting flotsam and debris is accumulated, which calls for an efficient dredging method. The trash is lifted up from the water at Edsforsen power plant and is thereafter transported away. The unregulated river stretch allows for areas with turbulent water, enhancing the cooling during winter time. Thus, there is apparent frazil icing issues around Edsforsen (Norconsult, 2014). 7
28 3 Laws and regulations within hydropower Hydropower has certain effects on the environment and ecosystems. Therefore, the operation of hydropower plants falls under several laws, regulations and directives on a national and international basis. The Swedish hydropower is facing a new upcoming environmental legislation, which is mainly based on the EU Water Framework Directive, the Environmental code (Miljöbalken), the national strategy for measures within hydropower and the Agreement on Swedish energy policy (Energiöverenskommelsen). EU Water Framework Directive The European Union (EU) has regulations related to hydropower that are assessed in the EU Water Framework Directive. It consists of different rules and regulations aiming at attaining good water quality levels in the European lakes, rivers and groundwaters. The directive was developed as a result of the increased water demand and need of large amounts of qualitative water in various sectors in Europe. The directive aims to protect all water bodies, ensure that the ecosystems work as they are supposed to, reduce the water pollution and make sure that both individuals and companies have a sustainable water usage (Eur-lex, 2017). The directive was applied in 2000 and forced the EU member countries to develop a national plan on how to integrate these regulations in their laws by December 22, Eur-lex (2017) summarized the framework, which includes the following key points: Identification of river basins and catchments. Ensuring that authorities manage these basins in order to fulfil the EU rules. Analyse and monitor the status and characteristics of the river basins. Register protected water basins that need special attention, such as basins used for drinking water. Conducting and implementing management plans in order to protect the water. Ensuring that the usage of water is cost effective, that resources are used efficiently and that polluters pay for their emissions. Providing the public with necessary information, help and consultation regarding management plans. Environmental code The Environmental code, or Miljöbalken, is a segment of the Swedish law that concerns the environment. It was introduced in 1999 aiming to promote the development towards a sustainable future. The code consists of seven divisions with a total of 33 different chapters and about 500 paragraphs (Miljöbalk 1998:808). All businesses that perform activities affecting the environment must follow the Environmental code. The chapters that is of largest interest for hydropower operations is chapter eleven, which concerns all water related operations. Chapter two and five are also important, as they comprise general consideration rules and environmental quality norms, respectively. Further is chapter four essential for the hydropower since the chapter comprises particular previsions regarding a preservation of certain land and water areas. 8
29 Chapter four states inter alia that an expansion of hydropower plants and a regulation of rivers with the aim of power generation are prohibited in some Swedish rivers and different catchments areas. The river stretch between Höljes and Edebäck in Klarälven is a s subject to this provision. The essential parts of chapter eleven, which comprises regulations within water operations and hydro plants, are the following: Particular condition for water operation: Water operations should only be operated if the advantages for the society outrun the costs and damages that comes with it. The operations should not obstruct other possible fields of application within the same water assets. If the operations cause any harm to fish stocks, it must be compensated. Permission duty of water operations : Water operations require permits, which needs to go through and be approved by the authorities. Maintenance responsibility : The owner of a plant is obligated to keep it maintained in order to avoid harming general or individual interests by water flow changes. If a dam is not enough equipped to resist a dam failure, the owner is obligated to compensate for the damages. Demolition : Permits by the code should always be applied unless it can cause harm to real estate. If a plant is not operated by a company, the estate owner needs to take over the obligations that comes with the plant to make sure that they are fulfilled. Classification of dam safety: Dam failures can cause devastating consequences and dams should therefore be sorted into different classes, depending on the severity of the consequences. Chapter two in the Environmental code comprises general consideration rules and the most essential parts of this chapter are: Consideration rules: Anyone who runs a business that could potentially affect the environment and human health should have substantial knowledge regarding the safety and security related to its operation. Precautions should also be implemented in order to avoid any harm to the environment and human health. Location : The location should be carefully selected to allow for the purpose of the business to be fulfilled, with the least impact possible on the environment and human health. Responsibility for the harmed environment: Operations that affect the environment negatively should be restored or compensated for. Final consideration : If the effects of running an operation cause considerable harm to the environment or human health, it is up to the government to decide whether it should be operated or not. If the operation will cause a remarkable damage to the environment or risk a deterioration of the living standard for a large amount of people, it will in general not get an operation permit. However, there are some exceptions. Chapter five comprises Environmental Quality Standards (EQS), so-called Miljökvalitetsnormer in Sweden. These need to be considered when operating hydropower plants. These regulations should ensure the quality of the environment. The most important sections are: Prescription of the environmental quality: The quality of selected areas should be tested and reported. The tests should include the pollution and disorder level of the environment in comparison to the permitted levels. It is the authorities and municipalities that should ensure that the EQSs are followed. 9
30 Program of measures : If an action program is needed in order for an area to reach the EQSs, such a program should be established and implemented. Monitoring : The EQSs should be controlled by sample tests and other methods in order to ensure that they are followed. The water areas are divided into different districts, where the County Administrative Board is responsible for the water quality. National strategy for measures within hydropower The national strategy for measures within hydropower was developed in 2014 by the Swedish Energy Agency and Havs- och Vattenmyndigheten (HaV). The report is based on a project that was conducted with the purpose of developing a national geographical strategy of measures within hydropower. The measures aim to decrease the negative impact on the environment, but the strategy also includes measures that aims to increase the production for an increased future demand of electricity (Havs- och Vattenmyndigheten (HaV), 2014). It was suggested that the planned environmental measures should be allowed to affect the current hydropower production by a maximum annual reduction of 2.3 %, or 1.5 TWh, on a national basis. It was also stated that the measures must not have a significant impact on the regulatory hydropower. The extent of the environmental measures can vary between the watersheds, as long as the total maximum production loss does not exceed 1.5 TWh (HaV, 2014). To minimize the measures within the hydropower sector that could affect the Swedish electricity generation and at the same time fulfil the requirements from the Water Framework Directive, HaV and the Swedish Energy Agency propose the following: HaV should strive towards concentrating the environmental measures to the watersheds that are of limited value for the hydroelectric production. HaV should, through guidelines for other organisations, strive towards increasing the classification of Heavily Modified Waters Bodies (HMWB) of watersheds with a high value for the hydroelectric generation and the energy system in general. The Swedish Energy Agency should, through their authorisation, support an increased efficiency of hydropower plans and watersheds that are highly valuable for the electricity generation and with low value for the environment. HaV and the Swedish Energy Agency should collaborate with the aim to develop a national priority plan, Nappen, for how the environmental measures should be distributed between and within the different watersheds. Both authorities should develop guidelines for how the prioritization can be implemented (HaV, 2014). The Agreement on Swedish energy policy The three keystones in EU and Swedish energy politics are ecological sustainability, competitiveness and secure energy supply. Sweden should also have a well-developed system for energy supply, with low environmental impacts and high availability. Everyone should have access to electricity to a market competitive price (Regeringen, 2016). In June 2016, five out of eight parties in the parliament met and the so called Agreement on Swedish energy policy (Energiöverenskommelsen) was established. General goals for the Swedish energy market were set and more precise goals for each energy source were discussed and determined. The overall Swedish energy targets are (Regeringen, 2016): 10
31 No net emissions of GHGs, from the electricity production, to the atmosphere by Thereafter, the net emissions should be negative. By 2040, Sweden should have a 100 % renewable electricity production. However, this is only a target and not a decommission date that will prohibit nuclear power. Furthermore, the hydropower plays a key role in the work of increasing the share of renewables in the electricity production. The decisions that were made during the Agreement on Swedish energy policy regarding the hydropower sector consist of the following points (Regeringen, 2016): Sweden should follow the EU agreements and its requirements for hydropower operations. Sweden s hydropower plants should have modern environmental permits. However, the assessment plan should not become too burdensome, it should be as simple as possible while still ensuring sustainable development. The expansion of the hydropower production should mainly be carried out by increasing the efficiency of the plants already running. New plants should possess modern environmental permits. The so called Nationalälvarna together with other, by law, protected river stretches should be protected from further exploration. The real estate tax should be reduced to the same level as for other electricity generation facilities, which is 0.5 %. The tax should be partially reduced over a four year period with start in Furthermore, the hydropower industry should cover the costs of permit processes in order to fulfil the EU criteria and its regulations. Modern environmental conditions Sweden is facing a new legislation within hydropower initiated by adaption to the EU Water Directive Framework. New modern environmental conditions will systematically be implemented within the hydropower sector. The majority of the Swedish hydropower plants and dams are operated under old conditions with permits that are valid until further notice. The aim with an implementation of new regulations is to simplify the assessment of hydropower plants that currently run under these old permits. It is proposed that all hydropower plants and their associated dams should be reassessed within 20 years. Thereafter, it is proposed that the permits should be reassessed every 40th year. In order to ensure the reassessment, a national priority plan, the so called Nappen, should be developed. HaV, the Swedish Energy Agency and Svenska Kraftnät should together develop and update this plan, which should include a time schedule for the reassessments. Furthermore, the plan should promote the most beneficial environmental measures with the least negative impacts on the electricity generation. The plan will serve as an overall guideline for the adaptation process, which will be carried out systematically and continuously (Regeringskansliet, 2017). It is possible that there will be a trade-off between the EQSs and the reduction of hydroelectric generation. To ensure that both aspects will be considered, it is likely that the environmental conditions will be prioritized in some rivers and the electricity generation in others (Vattenkraftens miljöfond, 2018) Issues related to regulations When deciding and implementing new regulations, there are several issues that can occur, which needs to be taken into consideration. Each power plant is unique and the environmental condition in the surrounding area varies between different locations. A couple of relevant 11
32 parameters, which might problematize the regulations regarding hydropower, are the Environmental Quality Standards, Natura 2000 areas, regulations regarding rare and threatened species and the obligation of using the best available technology. Environmental Quality Standards (EQS) Whether the EQS, which are stated in the Environmental code, are reached or not is highly dependent on the classification of the specific water body. The classification types are Natural Water Body (NWB) and Heavily Modified Water Body (HMWB) and the environmental requirements differ significantly between them. A water body is only classified as HMWB under certain circumstances where the water body has no possibility of reaching a good ecological status. If a water body is defined as HMWB, it has gone through large physical alterations with a significant modification of its original characteristics. Each hydropower plant and the surrounding ecological fauna is unique. Therefore, every power plant needs to be individually evaluated as to whether it has a notable impact on the characteristics of the waterway. In order for a regulated waterway to be classified as HMWB, the status of the waterway should be less than good because of the physical adjustments. Also, the benefit of the energy storage in dams and reservoirs should be justified based on the socio-economic benefit, not the profit of the company. Another criterion that needs to be fulfilled for the HMWB classification is that all possible environmental measures aiming to assist the waterway in reaching a good ecological status would have a large negative impact on the load balancing ability of the reservoir. Lastly, the benefit of using the waterway as an energy storage should not by any other technical or economic mean be able to be achieved (HaV, 2016a). If a water body is classified as HMWB, the EQSs will be adjusted in comparison to the EQSs for an NWB. The EQSs for good ecological potential for HMWB are based on the relation to the maximum ecological potential (HaV, 2016a). Therefore, it is more difficult for water bodies in proximity to hydropower plants to reach a good status if they are not classified as HMWB. The classification processes are complicated and requires technical, scientific and socio-economic evaluations. Therefore, only a few of the water bodies around the 2000 hydropower plants in Sweden are classified as HMWB. The rest of the water bodies only fulfil one or a couple of the requirements for the classification (HaV, 2017). In other countries in Europe, different assessments have been made. In 2005, countries such as Belgium, Czech republic, the Netherlands and Slovakia identified 40 % of their surface water bodies as HMWB. In the same year, the total fraction of heavily modified surface water bodies within the EU member countries was 15 %, with an additional 4 % classified as artificial (European commission, n.d.). Natura 2000 Natura 2000 is another factor that plays a significant role when it comes to the new hydropower regulations. Natura 2000 is a network of protected areas all over the world. It covers around 18 % of the European land area and 6 % of the European marine areas. The aim of the network is to protect threatened species and rare habitats and ensure a long-term sustainability along the most vulnerable and rare habitats and species. The network stretches over all EU countries (European commission, 2018) and in Sweden there are around areas classified as Natura If a river stretch is classified as Natura 2000, it can affect the regulation hydropower in the river, as the classification entails rules for how much the flow can vary. Hence, a conflict can occur (Löfstedt, 2017). 12
33 Protection of species The regulation of water and hydropower plants affect the natural fauna and ecological status in rivers. Modification of natural rivers entails changed habitats for fish, insects and other water living organisms. The power companies are required to compensate for the damage of the fish and fishery in regulated rivers and dams (Miljöbalk 1998:808). There are different ways to compensate for the disturbances of the natural fauna. One way is to build downstream and upstream fishways around the power plants. Fishways can work to a certain extent, but if the fish needs to pass several hydropower plants to reach their spawning areas, there is a high risk that they will not be able to find all the passages. Another way to ensure that the fish will reach their spawning area is to transport them upstream. In order to do so, the fish must be trapped, collected and transported upstream and thereafter released at a location where it has a larger chance of reaching its specific spawning area for reproduction (Fortum, 2017a). However, when migrating back downstream, the fish needs to pass through the hydropower plants. Fish populations migrating upstream and downstream a regulated river is often reduced due to the hydropower plants and in order to ensure a stable population, the hydropower companies often run compensatory fish farming. The compensatory fish farming began in the 1950s and 60s. The power companies have specific facilities where they cultivate different species, mainly salmon and trout. The fishes are later released downstream the power plants where they can reach lakes and seas for growth. The power production companies in Sweden cultivate about 2.5 million salmons and trouts on an annual basis (Svenskt vattenbruk, 2016). Ecological compensation is a guideline developed by the Environmental Protection Agency (Naturvårdsverket). It provides a proposed action plan on how to compensate for environmental losses based on the agency s interpretation of the Environmental code. It states that the compensation actions must contribute to an enhanced or preserved environmental status. The essential part is that the planned compensation should strengthen the green infrastructure and that the quantity of the compensatory work covers the quantity of the losses. The planned compensation should be a long-term investment and if it is predicted that it will take time before the compensation is fulfilled, the scope of the action should be larger than if the action would have an immediate effect (Naturvårdsverket, 2018). Best available technology According to the Environmental code, a hydropower operator is obligated to use the best available technology to minimize the damage to human health and the environment. HaV is in the working process of developing a guidance regarding best available technology within hydropower. The main issues within this sector are fish passages and water regulations (HaV, 2016b). The best available technologies discussed in issues related to water regulations are different types of spillways and how the regulation power can allow for a flow similar to the natural conditions, from an ecological perspective. However, each power plant with its surrounding area is unique and different actions would have to be carried out on the different facilities in order to imitate a natural flow. An ecological regulation would also likely affect the normal regulation power and reduce the electricity generation of the plant (Sweco, 2015). Practically it is unmanageable to both imitate a natural flow and run regulation power and a conflict occurs. Another type of technology that is essential for the hydropower is how the fish is transported downstream in the most efficient way. HaV (2016b) states that the essential aspect is the efficiency of the different passages. Possible solutions are to have downstream fishways or some kind of trap-and-transport solution. However, the knowledge within the latter is limited 13
34 and further technical evaluations of these kinds of installations at bigger hydropower plants are necessary. Fund solution for Hydropower Vattenkraftens miljöfond, or Vattenfonden as it will be referred to in the continuation of this report, is a fund solution for the hydropower industry and the main driving force of this fund is the EU Water Framework Directive, the national strategy and the Agreement on Swedish energy policy. There is a total of eight hydropower production companies who have taken an initiative and established the fund solution as a step towards becoming more sustainable by improving the environment around hydropower plants. The fund will provide a financial support to necessary environmental actions. These eight hydropower production companies represent 97 % of the Swedish hydroelectric production. The fund will stand for a financial support of 10 billion SEK for environmental measures within hydropower over a period of 20 years (Vattenkraftens miljöfond, 2018). During the Agreement on Swedish energy policy, it was decided that the real-estate tax would be reduced gradually to 0.5 % for hydropower and that the hydropower industry itself should finance implementations of modern environmental permits. These costs could partially be financed by the fund. An establishment of the fund would entail that it would become the largest financier of environmental investments in Sweden. All hydro operators included in Nappen will be able to apply for financial compensation from the fund. However, the decision on how the support will be prioritized and distributed will be made in collaboration between the eight power companies. The general financial idea is that the fund will cover 85 % of project costs and the companies themselves will stand for the remaining 15 %. The fund solutions could be used at different stages of an implementation of a project and compensate for costs related to investigations and legal trials, different measures such as implementation of fish ladders and habitat restoration, production losses and damages. Application for funding will be possible from However, funding can be applied retroactive from the 1st of December 2015 (Vattenkraftens miljöfond, 2018). 14
35 4 Social and environmental impacts of hydropower Hydropower operation and flow adjustments have impacts on the aquatic environment in areas in proximity to the plant or dam, but also on the water system as a whole. These types of activities cause hydrological changes with alterations in flow pattern and water level. The dam and plants also constitute an obstacle for migrating aquatic species. In general, it can be said that hydropower causes direct and indirect effects on the aquatic environment. Direct effects are physical adjustments to the natural waterways as a result of the construction of dams and new channels as well as of flooding and drainage regulation. In regulated rivers, the environment often tends to become more homogeneous. Indirect effects address the impacts caused by a more homogenous environment, such as degraded living conditions and a different species setup. The change in biodiversity includes the alteration of the density of organisms and the species composition as well as production conditions and involves an alteration of the aquatic species system and its processes. All hydrological environments are unique and complex. The effects on the aquatic environment varies between hydropower plant locations and depend on several factors such as the geological and hydrological conditions in the catchment area, the regulation effects upstream and downstream the plant, the area specific species composition, the plant s technological construction and the effect of other human activities in the area. When constructed, the hydropower plants do not only affect the surrounding area, but the water system as a whole. The effects are often cumulative, which means that it is not possible to solely measure the effects on a local scale and make conclusions about the total environmental effects upstream and downstream. When performing environmental analyses, the local consequences should be examined before the system level effects are evaluated (Näslund et al., 2013). The most important environmental issues related to hydropower can be divided into three levels, as presented in Figure 1. In 1984, Petts designed this organization of hydropower related environmental effects, which shows how the effects are transferred up the food chain with time and how they are interconnected. The three levels are further described in the following sections, 4.1, 4.2 and 4.3. Figure (2013). 1. The three levels of environmental issues related to hydropower. Modified after Petts (1984); Näslund et al. 15
36 Primary level: Direct effects of the impoundment The primary level includes the effects occurring as a direct result of the impoundment, such as the transfer of water, sediment and energy downstream. This include topics such as continuity, hydrology, water quality and geomorphologic processes (Näslund et al., 2013) Barrier effects on migrating species Waterways are open and continuous systems, where the flowing water drives sediment and organic material downstream. The flowing water also allows for different aquatic species to migrate upstream and downstream, which is a common moving pattern for many organisms such as salmonid kelts before and after spawning. Throughout history, some hydropower plants and dams have been constructed at the location of natural migration barriers. However, when the plant or dam is not located at a natural migration barrier, it prevents or changes the natural migration possibility and divides the waterway into different more or less isolated fragments. To enable fish migration, fishways can be constructed in near proximity to the hydropower facility. The fishways can be designed as a ladder or a channel. Lately, it has become popular to create a bypass channel around the plant. It is usually a design implemented when the head loss of the plant is low, as a large height difference between upstream and downstream water requires a long bypass channel. The bypass channel does not only allow fish to migrate upstream and downstream, but also creates a flowing aquatic environment for other species, such as bugs and insects. If the head loss is low at the location of the plant, the bypass channel can also be internally constructed to allow for passage through the dam (Näslund et al., 2013) Hydrology An introduction of a hydropower plant with a dam always causes a disruption to the hydrological system. The waterway inclination and flow create energy, which sets the conditions for morphology and habitats. These enable the creation of ecosystems. In a regulated river, the natural river morphology and habitats are affected. An important hydrological aspect is the groundwater and surface water interaction. The soil condition and groundwater are highly affected by the flows and water levels in adjacent lakes and waterways. Vice versa, the surrounding areas affect the temperature, chemistry and flow of the waterways and lakes (Näslund et al., 2013). There are five different important flow factors that drive ecological processes in a river: magnitude, frequency, timing, duration and rate of change of hydrologic conditions. The magnitude is the amount of water per unit time and the frequency represents how often a specific flow occurs during a time interval. The timing is the predictability of the occurrence consistency of a specific flow. The duration can be referred to as the period of time of the flow. The rate of change of hydrologic conditions represents the speed of change between different flow magnitudes (Poff et. al, 1997). The size of an impoundment is dependent on inclination, height and specific area conditions. If a dam is constructed in a waterway with a relatively low inclination, the vertical drop is concentrated at a specific point and the inclination upstream approaches zero. This results in an impoundment with similarities to a lake. The water velocity is decreased, which creates a new aquatic environment. Dams and power plants are often constructed along the same river system. 16
37 This provides the operators with a high regulation possibility and the annual flow is mainly controlled by the power demand. In a natural waterway, the catchment is the dominating flow factor. The flow varies with the season and enables biodiversity and productivity of the water system. In a regulated river, it is difficult to establish this natural annual flow pattern. Many power plants with attached dams have a channel or penstock that transports the water into the turbines. This cuts off the natural waterway and results in complete drainage of this river stretch during dry seasons. During wet seasons, when the flow is higher than the turbine capacity, the natural channel is usually water-filled due to spill. The length of the occasionally dry segment is dependent on the distance between the inlet and the power plant or the distance between the power plant and the connection between the new and the old waterway. The distance is often relatively short, up to a few hundred meters, but can sometimes range up to a couple of kilometres, causing the water to end up in another catchment. Most of the hydropower plants in Sweden have permissions according to a legislation from 1918, which mainly focused on facilitating the exploitation possibilities. Due to this, only a limited amount of the Swedish hydropower plants have minimum discharge requirements in the natural waterway and these are outdated and limited and usually represents less than 5 % of the mean flow. However, although the flow is significantly lower than during natural conditions, the minimum requirement results in a continuous flow that allows for relatively preserved aquatic ecosystem. Current research is focusing on finding ecological flows for waterways with minimum discharges. During seasons with high flows, the flow can exceed the turbine capacities, which means that some of the water must be spilled. An issue that can occur during these periods in river fragments with minimum discharge requirements is that the established aquatic ecosystem is washed away or in other ways affected negatively (Näslund et al., 2013). In Sweden, hydropower is, inter alia, used for short-term regulation. The regulation is controlled by electricity supply and demand and the need for grid frequency stability. This requires some hydropower plants to have a high regulating intensity, which consequently results in a large flow variation. The time variation can differ from minutes to hours. The regulations regarding zero flow and short-term regulation individual for each plant and are usually generous, allowing for a large variation in flow. The storage capacity upstream decides the possibility of short-term regulation and zero flow. Many lakes are used as reservoirs for regulation, usually on an annual basis. This entails the possibility of seasonal storage, where the water is kept until winter. However, as a result, the seasonal storage causes a significant water level difference in comparison to natural conditions. The spring flood is avoided, and the water level is lower than normal during late winter and spring. These alterations affect the surrounding vegetation. There are also a few multi-year storage reservoirs, which allow for water storage from dry to wet years. Only a few lakes are short-term regulated (Näslund et al., 2013) Water quality There are different aspects of the regulation power that affect the quality of the water. In waterways with reduced flow, the total volume decreases and hence also the sensitivity of contamination from human activities such as industry and farming, through pollution and eutrophication. If the river has a large variation in water flow, the proportion between the spilled water from the dam and the surface and groundwater fluctuates, which consequently causes the water quality to vary (Näslund et al., 2013). Another risk that arises from reduced 17
38 flow is acidification, if the share of acid tributaries increases as the main water flow decreases, which usually occurs during the spring (Näslund et al., 2013). Also, according to Boulton (2007), sedimentation caused by a reduced flow could potentially pose a risk for larger fraction of anaerobic water at the bottom of the waterway, due to reduced mixing between different layers. The construction of dams increases the sedimentation and retention which consequently affects the water quality. In an unregulated river, the number of chemical components in the water such as calcium, potassium, magnesium, silicon and sodium increase along the waterway, whereas in a regulated river the element levels stay relatively constant (Humborg et al., 2013). This means that the levels at the endpoint, the ocean, are significantly reduced, which can cause effects on the algae composition and primary production (Näslund et al., 2013) Sediment transport and water and ice conditions Natural changes in the physical appearance of waterways over time are a result of sediment transport. It includes erosion and the discontinuous process of particle transportation and sedimentation. Usually, the sediment transport is divided into suspension transport and bottom transport. In the former, the sediment is suspended in the water whereas in the latter, it is moved along the bottom of the waterway. Usually, the upper catchment area is subjugated by erosion and the lower area by deposition. Changes in the physical appearance of a waterway affects the aquatic ecosystem, both upstream and downstream. These effects usually appear continuously over a long time period. Short-term regulation causes increased erosion downstream, which is usually due to the increasing water inclination and flow level together with a decreased water level. In impoundment areas, the energy of the water is decreased, which also decreases the sediment transportation capacity (Brandt, 2000). The sedimentation upstream increases and usually has the largest impact on the area where the natural inclination of the waterway decreases. The sedimentation results in a sediment deficit downstream. The overall transport capacity of the water is affected, especially for course material. This sometimes results in course material getting stuck on the bottom of the upstream waterway, which can consequently cause further sedimentation in combination with settlement of smaller particles (Näslund et al., 2013). The determining factors for the water temperature in an unregulated waterway are air temperature, wind and radiation together with the flow velocity and volume. In waterways with high flow, the water-air-contact increases, which accelerates the heating and cooling process. In dams, the water temperature is usually equilibrated with stratification. The water temperature downstream is affected by the construction design of the power plant and the level of the inlet to the turbine. If the latter is located on a lower level, the water will be colder than normal during winter and hotter than normal during summer. In regulated rivers, the large variation in flows usually results in a larger fraction of open waterways during winter, which consequently entail unstable ice conditions. Another issue appearing both in regulated and natural rivers during the winter is frazil icing, which is a result of water with a temperature close to zero flowing with a velocity over 0.6 m/s. Frazil icing is when small ice crystals are formed and transported with the stream, causing ice build-up when encountering other material. It can result in local flooding and cause issues for the hydropower plant. In regulated waterways that have a relatively continuous flow, the effects on the water temperature is less substantial and the temperature is homogenous throughout the river. In waterways with a reduced flow, the ice sets earlier than 18
39 usual and the groundwater usually has a larger impact of the flow and the temperature (Näslund et al., 2013). Secondary level: Physical changes and habitat structure The secondary level effects appear as a result of the primary effects and includes prerequisites for primary production and physical alterations of the aquatic environment. These effects can gradually increase or continue for a long time and appears later than the primary effects. It can take up to a hundred years before they appear (Nath, 1999) Morphology The morphology includes the formation of channels, erosion, sedimentation and allocation of flow velocities and is dependent on the interaction between the geologic conditions and the water flow characteristics. In an unregulated river, the interaction is usually in a dynamic equilibrium. When the hydrology changes, the morphology changes. This can be presented by characteristics such as erosion and dried out channels. If there is upstream sedimentation causing sediment deficit downstream, a result can be so called clear water erosion. This excavates the waterway and makes it deeper, causing a reduced groundwater level in the surrounding area and an increased risk of landslides (Näslund et al., 2013) Primary production Periphyton represents the dominating primary production in natural rivers. There are different species of periphyton with different requirements of substrate, flow, nutrition and light. Also, the composition varies throughout the year. Hence, a variating waterway environment allows for a larger number of species. Regulated waterways cause different physical effects, as mentioned in section This consequently results in degenerated conditions for periphytons and a reduction in biodiversity. The effects on the primary production varies with the flow velocity, temperature and habitat. An effect of a reduced flow is that macrophytes might increase significantly in rivers and other waterways. When some species increase while other decreases, the natural equilibrium is eliminated. In mountain lakes, the primary production is dominated by benthic algae, which lives on dissolved nutrition and the interstitial water in the sediment. These algae, after decomposition through the benthos, later become fish food and are a prerequisite for their reproduction. In regulated mountain lakes, the water level varies unnaturally throughout the year, which causes the shallow areas to dry up during late spring and early summer and be covered by ice during the winter and early spring. Consequently, during parts of the year, these areas loses their vegetation and hence, their benthic algae. Due to this, the biological production capacity of the lake or reservoir is heavily reduced. Dams also reduce the waterways ability to transport seeds, sediment and other organic material. Plant parts accumulate on the bottom in low flow sections of the river and the disposition is reduced, which consequently reduces the primary production capacity of the waterway (Näslund et al., 2013). 19
40 Third level: Effects on the aquatic and terrestrial fauna The third level effects are a result of the primary as well as the secondary levels and comprises the terrestrial and aquatic flora and fauna, such as impacts on invertebrates as well as bird and fish communities. It can take a long time before these effects become apparent as they appear later than the primary and secondary effects. It can take years before a new ecosystem equilibrium is established, as it requires complex interactions between the species and the life conditions of the environment (Näslund et al., 2013) Benthos The benthos species require different environmental condition with regards to substrate, flow, water quality and temperature. When the waterway is regulated, and physical changes appear, some of the benthic species can go extinct. When the waterway has a reduced flow, the amount of species and benthic invertebrates is usually lower because of rapid flow variation. The reduced flow can also result in oxygen depletion, which causes the benthos to reduce. Dams entail an issue for certain benthic species, as the transportation of organic material from the terrestrial environment is altered. More of the material is accumulated on deeper water levels and is not distributed in the waterway as originally was. Short-term regulation poses a threat to the benthos, as the flow variation requires the animals to move continuously to find the right conditions regarding flow velocity, substrate and depth. Also, if they are not able to withstand the high flow velocity, they can be carried away with the current. Sometimes, the benthic species are confused and voluntarily leaves their habitats due to the increased flow. In downstream lakes, certain benthic species thrive due to plankton and organic material travelling downstream the waterway with the current. This is usually the most productive part of a water system, but when dams are constructed, the nutrition reduces, and these areas becomes poor in species (Näslund et al., 2013) Fish The barriers created by the implementation of hydropower plants entails an obstacle for species migrating up or downstream. Species that grow up in the ocean or lake and migrate upstream the fresh water rivers to reproduce, such as salmon and trout, are blocked by the plants. These types of species are called anadromous species. Also, catadromous species such as the eel, that reproduces in the ocean and lives in fresh water, cannot access their natural growth habitat. Species also face a hazardous transportation downstream through the turbines and channels. Even species that live entirely in fresh water are affected by the dams, as they usually have an extensive natural moving pattern (Näslund et al., 2013). Some anadromous species, such as the Klarälven salmonids, have to move downstream after reproduction. This means that both kelt and smolt need to pass through the turbines and hydropower channels. Passage through tunnels and turbines has several negative effects on the fish species, such as the impacts from rapid and extreme pressure changes, cavitation, sheer forces, turbulence causing injuries or disorientation, collision with moving parts within the turbine house and abrasion when the fish is pushed between moving and stationary parts within the turbine or channel (Cada, 1997). Generally, the larger the fish and the larger the fall, the 20
41 higher injury and mortality rate. Some turbines are better than others. The Kaplan type is more fish friendly than other turbines and usually has a higher fish survival rate (Coutant & Whitney, 2000). Some of the affected species may reduce in number while others are able to adapt to the altered conditions and become stationary. There is also an issue with so called fragmentation, which is when the population is divided into different genetically isolated fragmented populations. Overall, the changes in habitats as a result of implemented regulation power alters the natural equilibrium and species that are adapted for lakes starts dominating the waterway. Also, predators such as the pike population are allowed to increase and gets a larger impact on the aquatic environment. The pikes particularly thrive in stationary water during periods with zero flow through the plant. Reduced flow with minimum spill causes issues for species with their habitats in waters with a current. Short-term regulation reduces the levels of available food and sometimes the species even risks being stranded when the flow rapidly decreases due to the spillways being shut, while fish fry and roe might drift away during rapid flow upturns. Spawning grounds might be dried up and the migration might be disturbed or even interrupted. Rapid changes in flow forces the fishes to switch position and adapt more often, which requires a higher internal energy consumption and reduced time for food intake, which can affect the growth and survival rates (Näslund et al.,2013). The regulation of rivers can also reduce the ice coverage, which eliminates the natural protection for the fish. The increase of frazil icing also affects the aquatic species in terms of growth and survival (Beltao, 2008). In the mountain lakes or reservoirs, the amount of aquatic species is reduced. This has negative effects on species feeding on benthos. The negative development might potentially continue for over 50 years after the construction of the dam (Näslund et al., 2013). In the CBA performed and presented in this report, the third level effects on the fish is the impact of major interest. The suggested project in Edsforsen is an environmental measure that aims to improve the migrating possibility of salmonids in Klarälven. The quantification of the ecological impacts of an implementation of the trap-and-transport facility in Edsforsen is further elaborated in section Effects on terrestrial flora and fauna If natural processes such as deposition of sediment and organic material and heteroecism is disturbed, it might affect the surrounding flora and fauna negatively. As the introduction of power plants and dams affects the natural interactions within a waterway and the surrounding area as well as the groundwater, the effects on the biomass can be extensive (Näslund et al., 2013). In some reservoirs, the vegetation in the maritime area can be degenerated due to erosion and alternating water level changes. Also, the transportation of seeds downstream is stopped by the plants. In a study by Nilsson et al. (1997), it was identified that regulating reservoirs has reduced the amount of different species with 33 % and river reservoirs caused a reduction of 15 %. 21
42 The effects on the terrestrial fauna is dependent on several parameters, such as the species in question, the size of the waterway, the morphologic changes and the biogeographic region. Flooding of terrestrial areas and changes in flow dynamics have been identified as factors that affects the fauna negatively. These factors can reduce the colonization of maritime plants and reduce the productivity and composition of species in general. Also, secondary effects from a reduced aquatic fauna undoubtedly hits the next level of the food chain, which can consequently affect animals and mammals. Insecticidal birds are affected by a reduced number of insects due to changes in their reproduction conditions. Large mammals can be affected by a reduction in vegetation production in connection to the river. Overall, it is complex to estimate the effects on the terrestrial flora and fauna and the scientific knowledge is limited (Näslund et al., 2013). System level effects Highly regulated river systems have effects on a large geographic area and can result in changes in the nutritional equilibrium, temperature, oxygen levels and disposition of organic carbon. The effects appear over time and can continue for a long time (Näslund et al., 2013). Another effect is the increase of GHGs in form of methane produced in stationary waters. Although more prominent in tropical areas, these types of emissions still occur in countries in the north. However, in Sweden, the main part of the regulated lakes is natural. The areas around the natural lakes that were flooded when the hydropower plants and dams first were constructed had a low concentration of organic coal, which consequently led to less GHG emissions. Also, since most of the flooding occurred many decades ago, the emissions should now be close to zero (Trussart et al., 2002). On the other hand, despite the methane produced in some stationary waters in tropical areas and the emissions released during the plant construction, hydropower does not release any GHGs. Due to the climate change, the global temperature is increasing. The global warming will increase the temperature of the water in rivers and lakes, which can have negative effects on the ecosystems as it alters the natural conditions. As utilization of hydropower mitigates the GHG emissions, the energy source consequently helps reducing the global warming (Berga, 2016). Social impacts There can be several social impacts of a hydropower plant, both positive and negative. Globally, the four most prominent socio-economic issues are the involuntary dislocation of people living in the area, the public health risks, the sharing of the development benefits and the impacts on minority groups in the society. Also, many environmental concerns of hydropower indirectly cause social impacts (Trussart et al., 2002). The construction of hydropower plants with a connecting dam and reservoir often requires displacement of people living in the areas that will be flooded. It is important that the people that are affected by the project are properly compensated and better-off after the implementation than they were before (Koch, 2002). The issue with public health mainly affects tropical and subtropical areas. In these parts of the world, dam and reservoir constructions often results in an increased population density, which can increase the risk of waterborne and behavioural diseases. The impacts on the public health must be assessed in all hydropower projects and the health conditions must not be degraded, 22
43 but rather improved. This can be done through allocating money to health care services and minimizing the flooding of populated areas (Trussart et al., 2002). A hydropower business has a long-term impact on a local and national level and generates revenue by utilizing a renewable natural resource. On a global scale, in countries with dry environments and densely populated areas, the access to irrigation dams and energy generation are of high economic importance. Generally, for all countries, the local area where the power plant is constructed usually experiences negative effects while the region or nation as a whole receives access to low-priced and reliable renewable energy as well as regulated and controlled discharge. Depending on the ownership and the legal requirements, some of the revenue can go back to the local area. A hydropower plant can also, in some situations, increase tourism and enable formation of recreational areas. Fish migration and the impacts on the fish living conditions in the river are issues related to both social and environmental aspects of hydropower. The environmental aspects are further explained in section 4.1, 4.2 and 4.3. The social aspects include inland fisheries, both as a source of income for those who run the business, but also as a recreational resource and a tourism attraction (Koch, 2002). The construction of hydropower plants also poses a risk for minority groups, which can be indigenous people or other ethnic minorities separated from the regular society. As they are a distinct minority, their vulnerability lies within their difficulty of making their voice heard. The introduction of a hydropower project can have effects on important cultural and social resources. To circumvent this issue, the minority group predicted to be affected by the project must be included in the process and be given the opportunity to be a part of the development (Trussart et al., 2002). In comparison to other parts of the world, the negative social consequences were not very prominent during the hydropower expansion in Sweden. When the Swedish hydropower was established, the construction was primarily performed by local villagers, which had a positive impact on local communities as it increased the employment in the areas surrounding the hydropower plants (Näslund et al., 2013). 23
44 5 Socio-economic assessment methods The purpose of a socio-economic analysis is to assess effects of societal measures. The analysis should account for all effects on all individuals in society. The socio-economic analysis differs from private, business and government finance, as it also considers social and environmental consequences. There is a number of different procedures related to environmental decisionmaking. In this chapter, the theory behind CBA and the application of the method will be covered. Additionally, the basic theory behind MCA will briefly be explained. The chapter will also cover how this methodology can be useful in addition, or as a comparison, to CBA. CBA The objective of a CBA is to quantitatively compare the benefits and drawbacks of a project to the furthest extent. If the gains are larger than the costs, the project has a positive result on the society as a whole and is considered profitable from a socio-economic perspective. Similarly, if the opposite is true, the project has a negative impact on the society (Hanley & Barbier, 2009). In this definition, all activities in society that affects the well-being of humans today and in the future counts as a project. A CBA can be conducted before, during and at the end of a project. In a CBA, consequences are expressed in monetary values for comparability. CBAs can be compared to financial analyses, but the important difference is that a CBA investigates the well-being of humans whereas a financial analysis investigates how the flow of money is affected by a project. However, financial analyses can provide information that is important for a CBA (Energiforsk, 2017). In a CBA, investments, costs and returns related to a project are evaluated over time. The analysis should include both direct and indirect market as well as non-market goods in addition to positive and negative externalities. The purpose of a CBA is to provide the decision-maker with a helping tool to determine whether a project has benefits larger than its costs and to enable a comparison possibility, if several projects are up for discussion. The method of CBA has a vast application area and can be applied on all types of projects, from proposed environmental regulations to health-care, educational or infrastructural projects (Roosen, 2014). An important part of a CBA is the discounting. Several costs and benefits might appear over time and they must be discounted to a Net Present Value (NPV) to be comparable. Although one can find several duly substantiated proposals on how to determine the discount rate, it is impossible to predict it with exact precision. This has long been a discussion between economists. Apart from the uncertainty in the discount rate, there is an uncertainty in whether the future costs and benefits will occur or not. Another uncertainty related to CBA is that the costs and benefits from non-market goods, such as environmental benefits, are not available in monetary values and have to be estimated (Roosen, 2014) History of CBA The foundation of the concept of CBA came during the first part of the 19th century from the French engineer Dupuit ( ). His main ideas were that there is a difference between the personal finance profitability and the socio-economic profitability and that the latter is smaller than the former. As a metaphor, consumers can be sorted according to their benefit of crossing a bridge, ranging from the person with the most urgent need to get to the other side to the person with little to no benefit from crossing the bridge. If the price is lower than the personal marginal 24
45 benefit, the person will cross the bridge. The lower the price, the more people will cross the bridge. If the price is set to zero, the total benefit will be maximized. However, a company cannot set the price to zero, hence some people will be left on the other side of the bridge. These people are, from a socio-economic perspective, a loss of benefit. Dupuit suggested that the price should be set to the marginal benefit of the people wanting to cross the bridge. The issue with this approach is that the marginal benefit will be an average, hence a certain number of people with a lower personal marginal benefit than the mean will be left on the other side. For the society, the price will consequently be too high as too few are crossing the bridge. Dupuit s ideas were further elaborated by Alfred Marshall ( ), who developed the concepts of consumer and producer surplus. Although Marshall never fully completed these ideas, they are included in almost all courses in national economy and books about CBA (Kriström & Bergman, 2014). In the United States, the concept of CBA was formally introduced in 1936, in the so-called Flood Control Act. The act established rules for evaluating projects while also including non-economic impacts. It addressed certain projects and stated that the impact benefits must be larger than the costs, to allow implementation. The act did not address distribution, i.e. who receives the benefits and who is subject to the costs, and solely encouraged a comparison of net benefits and net costs. The method was thereafter continuously developed throughout the 20th century, where several partial concepts were defined. The socio-economic revenue was set to equal a monetary benefit and the socio-economic cost was established as an alternative cost equal to the value of the displaced and unused resources resulting from the project. In general, research focus was put into distribution questions regarding how revenue and costs should be weighted and how the profits and drawbacks differed between rich and poor (Roosen, 2014). The most important concepts that were defined during the 20th century originated from modern welfare economics. In 1896, Pareto ( ) developed the Strict Pareto condition, which stated that an activity leads to a social improvement when some people gain from a project and no-one loses. This principle was considered rather unrealistic as it in real life is almost impossible to get gainers without any losers. In 1939, Kaldor and Hicks developed the Compensation principle, which formulated the idea that hypothetical compensation could be a practical rule for policy and project decisions in real life. The principle established the idea of the prima facie rule; gainers can compensate losers and subsequently provide a potential Pareto improvement. Kaldor and Hicks differed between efficiency and distribution and the principle was based upon how to utilize resource in the most efficient way. Throughout the years, there has been criticism directed towards this compensation principle, deriving from its lack of consideration towards distribution issues. CBAs utilize the partial equilibrium approach, derived from welfare economics, to weigh marginal benefit against marginal cost. Consequently, although a project might not improve the overall social welfare, it could still be approved after a CBA (OECD, 2006). Recent, modern, research has focused on the dynamics and on how the Gross Domestic Product (GDP) can reflect changes in benefits in projects regarding natural resources and environmental damage (Kriström & Bergman, 2014). In the 1960s, the basic underlying theory of CBA had been established and the theory development later came to focus mainly on empirical questions. Attempts were made to address the issue of distribution of gainers and losers and weighting schemes were developed. The discount rate had also been debated for a long time, but no general agreement had been established, on how to calculate it. Even today, this is one of the most debated aspects of CBA (OECD, 2006). During the most recent years, theory development has mainly focused on how to express benefits in monetary terms. 25
46 Today, CBA is the most applied formal decision aid in the United States. However, within EU regulation, the method is not yet a standard procedure (Roosen, 2014). In Sweden, during the past two decades, development of the CBA method has been quite popular although the method in itself has not been as popular to practice. In 2000, only about one third of the authorities used the method. However, in recent years, the interest in the methodology has increased, partly due to EU directives. Authorities such as Naturvårdsverket and Trafikverket have taken initiatives supporting the use of CBA in environmental contexts (Kriström & Bergman, 2014) Underlying theory The most important underlying theoretical concept of CBA is that benefits and costs are growths and reductions, respectively, in human wellbeing. A project evaluated by a CBA is approved if the benefits of the society exceeds the costs. The society is referred to as the sum of all individuals and the costs and benefits are derived from their preferences. Furthermore, these preferences are measured by the willingness to pay (WTP) for a benefit and the willingness to accept (WTA) a compensation for a cost. An important assumption is that the preferences can be aggregated and simply summed up to find the desire of the society as a whole. Also, the Kaldor-Hicks criteria must be met. According to this criterion, an activity can increase the welfare of society if the gainers can compensate the losers. There is no requirement for this compensation, but it must be hypothetically feasible. If the total benefit is larger than the total cost, the utility of the society increases. In a CBA, distribution effects are not automatically considered. Thus, if needed, the method must be complemented with a distribution analysis (OECD, 2006). CBA is based on normative theory principles. It is rooted in welfare economics, which originates from national economy with a neoclassical orientation. The former studies how different actors utilize the resources of society. The latter assumes that resources are limited, that humans are rational with a strive to maximize their profits with no regards to habits and that humans buy and sell on markets to increase their personal benefits, which in turn enhances the welfare of the society (SIKA, 2005). Three important assumptions within the concept of socio-economic analysis and CBAs are utilitarianism, anthropocentrism and individual sovereignty. Utilitarianism can be described as the strive to maximize the utility of the society. Utilitarianism considers all interests on an equal basis and deems the well-being of the society as the sum of each individual s utility. It does not consider the difference between rich and poor. The anthropocentric viewpoint implies that the value of things is derived from a human perspective, i.e. from humans subjective feelings of happiness and well-being. Hence, according to this viewpoint, only human beings have an intrinsic value. Other creatures and objects solely have a value if it is denoted by humans. The principle of the sovereignty of individuals is a belief of self-ownership, meaning the control over one s life and the exclusive power to make decisions regarding what is best for oneself (SIKA, 2005). Based on the individual sovereignty, the preferences of all individuals must be measured through their willingness to pay (WTP). Everything that an individual is willing to pay for has a value, hence it does not solely apply to market valued goods. An issue with this way of thinking is that the individual can overlook and ignore effects with a cost or value for the society, either by choice or by unawareness. These effects are usually referred to as externalities. More about this in section In reality, it is not possible to collect the preferences of all individuals, which is why mean values for different groups have to be established. It is important that the mean 26
47 WTPs are fair and consider the differences between rich and poor. If all the individual WTPs were compared or if the groups were sorted wrongly, the will of the rich people would be valued higher than the will of the poor. The mean value should to the same degree of importance represent both the preference of individuals with a high income as well as the ones with a low income (SIKA, 2005). The mean values of preferences are then to be aggregated. There are two different rules of aggregation. The first is that the circumstances of the gainers and losers are irrelevant and the effects, positive as well as negative, are aggregated with regard to the WTP and WTA of the different social groups. The second rule requires more emphasis on effects for disadvantaged groups, which is due to the fact that the change in human satisfaction derived from an increase or decrease in an individual's income usually is more notable in low income groups (OECD, 2006). In the world of economists, one distinguishes between different types of values related to individuals; user, existence and opportunity values. The user value refers to the value of the possibility to use a resource today. The existence value represents the value that an individual is willing to pay to maintain a resource, although he or she might not ever utilize it. The opportunity value is the value of a resource that might be useful for an individual in the future (SIKA, 2005). Additionally, the society of the future must be considered, which is why costs and benefits that might appear during the lifetime of the project must be considered. Also, for simplicity, the preferences of future individuals are assumed to be the same as of current individuals. However, the value of these effects is discounted based on the principle of humans appreciating current events more than future events (SIKA, 2005) Steps in a CBA The six main analysis steps in a CBA are the definition of the project, the identification of the impacts of the project, the evaluation of the impacts, the discounting and calculation of the NPV, the application of the NPV and the conduction of a sensitivity analysis. The following subsections describing the different CBA steps are based on Hanley & Barbier (2009). Definition of project This part of the analysis defines what is being evaluated, what time period is being considered and whose well-being is under consideration. It can often be difficult to define the system borders in regard to the relevant population and time period to consider. Identification of project impacts In the second step, the impacts of the project must be identified and quantified. All projects result in some sort of impact on the quality or quantity of resources. These can for example be services such as land-use, labour, electricity production and displaced pollution. When potential environmental effects are expected from a project, an Environmental Impact Assessment (EIA) is often performed. The identified impacts must thereafter be evaluated to find the ones relevant for the analysis. Relevant impacts are the ones that are linked to the welfare of the pertinent population. The identified impacts are solely a prediction, which consequently causes uncertainty in the output of the analysis. Environmental issues usually have a higher uncertainty, as these are difficult to predict with precision. 27
48 Evaluation of the impacts All the impacts of the project are to be converted to monetary values, which enables a comparison possibility of otherwise unparalleled effects. The foundation of this monetary evaluation is the valuation in terms of marginal social cost or marginal social benefit, which differs from financial investment analysis in the sense that it covers the whole population instead of just a single private individual or a company and its shareholders. Some of the marginal social costs and benefits can be derived directly from market values. Examples of this are costs and benefits related to an increased electricity production or an increase of labour. The market can provide useful values of prices as long as it is not failing, which often is the case. With market failure, one refers to the failure of including externalities in the prices. Some actions might impose effects on external people. An example of this is when people living in an area close to a coal power plant develop health issues from the emitted pollution, but the cost for the society is not included in the market price. Thus, in situations such as this one, the market prices are insufficient. Additionally, environmental effects do not have market values and must accordingly be evaluated with a different technique. This is further discussed in section Discounting and calculation of NPV After the costs and benefits of a project have been identified, sorted and expressed in monetary values, they must be expressed as NPVs to enable a comparison possibility. Essentially, for humans in general, benefits are more highly valued today than in the future and costs that appear in the future seems less troublesome than the current ones. This human way of experiencing costs and benefits over time derives from the expectation of being better off in the future or alternatively, the possibility of postponing the current costs to later generations. The costs and benefits over time are consequently made comparable by using discounting. The discounting can be performed in two ways. One technique is to calculate the NPV of the benefits subtracted by the costs for every defined time period and discount each period benefit throughout the project lifetime. Another approach is to compute the discounted values for every project element and then sum them up. Whichever method chosen, the result will be the same. The concept of discounting is further explained in section Application of NPV In this part of the analysis, the NPVs of the summarized costs and benefits are compared to each other. From this, a conclusion regarding the efficiency of project impacts and resource allocations can be made and a conclusion about whether the project should be implemented or not can consequently also be made. Sensitivity analysis The calculation of NPVs is highly dependent upon the chosen inputs. Hence, a number of small variations in input can have a large effect on the output. Occasionally, the inputs are predictions with a certain degree of uncertainty. This applies particularly to the inputs related to future flows, relative values or to environmental effects. For example, the future electricity price and the future production and sales of electricity are solely predictions and estimations and cannot be completely relied upon. Environmental effects, both positive and negative, together constitutes a comprehensive topic that requires several predictions with different levels of related uncertainty. Thus, to present a credible result, a sensitivity analysis is required in all 28
49 CBAs. In this, key parameters of the calculated NPV are identified and the values of these are then altered in relation to their individual uncertainty. The sensitivity analysis can either be done by solely analysing the variation in output resulting from a limited number of scenarios, or, preferably and more systematically, it can be performed as a Monte Carlo analysis. A Monte Carlo analysis is a computational method that relies on repeated random sampling of variations in key parameters and provides a numerical sensitivity result presented as a distribution (Hanley & Barbier, 2009) Non-market goods and externalities Typical attributes for strictly non-market or public goods and services are that they are nonexcludable and non-rival. A rival and excludable commodity is considered strict private. The non-excludability and non-rivalry imply that everyone can consume the services and that there is no limit in consumption availability (Johansson, 1993). A non-market good or service could for example be clean air or a recreational area such as a park. Everyone benefits from clean air and although everyone utilizes the service simply by breathing, the clean air will not be depleted. The same goes for a recreational area, except here an entrance fee could be introduced, which would eliminate the non-excludability. On the other hand, as the park is non-rival, a fee would lower the social welfare, which is the basic reasoning behind why public goods are paid for by taxes instead of fees (Roosen, 2014). Another central concept of a CBA, especially when practiced on environmental issues, are externalities. These are events or effects resulting from activities on the market that do not have monetary values. In 1920, Pigou introduced the derivation of externalities as the disparity between private and social costs. A simple example is polluters on an unregulated market. The polluters have no incentive to account for the third party damage that they cause. In order to be socially efficient in a CBA, the profits of the polluters must exceed the damage caused by the pollution. Similar to non-market goods, externalities are non-excludable. The difference between the two is that externalities can be both positive and negative. Pollution from a power plant is an example of a negative externality. The pollution will not be included in the budget of the plant owner, although it will potentially result in a cost for the society. A positive externality is for example a vaccine. A single individual taking the vaccine to make him or herself immune might also reduce the disease spreading and result in benefits also for people not taking the vaccine (Roosen, 2014) Valuing non-market costs and benefits How to address elusive impacts from projects have long been debated. Although having economic values, the quality and quantity of these intangible impacts cannot be estimated using market data. There are several techniques developed with the purpose of addressing the value of these public or non-market goods, all with different underlying theories. Economists usually differ between Revealed Preference Methods (RPMs) and Stated Preference Methods (SPMs). The former uses people s actual behaviour and decisions on the market to value their preferences, whereas the latter is survey-based and relies on what people have stated as their preferences in a hypothetical scenario (Roosen, 2014). When it is possible to trade non-market goods implicitly, RPMs can be used to filter out their values from the observed market prices. Sometimes this is not possible, and many decision-makers therefore turns to SPMs. The sections and are based on a report from OECD (2006) and briefly describe the methodology of RPMs and SPMs. 29
50 Revealed Preference Methods (RPMs) Common methods used for valuation of non-market costs and benefits are the travel cost method, the hedonics price method, the averting behaviour and defensive expenditures method and the costs of illness and loss output method. These methods usually go under the collective name of Revealed Preference Methods (RPMs) or market-based methods. All RPMs use market information and behaviour as a reference for the valuation of the related non-market impacts. Based on observations of the behaviour and purchases performed on the market, the methods seek to reveal the value of the non-market goods. In the travel cost method, the complementary relationship between market goods and the access to non-market goods is used to interpret the value of the latter. The value of environmental services for recreational activities is considered, as well as the time and monetary expenditures related to the recreation. As an example, based on the time and money spent on travelling to a recreational site such as a national park by visitors, the value of the area and the experience can be estimated. The method faces difficulties as the value can be derived from different or several aspects of the trip, such as the travelling in itself or the opportunity of being able to see more than just one site during the trip. Also, some costs are in themselves intangible. An example of this is the opportunity costs of the time used for travelling instead of working, which in itself is a monetary loss. The travel cost me thod is one of the oldest approaches for environmental valuation and is continuously developing and broadly used in the US for valuation of national parks. The hedonic price method finds the value of non-market goods through estimations based upon the values of related goods traded on the market. The technique utilizes the fact that all services have a bundle of attributes, together determining the value of the specific good. The related tradable goods often have implicit effects on the non-market good in question. Through this and the use of statistical methods, the value of the public goods can be identified. Nevertheless, the method has issues with some non-market goods having several elusive characteristics, often collinearly related. This can for example be the air pollution and high noise levels on a property next to a highly trafficked road. These two characteristics derives from the same source and it can be difficult to interpret each separate effect on the value of the property. Another issue is the difficulty of measuring the vague characteristics in a reliable way. The averting behaviour and defensive expenditure method is based on the individual. An example is people buying life vests before a boat trip or knee protection before trying a skateboard to reduce the consequence of accidents, which delivers an estimation of how the individual valuates the aversion of these risks. The issue with this approach is that some of the market goods can have more than just the specific benefit of averting the elusive effect. The costs of illness and loss output method utilizes the fact that some of the intangible characteristics might affect the market economically. This can for example be air pollution next to a coal power plant, causing breathing issues and hence, higher medical costs and higher burden on the healthcare system as well as wage losses for the people affected. The biggest issue with this method is that it can be difficult finding reliable evidence of the economic relationships between these effects (OECD, 2006). 30
51 Stated Preference Methods (SPMs) SPMs are usually divided into contingent valuation methods and choice modelling methods. By performing elaborated questionnaires related to a hypothetical market where the non-market good can be traded, the theoretical behaviour of individuals can be estimated. The contingent valuation approach is the most commonly used SPM. It has been used to evaluate environmental impacts since the 1990s but has long been considered controversial. However, lately, the approach has been increasingly accepted as a benefit estimation methodology. The theory of SPMs has developed extensively during the past years, with particular emphasis on reliability and on how to design proper contingent questionnaires. Which SPM that is better than the other has long been debated, with no real outcome. According to OECD (2006), both choice modelling and contingent valuation will most likely continue to be commonly applied in future CBAs and the research should focus on developing a system for when to use one instead of the other. In the survey-based contingent valuation method, questionnaires are used to find people s valuations of different goods. In contradistinction to an RPM, contingent valuation can extract non-existent characteristics such as the WTP for food safety. In general, all food on the market is considered safe and there is no pronounced and generally agreed related risk. However, if using the contingent valuation, a hypothetical scenario can be created, and people s valuation of the risk avoidance can be estimated. Important aspects of this technique are to use realistic scenarios that are easily interpreted to prevent misunderstandings and ignorance of important related attributes. The biggest issues with the method are validity and reliability, which are connected to the risk of biases related to the hypothetical nature of the survey or derived from strategic respondent behaviour and conceptual misinterpretations. Choice modelling approaches the issue of multidimensional environmental impacts and is a method that has been more and more applied globally. There are several choice modelling approaches, where choice experiment s is the most commonly used technique. In choice experiments, the valuation of characteristics in a hypothetical environment is performed by respondents having to repeatedly choose between different consumption bundles, all described by diverse characteristics. Price is usually one of these characteristics. The respondents present their preferences by choosing between different options, where one is the status quo. From the answers, an estimation of the WTP for the different attributes can be obtained. Choice modelling faces similar critique as the contingent valuation method regarding validity and reliability (OECD, 2006). In this project, the survey-based contingent valuation method is used. The willingness to pay is described as a value developed from a survey regarding the WTP of an increase of the fish population in Vindelälven. This is further described in section Discounting As mentioned in section , the discounting is a necessary part of a CBA due to the time value of money and it is used to calculate the NPV. The NPV allows for comparison of effects in monetary values over time and is an important characteristic of a CBA, as it is a method based on welfare economics and individual preferences. It has been observed that private individuals often prefer to receive a positive result or a monetary value today than in the future, i.e. now instead of later. In the same way, expenses in the future does not seem as burdensome as expenses today (Hanley & Barbier, 2009). As mentioned in , this originates from the 31
52 expectation of being better off in the future. The discounting of the costs and benefits allows for a non-time dependent comparison possibility and the Present Value (PV) of the different effects are typically calculated as presented in Equation (1). X represents the cost or benefit, the expression within the brackets including the exponent represents the discount factor, i represents the discount rate and t represents the time. PV = X (1 + i) t Equation (1) The discount factor always has a positive value between 0 and 1. If the discount rate, i, increases for a given time t, the discount factor decreases. Similarly, the later in time, the higher t and the lower the discount factor. A higher discount rate represents a larger preference of having something taking place today instead of in the future (Hanley & Barbier, 2009). The choice of discount rate is one of the most debated parts of the CBA method. It is used to offset changes such as inflation that takes place over time and the opportunity cost, which originates from the missed opportunity of investing tomorrow that appear if we invest today. The discount rate is usually determined by using the interest rate on long-term government bonds, which presents the opportunity cost of time for conducting public projects. As the equation of the discount factor is exponential, it is of high importance to choose the discount rate with caution. Depending on what type of project that is under consideration, the choice of the discount rate might have to consider that the benefits are discounted for during longer time periods than the costs, which often occurs in the beginning of a process. A complicated aspect of the discount rate appears in situations where the project has a time period covering several generations. An example of a benefit from such a project is climate change, which affects several generations to come. The issues arising from such a question is whether or not it is possible to justify that the current costs are not less discounted than the benefits in the future (Roosen, 2014). After the PVs have been calculated for each individual cost and benefit, the NPV is to be computed. The discounted costs and benefits are summarized, and the former are withdrawn from the latter, as presented in Equation (2). B represents the benefits and C represents the costs. The summation covers the whole time period from t=0 to t=t. NPV = (B(1 + i) t ) (C(1 + i) t ) Equation (2) If the NPV is positive, the CBA shows that the project is beneficial to implement, whereas if it is negative, the project will not generate a net benefit. This since, based on the theory of CBA, a positive NPV implies a social welfare benefit, seen from a holistic perspective. However, some projects are pursued although the performed CBA resulted in a negative NPV. Instead of using the NPV to weigh the costs and benefits, methods such as the Internal Rate of Return (IRR) and Benefit-Cost Ratio (BCR) can be applied. The former is common in financial investment calculations and represents the discount rate that yields an NPV of zero. It can be explained as the expected rate of return from a project (Corporate Finance Institute, 2018). The IRR method is not trustworthy when it comes to comparing different projects as it solely compares one individual project s return relative to the opportunity costs of the funds. Also, the method can result in several different IRRs from the same project, which complicates the determination of the decision-making criteria. The BCR is simply the ratio of the discounted benefits to the discounted costs and a project is accepted if the BCR exceeds the value of 1 (Hanley & Barbier, 2009). 32
53 5.1.7 Advantages and disadvantages of CBA There are several advantages and disadvantages of CBAs. Over the years, the method has been continuously developed and attempts have been made to address some of the weaknesses. In this section, the most prominent advantages and disadvantages are presented. Advantages The advantages of CBAs are many, which is the main reason to why the method is globally practiced in all different kinds of projects. It is a structured solution to how to value socioeconomic profitability. Due to the conversion of costs and benefits into monetary values, it provides a simple and comprehensible format (Rosén, 2008). Advocates of CBA have a number of reasons to why CBA should be preferred over other methods. One argument is that it is a model of rationality and the decision-maker is forced to look at gainers and losers in space and time, which avoids basing the analysis on effects on a single group of people or goal. Another reason is that CBA has the capacity to determine an optimal scale of a project, as it expresses all benefits and costs in the same units. The optimal scale is where the net benefits are maximized and provides a decision criterion for how to decide if solely a part of the project should be implemented or if it should be rejected completely. A CBA that is properly performed has the capacity of showing how benefits and costs affects different social groups, although this function is seldom applied. By using distributional weights, the concerns regarding social distribution can be addressed. The WTP is weighted by some social importance index related to the group of losers or beneficiaries (OECD, 2006). Disadvantages Despite its advantages, CBA is a debated method. It is partly due to the conversion of nonmonetary costs and benefits into monetary values, which is based on subjective estimations. Also, the method is focused on consequences and has its roots in utilitarianism. This type of approach can in some situations be perceived as controversial, as it does not account for the distribution of benefits and costs among different groups and individuals. Another criticism against CBA is the anthropogenic perspective, which according to some people eliminates its potential of being used in situations where there are several negative effects on flora and fauna (Rosén, 2008). Since the first development of CBA, criticism has been directed towards the method and its foundation in neoclassical welfare economics. A number of discrepancies related to the Kaldor- Hicks principle, explained in section 5.1.1, have been identified over the years. Many of them are related to income distribution resulting from a project implementation. Other criticism focuses on the weighing of individual preferences and in which situations they should count and in which they should not. There are no direct rules on how to estimate this properly. Due to this, the method of CBA can be controversial in some situations. Some critics also mean that there is no reasonable way of aggregating the preferences of individuals to receive a social ordering if there is no interpersonal well-being comparison. Hence, it is not possible to measure the intensity of different preferences compared to each other, which is the essence of requirements for the compensation principle. Summarized, according to the critics, if interpersonal 33
54 comparisons of utility cannot be performed, the foundation of the CBA becomes invalidated (OECD, 2006). Critique is also directed towards the usage of WTP as a measurement of the preference of an individual. Also, some mean that the usage of CBAs is disadvantageous for low income individuals. As a high income provides a higher WTP, an individual with a high income often has a higher influence than an individual with a low income. Although several groups in society might benefit from a specific project, one or more groups might be affected negatively. The result can still show a total social benefit even if some groups suffers from highly unbeneficial consequences. Thus, there is an apparent necessity of a distribution analysis. To the furthest extent, it is attempted to monetize project impacts. Some criticism is directed towards the fact that not all effects can be estimated in monetary values. This can for example be the value of a life spared due to an environmental measure in proximity to a hydropower plant. The importance in the criticism lies within the methodology and not the selection of a monetary unit. Some also criticizes the summation of different sorts of costs and benefits and suggests that although all expressed in monetary units, they are not comparable. One of the most important critiques against CBA is directed towards the discounting methodology. There is no established methodology for how to estimate and select the discount rate to weigh the benefits and costs of different generations, which raises questions about the precision of the estimation. Some people also mean that in a CBA, it is possible to manipulate the result through the input of parameters such as the discount rate or other uncertain parameters. Hence, if the CBA executor is biased, he or she can manipulate the inputs to receive his or hers wanted result. The selection of discount rate can be highly subjective, and it is important to control how different inputs affect the final result (Kriström & Bergman, 2014). A small variation in the discount rate can highly affect the output and it is hence an important parameter for the precision of the output. As the discount rate is difficult to predict correctly, this causes a high uncertainty. Hence, when using CBA as a tool to evaluate the socio-economic profitability of a project, it is highly important to remember that it is not a universal method without deficiencies. Thus, the method often needs to be reinforced by other, supplementary methods. A method often used for this purpose is Multi-Criteria Analysis (MCA), further described in section 5.2 (Rosén, 2008). Multi-Criteria Analysis (MCA) A multi-criteria analysis can be used as an alternative to CBA to prioritise between different implementations and compare the different consequences and benefits to each other. If an MCA is used for energy planning within renewable energy, the main aspects usually considered are the technological, environmental, economic and social concerns. An MCA can evaluate both monetary and non-monetary values and the main idea of an analysis is to provide a guideline for important decisions that comprises a substantial amount of information. The technological aspect should make sure that the technology that is used is reliable and mature in order to provide the best solution possible. The efficiency, output and input are other factors that should be evaluated within this category. Apart from this, the magnitude of both the production and demand should be considered. 34
55 The environmental aspects mainly consider the emissions of the process and its contribution to the global warming. The land use is another fundamental factor that needs to be considered with caution. The environment and landscape around the facility needs to be evaluated regarding aspects such as impacts on land, water, habitats and ecosystems. The location of the facility is another essential factor and it should be located where it can be operated at high efficiency while the environmental harm is minimized. Lastly, the noise level should be kept at a reasonable level so that it does not affect human or animal life. The economic aspects are quite substantial during the lifetime of a business or facility. The investment cost, which often consists of one time expenditures such as equipment, construction and installation cost, is a major factor that needs to be carefully considered and evaluated. When a business is in operation, operation and maintenance costs will apply. These cover salaries, services, fuel, electricity and other running costs. Other economic aspects that often are considered and evaluated are the NPV, payback-time, lifetime and equivalent annual cost. These factors will give an indication on how well invested the money is. The social aspects are focused on the society affected by the project. One important factor is the public acceptance, which take the opinions of the consumers and sometimes also the municipality as a whole into account. The public acceptance needs to be weighed against the social benefits of the local region and the entailed job opportunities during the operational lifetime of the project (Mateo, 2012) The MCA method The result of a multi-criteria analysis is based on different options and the objectives that the model has analysed. If only a simplified analysis is performed, it is enough to identify and evaluate the process and use that to find a preferable option. Furthermore, a well-developed MCA can weigh options based on relative importance, objectives and criteria as well as the judgement of the decision making team and evaluate each one of them in the whole context. The MCA involves objective data in forms of facts and observed data. However, the result is relatively subjective since the inputs, in form of objectives and criteria, are developed by the decision makers. An MCA can provide a structured analysis process, but a drawback with the method is that the decisions are not always consistent with the valuation of the welfare and it does not always show if the drawbacks overcome the profits. The standard structure of an MCA is a so called performance matrix. The matrix is divided into different rows, which describes the different options and into different columns, which describes the achievement of each option in comparison to the objectives of the study. The achievements can be presented in colour code, bullet points or scores. Numerical values are the most common choice of expression. These matrices can work as a foundation for decisions in simple evaluation processes. If a more complex evaluation is needed, the matrices should include numerical values and serve as a base for further analysis. When numerical values are added in a performance matrix, it follows a two-step process, which includes scoring and weighting. Each option is given a score based on scale, where the lowest value is the one least preferable and the highest is the one the most preferable. This is done for each option and criterion. Each criterion should then be weighted and assigned a numerical value based on its importance. The one with the highest numerical value is the one considered as the most important criteria. 35
56 The different weighting factors are then multiplied with each corresponding score and a new numerical value is obtained. These numerical values are then summarized for each option and the one with the highest value is the one considered as the most favourable one according to the MCA-method (Department for Communities and Local Government, 2009) Differences between CBA and MCA According to Beria et al. (2012), there are different applications areas for these two different socio-economic assessment methods. An MCA can be done both before and after an implementation of a specific project. A CBA is primarily performed before an implementation of a project, although it in rare cases is performed afterwards. The scale of the project is essential for the choice of method. If the application area is small and can be seen as micro-scale, then an MCA is preferable and if the application area corresponds to a large-scale project, a CBA is the suitable choice. The application area can be considered small if all the affected people can be consultant and influence the outcome of a project and the application area can be considered large if both the public and private costs are involved in a project. A CBA evaluates the efficiency and measurable quantifiable effects of a certain implementation, whereas an MCA is an effective method that gives a perception of the implementation. Thus, a CBA can provide a single and perspicuous result that can work as a support to a decision while an MCA concerns several criteria and merely provide inputs to the decision Comparison of strengths and weaknesses of CBA and MCA The strengths of a CBA are that it is a robust model with high validity that is commonly used all over the world. A CBA is a transparent method that uses mainly objective inputs and provides results that are independent of subjectivity and bias. The result that is provided is easily interpreted and useful for decision-makers. The strengths of an MCA are that the method uses several authentic inputs from different sectors. The inputs are weighted against each other, which provides qualitative measurements. They are also informal and weighted against each other in a fair way. The stated weaknesses of the CBA method are that it is a difficult and expensive method that requires a lot of data and inputs that can sometimes be difficult to find. Certain factors are difficult to translate into monetary values and the equity regarding distribution is not completely assessed in the analysis result and it is up to the decision maker to take this into consideration. The MCA method have several weaknesses. The method can provide a subjective and ambiguous result depending on the decision-makers. It is difficult to weigh arbitrarily conflicting parameters. Furthermore, there is always a risk of double counting when an MCA is performed. This can lead to results that are inconsistent and lack clarity and accountability (Beria et al., 2012). 36
57 6 CBA tool The Excel based CBA tool from Energiforsk (2017) was developed with the purpose of simplifying socio-economic profitability assessments of environmental projects within hydropower. The tool was developed within the project FRAM-KLIV (Framtagande av relevant och användaranpassad samhällsekonomisk modell för miljöåtgärder för kraft och liv i vatten), one of many projects within the research program KLIV (Kraft och liv i vatten), with the expectation of it to be utilized within authorities and hydropower related industry in the future. The actors included in FRAM-KLIV were Anthesis Enveco AB and scientists from Luleå Tekniska universitet, Sveriges lantbruksuniversitet in Umeå and Handelshögskolan in Stockholm. The aim of FRAM-KLIV was to produce a user friendly as well as theoretically and empirically relevant tool that addresses uncertainties and is accepted by the stakeholders of KLIV. During the development phase, the tool was tested by a group of stakeholders. The viewpoints that emerged were used for further development of the tool. The CBA tool is based upon modern CBA theory, which constitutes the foundation of what questions the tool can and cannot answer. The socio-economic profitability assessment in the CBA tool is carried out by calculating the NPV of the project, based on the conversion of consequences to monetary values. Some issues can be addressed with supplementary methods such as MCA. During the development of the tool, a number of simplifications were made to make the tool user friendly and empirically relevant. Also, a method for dealing with uncertainties was developed. The tool can be used for several different types of socio-economic profitability assessments, ranging from small-scale environmental measures to large-scale projects, with several measures within a certain catchment or area. The usage of the tool is highly limited to the availability of data. In the CBA tool, the resulting report is based on the assumption that the analysis is performed before a project has been carried out, but it can also be used during and after implementation. The tool also has a financial analysis function, as it in some cases can provide useful information, and a distribution analysis function, to show how positive and negative consequences are distributed in society (Energiforsk, 2017). The tool divides the CBA procedure into eight different steps, where some have a number of sub steps. The steps are further elaborated in the following sections. Problem definition The section Problem definition is included for the purpose of the resulting report and provides a background to the project. The problems that the project aims to resolve should be defined. Also, the context of the problem needs to be defined and include a justification of in what way it constitutes a problem. For clarification, the problem definition should include a short explanation to why the problem has occurred and define the scope of it. It can also be beneficial to define the geographical delimitation (Energiforsk, 2017). 37
58 Purpose definition In this section, the purpose should be defined. It should cover what needs to be accomplished in order for the problem to be resolved, preferably in a quantitative way. However, it is usually only possible to describe it in a qualitative way. One of the purposes of this definition is to enable the possibility of finding eventual conflicts between the problem solution in question and other issues in society. Conflicts such as these could potentially inflict on the final evaluation on whether or not to implement the project in question (Energiforsk, 2017). Reference alternative This section should describe the reference alternative, which is the alternative scenario that the project alternatives should be compared to. Usually, this is defined as the Business-As-Usual (BAU) scenario. The reference scenario should be comprehensively described and motivated over the full time horizon of the project analysis. The choice of reference scenario highly affects the result of the CBA, as it is constituted by the comparison of the profitability of the project in question compared to the reference alternative. Thus, the reference scenario must be determined with caution (Energiforsk, 2017). Identification and description of project This step should include a temporal and spatial description of the project. The description should be comprehensive and identify all possible solutions to the project. To increase the chance of finding a feasible project to achieve the defined purpose, the description should preferably be carried out through a collaboration between different types of expertise, decision makers and affected groups. If different project alternatives are up for discussion, they should all go through the same description process. The project proposals should be compared to the reference alternatives and solely include the actual difference between the two. For validity, background factors or conditions such as environmental politics and energy supply should be the same in all scenarios, except in rare situations when one of the project alternatives affects one of the parameters. When several projects are up for discussion, they are often different configurations of an environmental measure at a specific location. The different project proposals can also be environmental measures at different locations in the same or a couple of different waterways. In this step, the lifetime of the project also has to be determined. Usually, it is recommended to emanate from the lifetime of the components used within the project. It is important to consider that benefits can sometimes continue to appear even after the lifetime of a component is completed. It is also important to consider the definition of the reference alternative, as this determines the preconditions of the project effects. The lifetimes of the effects are usually not homogeneous and the defined time horizon for each effect needs to be coherent with its individual lifetime. Thus, the effect with the longest time horizon will define the lifetime of the project. Sometimes the lifetime of a project is prolonged through reinvestments. An example of this can be the construction of a fish ladder with a lifetime of 30 years that is partially renovated after the completion of its lifetime. The renovation will prolong the positive effects on the environment. Another example is the running costs of maintaining the effects of an environmental measure. 38
59 If different project proposals have different time horizons, the analysis becomes more complex as the varying lifetimes must be made comparable. The Excel based CBA program can only handle time horizons of maximum 150 years. Usually, one tries to find the lowest common denominator and multiply the lifetimes with this value to make them equal, assuming that reinvestments will be made. If the assumed extended lifetimes exceed 150 years, the calculations have to be performed outside the program. Sometimes the extended lifetimes, with reinvestments included, do not add up to an equal number of years without looking too far in the future. However, if the discount rate is determined as distinctly positive, the impact of consequences taking place after 100 years will be small, which will consequently result in a smaller error if the assumed extended lifetimes are still unequal. Another alternative is to round up or round down the lifetimes, if the difference between them is relatively small. However, this can only be done if it can be considered legitimate without significantly reducing the validity of the result. Sometimes, an exogenous time horizon is given, which differs from the lifetimes of the different project alternatives. This can be the case if the projects aim at reaching a certain goal for a specific year, such as for instance EU's water directive. In order to compare the different project proposals, their lifetimes need to be adjusted through reinvestments. If the given exogenous time horizon is shorter than the lifetime of the project and many of the positive effects appear during the later years, the resulting output will be misleading. Also, a project proposal with a low NPV might still have more benefits on a short-term, which could potentially make it better than other alternatives, with higher NPVs, due to the limitation of the given exogenous time frame. For these types of analyses, the CBA tool computes an NPV for the total lifetime of the project and specifies how large the fraction of the so called salvage value is for the years exceeding the exogenous time frame. This provides the executor with information about what will happen within the given time frame and during the entire lifetime of the project. An inconsistency with this approach is that although the exogenous time frame is given, there is still a need for a reference scenario for the remaining years of the lifetime. The identification and description step should also include a list of the groups, or actors, in society that will be affected by an implementation of the project (Energiforsk, 2017). Identification of consequences Step five comprises an identification of the project s possible consequences on the human population. A comparison with a reference point should be made in order to provide an indication on how much the humans and society are affected by a project. The effect, which are evaluated in this step, mainly regards the human availability of ecosystem services. At this point, a limitation of the project should be made, and the affected people should be identified. If the affected population is limited to a specific area, then the limitation would be that area or the surrounding municipality. In a CBA of a project in Sweden, one often limits the effects to the people within the Swedish borders. However, it is possible that a project has some kind of effects even outside its limited area. The consequences which might occur due to a specific project should be identified and evaluated by a relevant expert (Energiforsk, 2017) Classification of consequences The Excel tool requires inputs in form of gross identification of the project's consequences. Firstly, the consequences should be classified and divided into different categories, where it should be stated whether the measures entail a small profit, large profit, small cost, large cost or no effect at all. The purpose of this step is to provide an overview of the parameters that have 39
60 the largest impact on people s well-being. It also provides an overview on how the parameters can be put in relation to each other. The consequences that cannot be measured in monetary values will only be mentioned in text and will not be further evaluated. However, if it is possible to put a monetary value on the parameter, it will be included in the calculation of the NPV. The gross consequences, which are commonly affected parameters for hydro related projects, are classified and divided into different groups. The aim is to provide a full overview of all impacts within ecosystem services in rivers. The services are divided according to Naturvårdsverket s classification system and consist of four different groups. The first one is Provisioning ecosystem services, which regards the goods that are produced. The second group is Cultural ecosystem services and concerns inspirational, recreational, aesthetic and spiritual values that contribute to the human wellbeing. The third group concerns the Regulating ecosystem services, such as the profit people gain by ecosystem functions, which could for example be climate control. The fourth and last regards the Supporti ng ecosystem services, which are the fundamental and underlying structures and processes for ecosystems, for instance do the oxygen production falls under this category. The tool provides an example list of parameters likely to be affected within each of these categories. The user can use them as a base and state whether the consequence will entail a large or small profit or cost. Consequences that are not already provided by the tool can easily be added to lists and the analysis by the user (Energiforsk, 2017) Allocation and actor analysis The next sub step is to identify the different groups and actors that will be affected by the project and sort out which actors that will be affected in a positive way and gain the most profit of the project and which actors that will be affected negatively and be subject to the major costs. This identification will serve as base for the allocation analysis of the costs and profits. The tool provides a list of actors which are likely to be affected by a hydro related project. The user can utilize these example actors or alternatively, add new actors to the tool. As a complement to the actor analysis in the CBA tool, a further external actor analysis can be performed in order to obtain an overview of how specific actors interests influence projects. This kind of analysis provides a deeper understanding on how, for instance, exposed groups with small influence are affected in comparison to actors with a large influence. For example, a large company could have a much bigger influence of a decision regarding an implementation of a project than a smaller actor. The analysis also provides information regarding actors specific interests in different projects, which can mainly be associated with how much an actor will gain or lose with an implementation of a project (Energiforsk, 2017). Compilation of consequences This step addresses the transition from a gross to a net identification of the identified consequences of the project proposals. That is, the different direct and indirect consequences on human well-being should be identified and sorted. The importance of this step lies within the importance of not double counting direct and indirect impacts when performing the valuation in step seven, which should solely be performed on the direct consequences. Also, the actors affected by the consequences must be identified. As complementary information to the resulting report, the relation between the project proposal and VISS (Vatteninformationssystem Sverige) 40
61 measures, further described in section , as well as Natura 2000, further described in , ecological status or potential in waterways should also be identified and described (Energiforsk, 2017) The value of ecosystem services and the chain of value creation In economic terms, ecosystem services can be estimated in their Total Economic Value (TEV). The services can be divided into user and non-user values. There is also another group, opportunity values, mentioned in section The different groups are presented in Figure 2. Figure 2. User and non -user value groups derived from the TEV of ecosystem services. Modified after Naturvårdsverket (2012). The services are sorted by the way humans utilizes them. The direct user values comprise the direct usage of the service, which could for example be recreation or wood. Indirect user values are usually derived from regulated ecosystem services such as water regulation and nutrition removal from water. These services indirectly provide protection and security. The opportunity values are related to the possibility of using a service in the future. Non-user values are usually divided into existence, altruistic and heritage values. The existence values apply to the WTPs for the existence or conservation of a service, although the individuals might never utilize or consume the service themselves. Altruistic values relate to the value of knowing that other people might be able to utilize the service. Heritage values relates to the value of knowing that future generations will be able to use the service (Naturvårdsverket, 2012). Although direct values are in general significantly easier to estimate, it does not mean that the indirect values are unimportant. Ignoring these types of values in a socio-economic analysis can lead to high underestimations of the actual societal value of the ecosystem services. Important services are the so called collective services that can be used by multiple people without degradation. An example of this type of service could be air cleaned by an ecosystem (Energiforsk, 2017) Quantification of ecological impacts It is important to quantify the ecological impacts, as it is essential for the upcoming identification of how these will affect the society. To assess these impacts, it is common to use different types of models. There are several ecological models used for this purpose, some more advanced than 41
62 others. The user needs to have knowledge within ecology and understand how the impacts can affect the ecosystems in question. In order to acquire parameters for the model, extensive measurements are usually required. For the more advanced and detailed models, scientific expertise is usually required as well as a high budget. The selection of ecological model should be directly related to the scope of the project. If the scope is broad and extensive, an advanced model is usually required. However, it might be time and cost beneficial to initially use a simplified model to see which environmental effects that can be expected. If the result of the simplified model does not indicate any environmental benefits, it is highly likely that a more advanced model will give the same result (Energiforsk, 2017). For the scope of this thesis, no specifics of these models will be provided. See pages in the report Samhällsekonomisk lönsamhetsbedömning av miljöåtgärder i vattendrag by Energiforsk (2017) for more information about the models Impacts on ecological status or potential and conservation status The impacts on ecological status or potential and the conservation status are optional additions to the tool and does not affect the resulting output of a CBA. However, it might be of importance if the project proposals need to be assessed with regard to requirements such as water management or nature conservation regulations. It can also provide some assistance for the CBA executor to determine whether or not the analysis includes all different groups of consequences. The CBA tool provides the possibility of adding whether the project proposal is a recommended VISS measure or not. It also provides the opportunity of inserting the project alternative s impacts on the ecological status or potential in waterways, where the waterways affected should be specified with regard to their name and ID number. The inputs should include the current ecological status and potential as well as the effective Environmental Quality Standard (EQS) of the affected waterways. Whether the project proposal is a prerequisite to fulfil the EQS or not should also be inserted. The CBA tool also gives the executor the possibility of inserting the impact on conservation values in Natura 2000 areas. The names and ID numbers for these Natura 2000 areas should be specified as well as the relevant habitats and species. The CBA executor should also insert whether the project is a prerequisite to attain or maintain a favourable conservation status or not (Energiforsk, 2017). Valuation of consequences This step addresses the computation of the costs and benefits of the project. The effects should be expressed in monetary values. If an effect cannot be monetary valued, it is possible for the user to do a so-called non-monetary valuation. The purpose of the CBA tool is to conduct a socioeconomic analysis, but it also offers the possibility of performing a financial analysis (Energiforsk, 2017) Inflation, NPV and price prognoses Due to inflation, there is a difference between fixed and floating, or real and nominal, prices. In fixed prices, the inflation effect has been accounted for. This can for instance be done through the usage of a Consumer Price Index (CPI). In a CBA, it is recommended to use fixed prices and interest rates, to simplify the calculation. If floating prices or rates and a CPI are to be used, the 42
63 transformation is carried out using Equation (3). The base year represents the year chosen for the analysis result, usually the same as the current year. Real value (base year) = Nominal value ( year X) CPI ( base year) CPI ( year X) Equation (3) If the user wants to use foreign studies to approximate the WTP for a benefit, a so-called Purchasing Power Parity (PPP) must be used. A PPP offers the possibility of estimating and comparing the price level on services between different countries, by calculating the exchange rate needed to make the purchasing power equal. It can be difficult to predict price development and events that might occur within the project time horizon. Sometimes it is possible to use available predictions such as the predicted electricity price development from Nord Pool or alternatively, to look at historical data to see if the real value has had a steady increase or decrease during a long time period. If so, the curve can be extended to estimate the future value. Sometimes there are no predictions available and, in these situations, it is possible to use the growth rate of the Gross Domestic Product (GDP) per capita to find the general real price increase over time. The growth rate represents the change in real income and WTP, if one assumes that the WTP increase is correlated to the real income increase. Sometimes there is no reason to expect a change in the real value, and a constant real price can then be used for the CBA. The price prognosis should later be assessed in the sensitivity analysis. After that the different costs and benefits have been quantified and expressed in monetary values, the NPV can be calculated. The theory of NPV is explained in section (Energiforsk, 2017) Sensitivity analysis The CBA tool can address uncertainty and sensitivity in different ways. The user has the opportunity to either use fixed values with intervals or to perform a statistical probability distribution through a simulation analysis for the monetary values of the effects. The Monte Carlo analysis offers a more advanced sensitivity assessment. When performing a CBA, it is common that several parameters are not known and has to be estimated. This can for example be values related to future costs or benefits, but sometimes also current values. In a project that is expected to last for a long time, i.e. a project with a long time horizon, precision in the selection of discount rate is crucial. A Monte Carlo analysis provides a more complete estimation of the uncertainty, especially when there are several uncertain parameters. Usually, the uncertain values are replaced by probability distributions. There are a number of different probability distributions and the CBA tool offers the possibility to choose between uniform, lognormal, symmetric triangular and asymmetric triangular distribution. The normal distribution together with the different probability distribution plots used in the CBA tool are presented in Figure 3. 43
64 Figure 3. The normal, uniform, lognormal and triangular probability distribution (Energiforsk, 2017). No matter the distribution selected, the Monte Carlo analysis computes the net profit for each alternative and repeats the calculation for a specified number of iterations. Eventually, the result will diverge to a certain theoretical mean value with a standard deviation. The higher the number of iterations, the smaller the standard deviation and the larger the convergence of the mean value. The uniform distribution is the simplest of the four alternatives and only requires an interval between two values. The normal and lognormal distributions require a mean value and a variance, whereas the symmetric and asymmetric triangular distributions require an interval between two values together with a value representing the maximum density, the so-called mode. In the CBA tool, the lognormal distribution can be inserted using a mode value, or best guess, together with a value that the user estimates to the 97.5 percentile of the sample. Which distribution that is suitable for the analysis is case dependent. If the uniform distribution is applied, all outcomes will have the same probability within a given interval. Thus, it is assumed that an interval can be defined for all parameters and that all outcomes are equally probable. The uniform distribution is preferable, to apply in situations where there is a limited amount of data. If a probability interval of a parameter can be given with a certain precision and the probability of different outcomes can be estimated, the triangular distribution is preferable. The triangular distribution shows similarity to the normal distribution, although simplified. The normal distribution is the most commonly used distribution method in statistical analysis but is not available in the tool (Energiforsk, 2017) Costs of environmental measures Often, the costs related to a specific activity are estimated during the project development. If that is not the case, there are a couple of aids used in order to estimate the costs of different environmental measures. Typical tools used in these situations are studies and reports as well as guidelines from the national database for measures in water, Åtgärder i Vatten, County Administrative Boards and VISS. In VISS, it is possible to find certain standard rates for different 44
65 environmental measures in water. However, factors such as production losses, application rates and maintenance are not included. It has been identified that the standard rates do not always match real costs, when compared to real life cases. In many situations, especially for smaller plants, the VISS estimations are far too low compared to the real costs. There have not been a lot of cost studies on larger power plants and hence, there is an even higher uncertainty related to the VISS estimations. Overall, the VISS estimations seldom correspond well with reality and it is recommended to look at studies on projects similar to the one in question (Energiforsk, 2017) Carbon credits As hydropower does not emit GHGs during production, it is not affected by the EU Emission Trading System (ETS). Some of the services used during renovation and remodelling activities might cause emissions, but usually these are rather small projects that do not affect the overall price of carbon credits. Hence, costs of damage related to emissions does generally not have to be considered. However, if the activity in question causes a reduced electricity production, another energy source must be used. What type of substitute electricity that is used varies and can be identified by studying the Nord Pool market. Currently, Danish coal power is the replacement electricity, but depending on the development of renewable energy, this might change. However, Energiforsk (2017) currently recommends using Danish coal power in these types of calculations. If performing a financial analysis on an activity covered by the ETS, the emissions must be assessed and evaluated regarding production and price of the carbon credit The socio-economic discount rate The CBA requires a discount rate in order to perform the NPV calculation. A socio-economic discount rate can be different than the financial discount rate due to other requirements regarding the rate of return (Energiforsk, 2017). Real or nominal discount rate There are two types of discount rates that can be used in NPV calculations, real and nominal discount rate. The real discount rate is the rate obtained if the inflation or deflation is removed from the nominal discount rate. The real discount rate is preferable in NPV calculations (Energiforsk, 2017). Discount functions The discount rate can either be chosen to be constant or decreasing. Traditionally, a constant discount rate is used and normally lies between 4 and 10 %. However, it depends on the current recommendation for both the utilized country and for Europe. If the investment concerns a project of over 50 years it can be seen as long term investment and a hyperbolic discounting is preferable. The discount rate will then decrease over the years where the mainly cost and revenue will fall on different generations (Energiforsk, 2017). 45
66 Discount rate The real discount rate can be stated as either a constant value through the entire project lifetime or as a varying rate. The proposed real socio-economic discount rate for a CBA in Sweden correspond to %. However, a further sensitivity analysis regarding the real discount rate is recommended when a CBA is performed (Energiforsk, 2017) Valuation of environmental improvements The valuation of environmental measures can be evaluated in different ways. Four different approaches are described in the subchapters Monetary valuation of measures within the environment and culture As described in section there are mainly two different ways to evaluate certain environmental and cultural effects in monetary values. The first option is survey-based where a hypothetical scenario is created and the response from the survey is used to put a monetary value on the environmental and cultural measure. Preferably should a specific evaluation of the location in question be conducted. However, it is often both costly and time consuming. The other option valuates the measure through people s behaviour and preferences (Energiforsk, 2017). Value transformation as a method to value environmental changes A monetary valuation is often both costly and time consuming and it might be more efficient to instead reuse a previous study and translate it for usage in the new study or project. Often, a lone environmental measure can result in several different effects on the ecosystem. Therefore, environmental studies are usually evaluated holistically, where all different aspects are considered as one. This simplifies the evaluation and the analysts are able to compare the old package with the new package, instead of quantifying and comparing each individual change alone. The simplest method regarding these types of transformations is called point value estimation. The value obtained per person or household in the previously performed study should simply be corrected by the inflation and a new value per person or household is received. A drawback with this method is that it is likely that the income level will be increased as well, which is not considered. Furthermore, this can be considered in an income corrected point value estimation. As the name of the method indicates, the values are corrected with regard to changes in income. Valuation studies often provide an indication of the WTP and also often an indication of underlying factors, such as education level, income and age. If these kinds of values are known for both the old and new location, the result can be updated and translated to represent the new location. However, the more factors that are considered, the bigger the uncertainty. If previously performed evaluation studies exist for similar types of environmental measures, it is often best to use an average of these and then correct them regarding to income and price (Energiforsk, 2017). 46
67 Monetary valuation of environmental measures In order to simplify the process of putting monetary values on environmental measures, Energiforsk has created a database that compiles results from previous evaluation studies. As for now, it mainly consists of environmental measures associated with hydropower production. At this time, the database consists of ten different studies, where six of them were performed within the Swedish borders. The measures that the studies are based upon are different from each other and are based on different parameters. One could for instance be based on the increase of a fish population and another one could evaluate a different kind of environmental consequence (Energiforsk, 2017). Non-monetary valuation of environmental measures In situations when it is not possible to assess the environmental improvements in monetary values, a non-monetary valuation can be made in the CBA tool. Yet, it will not be a part of the NPV calculation in the performed socio-economic analysis and will solely be mentioned in text in the final report created by the tool. A non-monetary evaluation can be approached in different ways, tentatively through a qualitative valuation, where the value is described in words or a semi-qualitative valuation, where the values are expressed on some kind of scale and a higher achieved value correspond to a larger improvement of the environment. It could possibly also be described as quantitative valuation, where the value is expressed in some kind of physical unit, for instance a specific amount during a period of time. If there exist a market value on the increased production, it can often be translated into a monetary value. The main idea with defining a value of an environmental improvement is the same for both monetary and non-monetary values and it is to give an indication on how much the consequences affect the human well-being (Energiforsk, 2017) Taxes and subsidies From a CBA standpoint, taxes are simply an allocation of money from the private sector to the public sector and thus does not affect the net result of the calculation. However, internalized taxes, such as carbon tax and other taxes associated with external damage, must be considered separately as they aim at reflecting the impact of the project on an external part. Regarding the costs of the project, it is recommended to discount the taxes. The benefits of a project should, on the contrary, be evaluated including taxes, as they are measured as WTP. This since value-added taxes (VAT) are included in the market price of a service or a good and thus also a part of the WTP (Energiforsk, 2017) Socio-economic valuation of the change of power production If the electricity production is reduced in one power plant, it needs to be compensated for by another one. This entails a loss for the producer and the size depends on the spot market price and the compensatory production could possibly entail other socio-economic costs depending on the source of the power generation. To approximate the cost of the loss the Nord Pool spot prices can be used (Energiforsk, 2017). 47
68 6.7.9 The valuation of impacts on the regulated hydropower The Swedish energy agency, HaV and Svenska Kraftnnät have sorted the Swedish power plants into three different classes depending on their regulation ability. The first class represents the hydropower plants with the highest regulating ability and consequently the most important for balancing the grid. There are approximately 250 power plants included in the first class. These plants have a high importance due to their regulating capacity and should be classified as HMWB, with corresponding EQSs and related exceptions in comparison to an NWB. Environmental measures that might affect the regulating capacity of the power plant in a negative way should consequently be avoided to the furthest extent according the classification system. However, there are a couple of exceptions such as laws, regulations and directive related to the preservation of habitats and species. In these situations, a socio-economic analysis is consequently not required for the measure in itself but can be used to evaluate different alternatives that aims to achieve the requirements defined by the regulation. Measures that do not affect the regulating capacity of the power plants in class one can be carried out through a normal procedure wage (Energiforsk, 2017) Valuation of the impact of the emissions on the environment and climate Emissions from sectors that are covered by the ETS are already accounted for and thus does not need to be included in the CBA. However, the amount of emissions from other sectors producing material that will be used in the project in question, must be considered. For sectors that are not included in the ETS, Energiforsk (2017) recommends using the Swedish carbon dioxide tax as a rough estimation. A sector subject to this type of evaluation can for instance be road transport. Forestry, land use and international shipping are excluded from these calculations. The production industry has received a lower carbon dioxide tax for competitiveness reasons. The general carbon dioxide tax used in Sweden was 1.12 SEK/kg CO2 in 2015, which can be applied in the calculations. To simplify the analysis, it is recommended to solely evaluate the direct emissions from the project and exclude the emissions emanating from the material production. Instead, it can simply be assumed that the damage costs are covered by the carbon dioxide tax paid by the producer and that it is covered by the cost of the material. Apart from GHGs, there are also other type of emissions that can harm humans and the environment. Some emissions have an excise tax, but Energiforsk (2017) recommends excluding this tax from the cost and instead calculate the cost as the marginal environmental damage cost. Some environmental measures cause a production reduction. The non-produced power must therefore be replaced by some other power in order to maintain the balance of the energy system. As mentioned in section 6.7.4, Energiforsk currently recommends assuming Danish coal power as the replacement power, which usually is the energy source on the margin of the electricity market in the Nordic countries. Coal power causes emissions of nitrogen and sulphur oxides, which damage costs needs to be included in the CBA. There are a couple of online tools that can be used for these types of evaluations or estimations, such as Ecosense (EcoSenseLE, 2017), which calculates the damage costs of electricity and heat production (Energiforsk, 2017). 48
69 Distribution analysis, sensitivity analysis and conclusions The last step is the simulation of the inserted data. If the data is inserted as a distribution, the simulation is performed through a Monte Carlo analysis and the result is obtained in form of an NPV. The tool also creates a result report that includes a distribution analysis, showing how the costs and benefits are allocated between the different actors affected by the project. The result also comprises a sensitivity analysis in form of an probability distribution, if any of the input data was inserted as an interval. The user can thereafter draw conclusions from the result and add them to the report with the rest of the results. 49
70 7 Methodology This chapter describes the methodology for the CBA of the trap-and-transport solution in Edsforsen hydropower plant. Section 7.1 comprises a thorough description of Scenario 1, where the consequences and actors are identified and evaluated, following the recommended steps of a CBA. The Monte Carlo analysis used for the simulation in the CBA tool is in itself a sensitivity analysis, but to further investigate the importance of different parameters and the significance of alterations in the inputs, additional sensitivity analyses were performed. These sensitivity analyses were created as new scenarios that were based on the original scenario, Scenario 1, with minor alterations, and these are described in section 7.2. Scenario 1: Edsforsen This section describes Scenario 1, the original scenario. Scenario 1 serves as the basis of the other scenarios described in section 7.2. All specific input values for Scenario 1 are compiled in Appendix A Problem definition The wild anadromous trout and salmon of Klarälven are relatively unique species seen from a global perspective. In order to reproduce, anadromous salmonids need to migrate from Vänern upstream Klarälven river to reach the river stretch between Edsforsen and Höljes, an area with good spawning conditions. Today, there are no fishways in Klarälven, which constitutes an issue for the migrating fish (Greenberg et. al, 2018). Since the 1930s, a trap-and-transport solution has been used to trap upstream migrating fish and drive them upstream before releasing them into the river stretch between Edsforsen and Höljes. In the present day, the trap is located downstream Forshaga hydropower plant. Before the power plant in Forshaga was constructed, the trap was located downstream Dejefors hydropower plant (Fortum, 2017b). After the spawning period is finished, the kelt must transport itself downstream Klarälven to get back to Vänern. The fry stays in the river stretch between one to three years to grow into smolt before they start their downstream migration. When the smolt and the kelt are to transport themselves downstream, there are no available fishways that allow a safe passage through the eight remaining hydropower plants before Vänern. A study by Norrgård et al. (2013) showed a smolt survival rate of about 16 % in Klarälven, while another study showed about 30 % (Gustafsson et al., 2015). Thus, the survival rate is low. It is likely that the smolt and kelt mortality is partly due to predation and natural limitations, but also due to the presence of power plants. Due to the high mortality, the general view is that there is a need of increasing the survival rate of fish migrating downstream Klarälven. An increase in the wild salmonid population of Klarälven would have a great nature value and be beneficial for the biodiversity (Greenberg et al., 2017). According to Greenberg et al. (2018), their view is that a long-term biological strategy for Klarälven should be to rehabilitate the river where all the humanly constructed fish barriers should be made passable and the flow regime should allow for conservation of the natural habitat and species populations. The most important identified issues regarding salmonids in Klarälven are the trap efficiency at Forshaga power plant and the survival rate of the downstream migrating fish. Hence, on a short-term, the management of Klarälven should focus on receiving quick results regarding these aspects (Greenberg et. al, 2018). 50
71 7.1.2 Purpose definition The purpose of the Edsforsen project is to increase the survival rate of the downstream migrating wild kelt and smolt by creating an efficient transportation solution. The aim is to increase the survival rate of the migrating salmonids by diverting them from the turbine intake at Edsforsen and collecting and transporting them down to Forshaga power plant. They will be released downstream the power plant, which will enable free migration all the way to Vänern. With the implementation of the project together with an efficient dredging of the diverter and fishway, the aim is to reach a trap efficiency of 100 % of downstream migrating salmonids. However, there are only a few global examples of this type of implementation and as this project would be the largest implementation yet as well as it is facing geographical issues, it is more reasonable to assume a trap efficiency of less than 90 %. Considering the fact that the project implementation would act as a sole replacement to having fishways connected to all of the eight power plants, a downstream trap-and-transport efficiency of merely 43 % would correspond to the same efficiency as fishways with a 90 % passage efficiency would be connected to each one of the eight power plants (Greenberg et. al, 2018) Reference alternative The regulation of Klarälven together with the lack of fishways between Forshaga and the spawning area located between Edsforsen and Höljes hydropower plants, are two aspects that have caused a reduction of the wild salmonid population. Compensation activities such as pisciculture and upstream trap-and-transport from Vänern up past Edsforsen power plant are in operation, but there is no helping mean of downstream migration. Migrating fish must therefore pass through eight power plants before reaching the lake of Vänern. Consequently, the survival rate is low. Between 2011 and 2014, the behaviour of the spawned salmonids was studied. During the time period, an average of 47 % of salmon kelts survived the spawning period and began their downstream migration. Female salmon kelts mainly started their migration during spring, whereas the behaviour pattern for male salmon kelts varied between different years and took place both during spring and fall. At Edsforsen, 81 % of the salmon kelt managed to get past Edsforsen power plant during the time period between 2011 and During the years of 2013 and 2014, only 41 % survived this passage. During the former time period, the spillage represented about 51 % of the total flow on average. During the latter time period, the spillage was significantly lower and solely represented about 20 % of the total flow on average. Hence, the spillage was identified as an important factor for the survival rate. A total of 50 salmon kelts were studied during the time period between 2011 and 2014 and only 2 % of the studied kelts managed to reach Vänern. This percentage represented one individual for three years. During the time period between 2011 and 2014, 43 % of the trout kelts survived the spawning period and began their downstream migration. During the studied time period, 8 % of the trout kelts managed to reach Vänern (Greenberg et al., 2018). In a study performed in 2009 by Norrgård et al. (2013), it was found that the survival rate of smolt migrating downstream Klarälven through the eight power plants from Edsforsen down to Vänern was 16 %. When a similar study was performed in 2013, when there was larger amount of spill, the smolt survival reached 30 %. The studies were made by tagging the smolt with acoustic transmitters and when the smolt passed certain locations a receiver picked up a signal (Gustafsson et al., 2015). 51

72 7.1.4 Identification and description of project To enable a safe passage for the downstream migrating fish in Klarälven, it has been found that the most efficient solution would be to construct a diverter where the fish could be trapped at Edsforsen and later on transported and released downstream Forshaga power plant. Different possible proposals were developed and the Consultant company Norconsult was assigned the task to evaluate different solutions and conclude which one was the better alternative, considering parameters such as mortality and cost. The overall evaluation showed that an option called single-beta diverter would be the most preferable solution (Norconsult, 2017). A beta intake diverter is a type of horizontal grid which is mounted horizontally with a 30 gradient in relation to the water flow. In addition to the beta diverter, it is also proposed that a rubble pier should be placed upstream of the facility. The aim with the pier is to create a more favourable flow and the formation is based on hydraulic models of the water flow towards the turbine inlet. The influx losses will be minimized as a consequence by the pier (Norconsult, 2017). A formation prototype of the beta diverter can be seen in Figure 4. Figure 4. The proposed formation of the single -β diverter at Edsforsen hydropower plant (Norconsult, 2017). The diverter would be constructed in steel and the distance between the bars would be dimensioned to 15 mm. The surface of the diverter would be 65 m wide with a height of 5.2 m. The diversion would take place by using an adjustable floodgate that diverts the fish to the already existing log driving flume (not used for logging any more). Thereafter, the fish is led to a sorting system, where it is sorted and trapped for manual transportation in lorries downstream (Norconsult, 2017). The proposed diversion facility can be seen in Figure 5. 52

73 Figure 5. The proposed diversion facility at Edsforsen hydropower plant (Norconsult, 2014). Downstream view. The evaluation of the construction of the single-beta diverter was mainly based on five different parameters: construction and building technique, production loss, cost, fish and operational functions and dam safety. The construction and building technique mainly regards the practical functions such as cleaning and dredging devices, diversion gates and the trap. It also concerns the complexity of constructing the facility and the equipment. Due to the lack of similar facilities in Sweden, there are several uncertainties regarding the design of the diverter and the relating equipment. The large amount of debris that reaches Edsforsen power plant can cause damages to the facility, which is why robust cleaning and dredging devices are required. It is further proposed to place a log boom upstream to hinder large debris to reach the facility. The production losses occur due to a partial plant shutdown during the construction time. The total construction time of the entire trap facility is estimated to 28 months. A few of the elements can be constructed in parallel and it is assumed that the total construction time would correspond to two years. A cofferdam would be built, to enable generation in one of the two turbines during the first 18 months and the loss will therefore correspond to 50 % during this period. The loss during the last 6 months is estimated to 100 %, due to a total occlusion of the power plant during this period. The total investment cost is estimated to reach an amount of about 122 MSEK., in the currency of The breakdown of the investment cost, Capital Expenditures (CAPEX), is presented in section and a breakdown of the maintenance costs, Operating Expenditures (OPEX), can be found in sections and As the project is in a relatively early stage and the cost calculations are rough estimates containing several uncertainties, more thorough calculations are necessary to reduce the uncertainties (Norconsult, 2017). Regarding the fish and operation function, the single-beta diverter solution is expected to work well as a passage option for the fish. The distance between the grid bars together with the placement and tilt of the grid will prevent the fish passage through the turbines and lead the fish to the trap in an efficient way. However, during periods with a high amount of spill, there is still 53
74 a risk that some of the fishes will choose the path through the spillways and consequently reduce the efficiency of the trap (Norconsult, 2017). The operation of the intake is estimated to become a bit more complicated in comparison to the situation today. Due to the reduced distance between the bars of the grid, there is a higher risk of issues such as frazil icing and trash collection at the fish trap floodgate. The dredging facility is not well tested in Sweden, although the construction is relatively simple (Norconsult, 2017). The dam safety classification of Edsforsen needs to be considered when the trap facility is planned and constructed. There is a risk that the cofferdam will have an impact on the discharging capacity of the closest spillway and flume during the construction. This means that the total discharge capacity of the four remaining segment gates must be able to handle the floods during the construction period (Norconsult, 2017). Norconsult (2017) estimated the depreciation time of the power plant to 40 years. Based on this, it is assumed that the lifetime of the project is 40 years. The beta diverter and the log boom are likely to be replaced earlier than that and Uniper (2018) estimated their lifetime to roughly 20 years. The cost calculation therefore needs to include the replacement of the diverter Identification of consequences In this step, a gross identification of the consequences of the project is performed. The consequences are also classified regarding the magnitude of their impact, where the benefits and costs are sorted into different groups. Depending on the importance of the impact, the consequences are divided into small and large benefits and costs. Identified benefits Two major benefits of the project are the supportive and regulatory ecosystem service of an improved salmonid habitat and the salmonid habitat as a cultural non-user existence value. As the survival rate of downstream migrating smolt and kelt is expected to improve significantly, see section , it can be assumed that the habitat as a supportive and regulatory ecosystem service consequently improves substantially. Also, as the wild salmonid population increases, it creates a cultural non-user existence value for the public as well. The supportive and regulatory ecosystem service and the cultural non-user existence value are both assumed to be classified as large benefits. Identified costs The identified costs of the project are the investment, maintenance and production loss together with the costs of emissions from replacement power. Although the production reduction is loss of revenue, it is still considered a cost in a CBA. Labour costs were excluded from the model due to the limited information available on the number of workers and expertise required for the implementation of the project. The emissions, production loss and maintenance are assumed to be relatively small and are therefore classified as small costs, whereas the investment cost is regarded as large, as the project implementation will require significant capital expenditures. 54
75 Actors The actors that have been identified to be affected by this project are the power company, Fortum, and the public. Fortum will experience the costs of implementing the project, i.e. the Capital Expenditures (CAPEX), the production loss and the annual Operating Expenditures (OPEX). The public will receive the value of an increased wild salmonid habitat and will not experience any costs, apart from the societal and environmental damage caused by the Danish coal replacement power for the production loss in Edsforsen. Actors that were discussed but ignored in the CBA were recreational and professional fishing, the local fishing conservation agency, local businesses and the municipality. As it is currently not allowed to catch the wild salmon, it was concluded that these actors will not be affected significantly. As there will be no increased fishing possibilities, it can be assumed that the tourism will not increase. Thus, the economic flows of the municipality and local businesses should not be affected significantly Compilation of consequences This step consists of a net identification of the direct and indirect impacts and whether the project is a VISS measure or a requirement for reaching water body specific EQSs. Direct and indirect impacts All consequences are regarded as having a direct impact on human s well-being, except from the supportive and regulating ecosystem service of an improved habitat. Quantification of ecological impacts In a study by Norrgård et al. (2013), it was found that the survival rate of smolt migrating downstream Klarälven through the eight power plants from Edsforsen down to Vänern was 16 % in 2009 but when a similar study was performed in 2013 the amount corresponded to 30 % (Gustafsson et al., 2015). Greenberg et al. (2018) estimated the expected capture percentage, of the implementation of the trap, based on the spill and hydraulics of the power plant. They assumed that the fraction of fishes that goes towards the turbine and consequently the trap is directly correlated to the relative flow through the power plant. Hence, a larger spill will cause more salmonids to take the wrong way and go through the spillway gates separated from the turbine intake, which consequently will lead to a lower capture percentage. Depending on the turbine flow and based on flow data from the years between 2003 and 2009, the estimated capture ranged from 76 % to 100 %, with the majority of the values above 80 %. In the CBA simulation, it is therefore assumed that the capture percentage of the new downstream trapand-transport facility will be 80 %. Studies performed by Piccolo et.al (2011) indicated that approximately 1 % of the released hatchery salmonids return for spawning. The hatchery salmonids are not transported upstream for spawning and the percentage returning rate of wild salmonids are unknown. Yet, the amount is known and during the years between 2009 and 2013, 620 wild salmons and 70 wild trouts were captured in the trap downstream Forshaga power plant and transported to the river stretch upstream Edsforsens kraftverk (Gustafsson et al., 2015). Assuming that 50 % of the fish are females and using a mean weight of 3.7 kg per fish with a roe production of roe 55
76 granules per kg (Gustafsson et al., 2015), the total number of produced roe granules becomes Gustafsson et al. (2015) estimates the survival rate from roe granule to smolt to approximately 1.63 %. This can be compared to the estimation made by the County Administrative Board of Västra Götaland of a % survival rate from roe to migration ready smolt (Bäckstrand, 2018). Using 1.63 % as the survival rate results in a migration ready smolt production of With a capture percentage of 80 % at Edsforsen, the number of released smolt downstream Forshaga would be If applying the current survival rate of 16 % on the same number of produced migration ready smolt, only smolts will survive the passage through all the eight power plants. Thus, the survival increase of an implementation of the downstream trap-and-transport facility would be 500 %. As for the kelts, the average rate of spawning survival for salmons and trouts are 47 % and 43 %, respectively (Greenberg et al., 2018). Applying this and a capture percentage of 80 % on the number of released salmons and trouts upstream Edsforsen, the number of released kelts downstream Forshaga will be 233 salmons and 24 trouts. The current estimated survival rate is 2 % and 8 % (Greenberg et al., 2018) for salmons and trouts, respectively. This corresponds to approximately 6 salmons and 3 trouts surviving the passage through the eight power plants. Comparing the current with the theoretical survival rate after an implementation of the downstream trap-and-transport project, the salmon kelt survival will be approximately 39 times larger, while the trout survival will be 8 times larger. Additionally, there is a limitation for how many smolt certain habitats are able to produce and house, which entails a limiting factor for the salmonid stock in Klarälven. According to the report Vänerlaxens fria gång (Gustafsson et al., 2015) can each hectare bear 300 smolts and the remaining spawning areas are estimated to approximately 377 ha in Klarälven. This number is based on one source and it could be possible that the remaining habitats only correspond to around 100 ha due to calm water areas and depth limitations. Consequences analysed but excluded from the model It is not allowed to catch wild salmonids in Vänern, due to policies regarding the preservation of the wild habitat. In order to enable fishermen to see the difference between the farmed and wild salmonids, the farmed salmonids get their adipose fin clipped (Länsstyrelsen Värmland, 2015). The upstream trap-and-transport activity only transports wild salmonids to the river stretch upstream Edsforsen power plant. Hence, the downstream trap-and-transport solution will only collect, transport and consequently increase the population of wild salmonids (Gustafsson et al., 2015). As the fishermen are not allowed to catch the wild salmonid, it is reasonable to assume that producing ecosystem services such as food through recreational or professional fishing can be ignored. For the same reason, effects on the cultural ecosystem services such as tourism and fishing experiences can also be neglected. Due to the low impact, damage costs related to emissions during the construction phase generally does not have to be considered (Energiforsk, 2017). VISS measures and EQS Edsforsen is a part of the water body of Klarälven ns Acksjöälven with ID number WA , which belongs to the catchment basin of Göta Älv, SE The EQS of the water body of Klarälven ns Acksjöälven is to have a Good ecological status by 2027 and also a 56
77 Good chemical surface water status. The current ecological status is Moderate, the chemical status is Not good and the chemical status excluding mercury is Good. As for the ecological status, the main factors influencing the overall status are hydromorphology, biological quality factors and physicochemical quality factors. In this project, the hydromorphology is the factor that might be affected. The hydromorphology is also the cause of the moderate status. This factor in itself consists of three subfactors, each with an additional number of subfactors. The three subfactors are: waterway connectivity, hydrological regime and morphological condition. The connectivity and the hydrological regime are the subfactors affecting the ecological status of the waterway negatively. In order for a Good ecological status to be achieved, these two quality factors are crucial. The connectivity has the classification bad, which is due to the existence of barriers that causes issues for migrating species to transport themselves through the waterway. The hydrological regime is classified as Moderate due to the power production related regulation of Klarälven. Despite the fact that the river of Klarälven is highly regulated with fourteen power plants (vattenkraft.info, 2018), only certain parts are classified as HMWB. The water body of Klarälven ns Acksjöälven is classified as an NWB (Vatteninformationssystem Sverige (VISS), 2018), which means that the reference point of the quality factors is a natural water body without any impacts of hydropower regulation. The downstream trap-and-transport project in Edsforsen will lead to an improved connectivity and will consequently affect that quality factor. The quality factor of the hydrological regime will not be affected, as the project will not have an impact on the level of regulation in Klarälven. The project is not a recommended VISS measure Valuation of consequences In this step, the costs and benefits of the project are computed and expressed in monetary values. Discount rate The real socio-economic discount rate that will be used as a parameter in the analysis corresponds to a value of 3 %. This value is based on information provided by Söderqvist (2006), who estimates a rate of 3 % for projects with a lifetime of years. This rate can be compared to the recommendation from Trafikverket (2016), which states that the real socioeconomic discount rate should correspond to 3.5 %. However, Trafikverket does not specify a project lifetime, which is why 3 % will be used. CAPEX Norconsult (2017) has performed an approximation of the investment cost of the project and estimates the costs of engineering and construction to MSEK. The total time of construction is estimated to approximately 24 months and the power plant is expected to be 100 % out of operation for 6 months and 50 % for 18 months. The costs of the production loss during the time of construction was estimated by Norconsult (2017) to 21.4 MSEK, using an electricity price of 0.3 SEK per kwh, which is close to the current price. Hence, the construction and standstill costs sum up to a total investment of MSEK. The production loss costs were estimated based on the assumption that it will be possible to have one of the two units running during 18 months of the project time. If this would not be possible, the production loss costs could potentially increase by 40 % (Norconsult, 2017). 57
78 The diverter and the log boom have a lifetime of 20 years (Uniper, 2018), while the rest of the facility has a lifetime of 40 years (Norconsult, 2017). The cost of this equipment in 2017 price level was 12 MSEK (Norconsult, 2017) and since all costs in Norconsult s report are based on the value of 2017, it was assumed to be the base year for all the calculations. Using an inflation rate of 2 % (Sveriges riksbank, 2018), the cost of the diverter and log boom in 2037 price level was calculated to approximately 18 MSEK. In Scenario 1, it was assumed that Fortum needs to lend money to cover the investment cost and thus, does not hold the capital needed. Hence, no opportunity cost was considered. The investment cost was assumed to be covered by a loan with an interest rate of 3 % (Företagarna, 2015). The payback of the loan was assumed to be distributed over 40 years. The costs of construction and projection, excluding the cost of the diverter and the log boom was distributed equally, as a pay-back of the mortgage, over 40 years. The annual interest rate of 3 % of the remaining loan was added to the total annual cost. After 20 years, the log boom and diverter need to be replaced and it was assumed that the replacement would be covered by another loan, with the same interest rate of 3 %. As the log boom and diverter have a shorter lifetime than the rest of the facility, the annual pay-back of the mortgage and interest costs for this equipment were calculated separately and thereafter added to the total annual cost. It was assumed that the loan for the first diverter and log boom would be paid off during the first 20 years and that the cost of 18 MSEK (price level 2037) for the replacement of the diverter and the log boom would be covered by another loan with the same interest rate of 3 %. The pay-back of the second loan would also have a time period of 20 years. The total annual CAPEX, which was inserted into the tool as point values, represented the mortgage of the facility and the diverter and log boom as well as the summed up annual interest cost. OPEX The total annual OPEX, including maintenance, operation and fish transport was estimated to approximately SEK. The annual operational cost for the trap facility was calculated to about SEK using an estimation made by Norconsult (2017) of 650 SEK per hour and 104 hours per year. As the operational cost is of a small order of magnitude and has an insignificant impact on the CBA result, the inflation was not considered. The maintenance costs were calculated using a standardized value of 0.5 % of the original investment cost of about MSEK, which resulted in approximately SEK per year. The annual transportation cost was estimated by Norconsult (2017) to SEK. The OPEX cost was inserted into the tool as an annual point value. Cost of production loss Greenberg et al. (2018) computed the required flow through the trap spillway to vary between 0 and 4.8 m 3 /s throughout different periods of the year. Norconsult (2017) used the estimated values for the required flow rate to calculate the production loss of the different periods. These were thereafter added together to receive an annual value for the production loss. Other assumptions used within the calculation was a mean nominal head of 7.7 metres during winter and 7.2 meters during summer, a Kaplan turbine efficiency curve with a maximum efficiency of 92 % and a transformer and generator efficiency of 99.5 % and 97 % respectively. Also, losses in gates, intake inlet, head loss as a function of the spill, inlet losses and channel losses were estimated. The annual production reduction due to the trap implementation was calculated to 0.9 GWh. 58
79 To assess the cost of the production loss in the CBA tool, an electricity price of 0.4 SEK per kwh was used to account for the uncertainty related to the future electricity price (Norconsult, 2017). Based on this, the cost of the production loss was inserted as point values of SEK per year. Non-user value of cultural ecosystem services: Habitat The society profit gained by a project can be measured and evaluated by different methods. In this CBA, the gained profit will be measured as a WTP and the inputs are based on a study performed by Håkansson (2007). The study addresses an increase of the salmon stock in Vindelälven, located in the northern part of Sweden, and was based on a survey which was sent out to randomly selected people in Sweden. The survey was sent out in five different versions. The basic foundation of the questions was the same in the different versions and the respondent was asked to state how much the respondent was willing to pay for an increase of the salmon stock in Vindelälven. The amount was to be stated either as an interval or as a specific amount. The difference between the survey versions was how much the stock would increase. The base scenario had migrating salmons and the growth for the five different versions was stated in the following way: 1. An increase of salmons this year (33 % growth). 2. An increase of salmons this year (100 % growth). 3. An increase of salmons this year (200 % growth). 4. An increase of salmons in the next five years. 5. An increase of salmons in the next ten years. In total people received a questionnaire and people responded and among the responses 41 % stated that they were not willing to pay anything for an increase of the salmon stock but 59 % were willing to pay some (Håkansson, C., 2007). Furthermore, the respondents was divided into two different groups depending on their geographic location, which was divided into the northern and southern part of Sweden. Table 1 shows the median and mean values of the WTP for both point and interval estimations. WTP median shows the median value of the point estimations, WTP mean shows the mean value of the point estimation, WTP lower shows the mean value of the lower point in the interval estimation and WTP upper shows the mean value of the upper point in the interval estimation. Table 1. Median and mean and interval WTP in SEK. Modified after Håkansson (2007). Geographical location Version of survey WTP median [SEK ] WTP mean WTP lower [SEK] WTP upper [SEK] [SEK] North North North North North South South South South South
80 As the table indicates, the WTPs are quite similar between the different surveys. It was therefore interpreted that the amount of the population growth does not matter that much, as long as the survival of the stock is ensured. In a further analysis, performed by Håkansson (2009), all the data was summarized, weighted and used as a general WTP for an increase from to migrating salmons. This was done due to the small differences between the outcomes of the different surveys. The summary of the WTPs is presented in Table 2. Table 2. Summa ry of the different WTP s. Modified after Håkansson (2009). Geographical location Version survey of WTP lower [SEK] WTP mean [SEK] WTP upper [SEK] North South To analyse the Edsforsen project in the CBA tool, an interval and a mean value of the WTP are required. The growth rate in the evaluation performed by Håkansson (2009) had an increase of the salmon stock of 33 % in Vindelälven. However, this value is not correlated with the increase in Edsforsen, but, as previously stated, the percentage increase does not seem to influence the WTP as long as the stock is preserved. Therefore, the WTP is directly translated to the Edsforsen case even though the percentage growth differs between the different cases. The interval that will be used in the new evaluation is the one represented by southern part of Sweden, since that is where the majority of the Swedish population live. The mean value was weighted between the current distribution of the northern and southern respondents. The current Swedish population corresponds to people (Statistiska centralbyrån (SCB), 2018a) and the fraction of the population that is above 18 years old is estimated to (SCB, 2018b). The fraction of the population above 18 years in the northern part of Sweden corresponds to people (SCB, 2018c). The weighted mean WTP based on this information can be seen in Equation (4). ( ) = SEK Equation (4) The survey was performed in 2004 and the values should be corrected due to inflation and general increase in income. According to SCB (2018d), the inflation from 2004 to February 2018 corresponded to % and was based on the Consumer Price Index (CPI). The mean net income in Sweden has increased from SEK per year in 2004 to SEK in 2016 (SCB, 2018e), thus the mean income has increased with 61.5 %. However, the increase includes the inflation as well and in order avoid a double counting of the inflation, the value from 2004 is corrected and stated as the money value of today. Hence, the income increase corresponds to %. The original WTPs are multiplied with both the inflation and the income growth to obtain the WTPs in today s money values. The original and corrected values can be seen in Table 3. Table 3. The weighted original and corrected WTPs (SEK). WTP lower [SEK] WTP mean [SEK] WTP upper [SEK] Original Corrected
81 The performed survey, which serves as a foundation in this analysis, did not state whether the WTP was per individual or per household. In this analysis it was decided to use the WTP as an amount per household in order to reduce the risk of overrating the result. An average household in Sweden consists of 2.2 persons (Håkansson, C. 2009) and with a population of people (SCB, 2018a), the total amount of households in Sweden sums up to Table 4 shows the total mean WTP and its corresponding interval for all households in Sweden. Table 4. The total intervals and mean WTP for all Swedish households (SEK). WTP lower [SEK] WTP mean [SEK] WTP upper [SEK] Households When the values were inserted into the tool, the WTP was stated as an asymmetric triangular probability distribution with a best guess as the total mean WTP for all Swedish households. The minimum and maximum values of the distribution corresponded to the total lower and upper boundaries for the Swedish households, respectively. Other external effects: emissions from replacement power An external effect resulting from an implementation of the project is possible emissions from the replacement power for the production loss. As explained in section 6.7.4, it is currently recommended by Energiforsk (2017) to assume that the substitute power comes from Danish coal. The estimated production loss was 0.9 GWh and the current total annual production of Edsforsen is 57.1 GWh (Norconsult, 2017). Thus, the reduction of 0.9 GWh corresponds to approximately 1.6 % of the total annual production in Edsforsen. An article in Ny Teknik (2007), presents the findings of a scientific project performed at Aarhus University, where the environmental consequences from three large power plants in Denmark was evaluated. The study only included the effects of sulphur emissions, nitrogen oxide (NOx) and particles and concluded that the mean additional cost for mortality, morbidity, sick days and medicine would be 0.26 SEK per kwh (Ny Teknik, 2007). The environmental cost of GHG emissions affecting the climate is priced by the EU Emission Trading System (ETS) system and consequently does not need to be further evaluated in the CBA (FRAM-KLIV, 2018). In the CBA tool example of Mörrumsån (FRAM-KLIV, 2018), a cost of 0.03 SEK per kwh was used, which was calculated using the tool EcoSenseLE (2017) and based on increased emissions of NOx, sulphur dioxide (SO2), particles, Non Methane Volatile Organic Compounds (NMVOC), methane (CH4) and Nitrous oxide (N2O). The tool EcoSenseLE is a parameterised version of the tool EcoSense and based on the exposure-response function and monetary values from the EU project ExternE (ExternE, 2018). The tool EcoSenseLE was tested and the societal cost of emissions from a Danish condensing hard coal power plant was computed to approximately 0.17 SEK per kwh. Due to the variety of collected and calculated values for societal and environmental costs of coal power emissions, an interval between 0.03 and 0.26 SEK per kwh was used. This interval together with an annual replacement production of 0.9 GWh resulted in a total annual cost 61
82 ranging from to SEK. This interval was inserted into the CBA tool, using a uniform probability distribution. Other scenarios In order to evaluate different possible approaches and to identify the most important parameters in the analysis, further scenarios were developed as a complement to Scenario 1. See Appendix A for input data regarding Scenario 1 and 2 and Appendix B for input data regarding Scenario 3 to 13. Appendix C consist of the financial background and calculations for scenarios 1, 2, 3, 4, 6 and Scenario 2: Funded by own capital with depreciation, accounting for an opportunity cost with compound interest In Scenario 2, it is assumed that the power company will fund the investment using own capital. The total investment cost will be the same as in Scenario 1, hence it is assumed that the construction and projection cost has a depreciation time of 40 years. The cost that occurs due to the standstill is further assumed to also have a depreciation time of 40 years. The log boom and diverter are assumed to have a depreciation time of 20 years and a reinvestment of this equipment thus occurs after 20 years, which in its turn has a depreciation time of 20 years, just as in Scenario 1. The difference is that in Scenario 2, Fortum finances it with liquid assets. Furthermore, Scenario 2 evaluates the opportunity cost and how the money could have been used in other investments that could provide a return. This opportunity cost is seen as a loss and described as an annual cost. The assumed return on the opportunity cost is set to 4 % and the compound interest method is used, which entail a larger loss for every year. The rest of the parameters are kept the same as in Scenario 1. The total annual cost is ranging from 7 MSEK for the first year to 24 MSEK for the 40 th year Scenario 3: Funded by own capital with depreciation, accounting for an opportunity cost with an annual dividend Scenario 3 is similar to Scenario 2 regarding the investment costs, the depreciation and the time duration. The difference solely regards the opportunity costs and the loss of return. In this scenario, the return from the annual opportunity cost is assumed to be distributed to the stockowners in form of a dividend each year. The annual revenue is therefore not assumed to be reinvested and the annual cost in form of a defaulted income is lower than in Scenario 2. The annual CAPEX corresponds to approximately 7 MSEK during the first 20 years and 8 MSEK during the second half of the project lifetime. The slightly higher amount during the last 20 years occurs due to the reinvestment of the log boom and diverter Scenario 4: Funded by own capital with depreciation In Scenario 4, it was assumed that the project would be funded by Fortum s own capital with a depreciation of 40 years. The CAPEX was inserted as annual point values representing the depreciation cost of the facility with an additional investment after 20 years, due to the replacement of the diverter and the log boom. The cost of the diverter and log boom in 2037 was calculated as in Scenario 1, described in section 7.1, using the 2017 cost of about 12 MSEK and 62
83 an inflation rate of 2 %. Starting year 21, the depreciation of the replacement investment was added on top of the depreciation of the original facility. This scenario assumed that Fortum would be forced by Nappen to implement some sort of fishway to enhance the survival of downstream migrating fish in Klarälven. Thus, the alternative of not implementing the project would be to shut down Edsforsen power plant and most likely also the other power plants downstream Klarälven. The production loss due to the shutdown would highly exceed the opportunity cost of investing the money elsewhere, which is why the latter is excluded from this scenario. All other parameters inserted into the tool were kept identical to Scenario Scenario 5: Funded as a one-time investment with own capital Scenario 5 was set up similar to Scenario 4, with the exception of the depreciation. In Scenario 5, it was assumed that the project would be funded by own capital without depreciation. Hence, the CAPEX was inserted as annual point values and as a fixed investment cost of MSEK in 2017 with an additional investment for the replacement of the diverter and the log boom in year 21. The cost of the diverter and log boom in 2037 values was calculated as in Scenario 1, described in section 7.1, using the 2017 cost of 12 MSEK and an inflation rate of 2 % In Scenario 5, just as in Scenario 4, the opportunity cost was excluded based on the assumption of Fortum being forced to implement a project that would enhance the survival of downstream migrating fish. If not implementing the project, Fortum would face a shutdown of the plants in Klarälven. All other parameters inserted into the tool were kept identical to Scenario Scenario 6: Increase of the standstill cost during construction by 40 % Scenario 6 is developed from Scenario 1 with a slight change of the standstill cost during the construction time of the trap-and-transport facility at Edsforsen power plant. Norconsult (2017) estimated the total construction time to two years and the limitations of the electricity generation during this period is assumed to be 50 % during the first 18 months and 100 % during the last six months. There will consequently be one turbine in operation during the first 18 months and during the last period, both turbines will be shut off. Yet, there is a possibility that this might not work, and the action plan needs to take an increase of the standstill cost into account. Norconsult (2017) estimated an increase of the standstill cost by 40 % if the plan cannot be fulfilled. This would result in a standstill cost of approximately 30 MSEK. The standstill cost is a part of the total investment cost and hence, the total investments cost increases to approximately 131 MSEK. Scenario 6 was developed from the original scenario, which means that the increase of the standstill costs entails larger loans, which in turn implies higher interest costs and amortization Scenario 7: 85 % of the cost covered by Vattenkraftens miljöfond Scenario 7 was based completely on Scenario 1, assuming that the CAPEX would be covered by a loan, using the same interest rate of 3 %. However, in Scenario 7, it was assumed that the fund solution, Vattenkraftens miljöfond, would be established and cover 85 % of the CAPEX and OPEX costs, excluding the interest rate of the loan. Hence, Fortum would only have to cover 15 % of the costs of planning and construction, the replacement of the diverter and the log boom, the 63
84 production loss and the OPEX. The loan would consequently be 15 % of the loan in Scenario 1, resulting in a reduced annual interest cost Scenario 8: WTP based on Värmland Scenario 8 regards a difference in the willingness to pay. The WTP used in the original analysis is based on the entire Swedish population and its households. The obtained range of the WTP in Scenario 1 was large, which in itself entails uncertainties. In Scenario 8, the affected population is limited to the households in Värmland, based on the assumption that people are more concerned about the environment and ecosystem in proximity to where they live. Värmland had a population of people in 2017 (Regionfakta, 2018) and it was assumed that an average household consist of 2.2 people (Håkansson, C. 2009), which entailed a total amount of households of The total WTP for all households in Värmland would then range from approximately 6 MSEK to 15 MSEK with the maximal density at 9 MSEK Scenario 9: Doubled production loss In Scenario 9, the production loss was doubled to account for the uncertainties in the calculations. Due to the enhanced loss, the environmental cost of emissions also increased. All other values were kept identical to Scenario 1. The cost of the production loss was inserted as annual point values of SEK and the range of values for the annual environmental cost of emissions was inserted as a uniform distribution between and SEK Scenario 10: Lognormal distribution of the WTP Scenario 10 consist of the exact same input values as Scenario 1. The only difference is the probability distribution of the WTP. In scenario 1, an asymmetric triangular probability distribution was used for the willingness to pay. It was chosen due to limited knowledge of the distribution of the answers since each value were given as an average. In Scenario 10, a lognormal probability distribution was used to describe the distribution of the willingness to pay Scenario 11: WTP based on Värmland and 85 % of the cost covered by Vattenkraftens miljöfond Scenario 11 is a combination of Scenario 7 and Scenario 8, which means that the WTP used in this scenario was limited to the households in Värmland county. It was also assumed that 85 % of the cost will be covered by the fund solution Scenario 12: Decrease of the discount rate A critical parameter for the analysis is the assumed discount rate, which is used to calculate the NPV. The discount rate is a debated parameter in CBA theory as it is usually estimated with a large uncertainty and often has a high impact on the result. To evaluate the effect of a change in the discount rate, Scenarios 12 and 13 were created. In Scenario 12, the discount rate was reduced from the original value of 3 % to 2 %. 64
85 Scenario 13: Increase of the discount rate In Scenario 13, the discount rate was increased to 4 %. The project lifetime is relatively long when it comes to investments, which makes the discount rate more difficult to predict. 65
86 8 Result The first part of this chapter, section 8.1, describes the result of the CBAs of the original scenario, described in section 7.1, and the other scenarios, described in section 7.2. The second part, 8.2, describes the result of the calculation of how much the population must be willing to pay in order for the project to reach the threshold where the NPV equals zero, i.e. where it start to become socio-economically profitable. The third part, section 8.3, describes the result from the calculation of the value of the fish. Result of the CBA The CBA tool compiles the inserted data to simulate a mean NPV of the evaluated project, which in this case is an implementation of a trap-and-transport solution at Edsforsen power plant. The input data consist of both point values and probability distributions and the tool therefore performs a Monte Carlo analysis of the parameters. The number of iterations for the simulation of the Edsforsen project was set to in all scenarios. Table 5 presents a compilation of the mean NPV of the project in the different scenarios. The NPV of the two actors, the public and Fortum, is also presented for each scenario. The result of the different scenarios is further presented in the following subchapters. Table 5. The total mean NPV for the project together with the NPV for the public and Fortum as well as the magnitude of the NPV that is derived from the CAPEX, OPEX and production loss. Scenario Description Mean NPV Public's NPV Fortum's NPV NPV of CAPEX NPV of OPEX NPV of production loss 1 Loan with an interest rate of MSEK %. Amortization over 40 years. 2 Own capital, depreciation over MSEK 40 years + opportunity cost with a compound interest of 4 %. 3 Own capital, depreciation over MSEK 40 years, opportunity cost with interest rate and annual dividend of 4 %. 4 Own capital with depreciation over 40 years MSEK 5 Own capital, one-time , MSEK investment. 6 Standstill cost increase by ,571 MSEK % % of the cost covered by MSEK Vattenkraftens miljöfond. 8 WTP based on Värmland MSEK 9 Doubled production loss MSEK 10 Lognormal distribution of the MSEK WTP. 11 WTP based on Värmland + 85 % of the cost covered by MSEK Vattenkraftens miljöfond. 12 Discount rate of 2 % MSEK 13 Discount rate of 4 % MSEK Unit 66
87 In general, for all scenarios, it can be said that Fortum is mainly subject to the costs whereas all the benefits will be obtained by the public. The public s NPV is a trade-off between the WTP and the entailed costs of air pollution caused by the replacement power. The simulation of the NPV is in all scenarios performed by a Monte Carlo Analysis. Thus, even for the parameters which inputs are the same between the different scenarios, the resulting NPVs have a slight difference. However, this difference is rather insignificant and has no major effect on the final result Scenario 1: Original scenario In the original scenario, it was assumed that Fortum needs to lend money to cover the investment cost and thus, does not hold the capital needed. Hence, the opportunity cost is neglected. As described in section 7.1, the investment cost was assumed to be covered by a loan with an investment interest rate of 3 %. The empirical probability distribution of the NPV for Scenario 1 is presented in Figure 6, where the x-axis shows the simulated NPV in ksek and the y-axis represents the allocation density in fractions, N= The result report produced by the CBA-tool containing all data for Scenario 1 can be found in Appendix A. Figure 6. The empirical probability distribution of the NPV for Scenario 1. The x -axis shows the simulated NPV in ksek and the y -axis represents the allocation density in fractions, N= The mean value of the simulated NPV corresponded to MSEK, see Table 5 and Appendix A. The minimum and maximum values of the 95 % confidence interval were MSEK and MSEK, respectively. As can be seen in the figure, the distribution is slightly skewed to the left and has a typical asymmetric triangular distribution shape. This is due to the large impact of the WTP parameter, which was described with an asymmetric triangular distribution. The NPV values have a large span, ranging from MSEK up to MSEK. An exact mode cannot be determined with precision, but in the graph, it can be seen that it has a value slightly above 167 MSEK, with an allocation density of approximately 4 %. Hence, the mode NPV is about 18 % lower than the mean NPV. This indicates that the large interval of NPV values causes the mean NPV to become significantly higher than the mode NPV. 67
88 The graph in Figure 7 presents the probability of a project profitability. The x-axis represents the simulated NPV in ksek and the y-axis represents the chance of profitability. Figure 7. Acceptability curve showing the probability of a positive result for Scenario 1. The x-axis represents the simulated NPV in ksek and the y-axis represents the chance of profitability. At the intersection of the curve and the zero value on the x-axis, the corresponding y-value is the probability in percent of a positive socio-economic result. In the graph in Figure 7, all NPV values presented on the x-axis are positive, which means that there is a 100 % chance that Scenario 1 would be socio-economic profitable. The large positive mean NPV of MSEK and the two graphs presented in Figure 6 and 7 all indicate that with the parameters used, Scenario 1 would be socio-economic profitable. As presented in Table 5, the distribution of the costs and benefits are divided between the production company, Fortum, and the public. The mean simulated NPV for Fortum was approximately -158 MSEK and the generated benefits for the public was about 361 MSEK. The NPV of the public is dependent upon the WTP, which in Scenario 1 was inserted as an asymmetric triangular distribution, and the cost of air pollution, which was inserted as a uniform interval. The power company s NPV originates from the costs of OPEX, CAPEX and the production loss. Over the project lifetime of 40 years, the NPV of the OPEX and production loss resulted in values of -22 MSEK and -9 MSEK, respectively. The NPV of the CAPEX was -127 MSEK. The CAPEX was inserted into the tool as annual point values, calculated as the sum of the annual pay-back of the loan of 101 MSEK plus the interest rate, with an additional loan of 18 MSEK for the replacement of the diverter and the log boom after 20 years. In this thesis, a socio-economic analysis is performed, but the tool also allows for a financial analysis as a complement. In general, a financial analysis evaluates how the cash-flow of different actors will be affected by an implementation of a certain project. A financial analysis is performed to provide a better overview of the income, generation and costs for each actor. The financial effects of a certain project might influence the actors. A financial analysis of Fortum was conducted using the data for Scenario 1 and a real interest rate of 3 %, which gave the same 68
89 result regarding the mean NPV of Fortum as the socio-economic analysis. Hence, in this project, the financial analysis did not provide any additional information Scenario 2: Funded by own capital with depreciation, accounting for an opportunity cost with compound interest In Scenario 2, it was assumed that the power company funded the project using own capital depreciated over 40 years. Additionally, an opportunity cost with a compound interest was considered and inserted into the tool as a loss. The obtained empirical probability distribution of the NPV for Scenario 2 is presented in Figure 8. Figure 8. The empirical probability distribution of the NPV for Scenario 2. The x -axis shows the simulated NPV in ksek and the y -axis represents the allocation density in fractions of N= The simulated mean NPV of Scenario 2 was MSEK and, with a confidence of 95 %, within the interval between MSEK and MSEK. However, as the figure indicates, there is a large span of possible NPVs ranging from approximately MSEK to MSEK. It is not possible to determine an exact mode from the graph, but it can be seen that it is somewhere in the beginning of the interval between 6 and 19 MSEK, with an allocation density of approximately 4.1 %. Thus, the difference between the mode and the mean value is consequently very large in comparison to Scenario 1, as mode NPV solely represents about 14 to 45 % of the mean NPV. The result for Scenario 2 is complemented with an acceptability curve, presented in Figure 9. 69
90 Figure 9. Acceptability curve showing the probability of a positive result for Scenario 2. The x -axis represents the simulated NPV in ksek and the y -axis represents the chance of profitability. The acceptability curve indicates that there is about a 70 % probability of a positive result, which can be interpreted in the graph as the y-value corresponding to the point where the curve meets the x-value, or NPV value, of zero. The NPV is distributed between Fortum and the public and Fortum has an NPV of MSEK while the public has an NPV of MSEK, as presented in Table 5. Although the same values were used for the WTP and the environmental cost of emissions, the public s NPV differs slightly from the original value, obtained in Scenario 1, due to the new simulation performed with the Monte Carlo method. Out of the costs affecting Fortum s NPV, only the inserted values for CAPEX differed from Scenario 1. The NPV of the CAPEX in Scenario 2 was MSEK, which is higher than the corresponding value in Scenario 1. The result indicates a positive socio-economic result for Scenario 2, with a probability of approximately 70 % Scenario 3: Funded by own capital with depreciation, accounting for an opportunity cost with an annual dividend Scenario 3 is similar to Scenario 2, with the exception of the annual dividend to the stockowners. The distribution of the NPV from the simulation in Scenario 3 can be seen in Figure
91 Figure 10. The empirical probability distribution of the NPV for Scenario 3. The x -axis shows the simulated NPV in ksek and the y -axis rep resents the allocation density in fractions of N= As can be seen in the figure, the span ranges from about MSEK to 317 MSEK and the simulated mean NPV for Scenario 3 corresponded to MSEK. The 95 % confidence interval of the simulated mean WTP ranges from MSEK to MSEK. It is not possible to determine an exact mode value from the graph, but it can be seen that it is somewhere close to 110 MSEK, with an allocation density of approximately 4.1 %. Thus, the mode value represents about 75 % of the mean value, which is a relatively large difference. The x-axis on the acceptability curve for Scenario 3, which can be seen in Figure 11, only consist of positive values, which indicates that there is a 100 % chance of profitability with the input values for Scenario 3. This can also be determined solely by observing the empirical probability distribution, as the x-axis only has positive NPV values. Hence, the results from the CBA of Scenario 3 indicates a socio-economic profitability. 71
92 Figure 11. Acceptability curve showing the probability of a positive result for Scenario 3. The x -axis represents the simulated NPV in ksek and the y -axis represents the chance of profitability. Scenario 3 did not have any changes in the profit gained by the public and therefore, the public s NPV was the same as in the original analysis, 361 MSEK. The change that was made to the parameter inputs from the original scenario was the CAPEX for the production company. In this scenario, the NPV of the CAPEX corresponded to -185 MSEK. The obtained final NPV for Fortum corresponded to -215 MSEK. The NPV for Fortum was significantly less negative than it was in Scenario 2, which is due to the assumed annual dividend. This shows that if a compound interest on the theoretical opportunity cost is assumed, as it was in Scenario 2, it will result in a significantly higher total cost for Fortum, i.e. a much more negative NPV, than if an annual dividend is assumed Scenario 4: Funded by own capital with depreciation In Scenario 4, it was assumed that the investment cost would be funded by Fortum s own capital with a depreciation over 40 years. The empirical probability distribution of the NPV for Scenario 4 is presented in Figure
93 Figure 12. The empirical probability distribution of the NPV for Scenario 4. The x -axis shows the simulated NPV in ksek and the y -axis represents the allocation density in fractions of N= The mean value of the simulated NPV for Scenario 4 corresponded to approximately MSEK. The minimum and maximum values of the 95 % confidence interval of the mean NPV were MSEK and MSEK, respectively. As can be seen in the graph, the NPV values ranges from about MSEK to MSEK. As in previous scenarios, an exact mode cannot be determined with full precision from the graph. However, it can be seen that the mode is somewhere around 212 MSEK, with an allocation density of approximately 4.2 %. Hence, the mode value is about 15 % lower than the mean NPV. The acceptability curve in Figure 13 presents the probability of a project profitability for Scenario 4. Figure 13. Acceptability curve showing th e probability of a positive result for Scenario 4. The x -axis represents the simulated NPV in ksek and the y -axis represents the chance of profitability. 73
94 In the graph, all NPV values presented on the x-axis are positive, which means that there is a 100 % chance that Scenario 4 would be socio-economic profitable. The graphs presented in Figure 12 and 13 together with the large positive mean NPV of MSEK all indicate that Scenario 4 would be socio-economic profitable. The mean simulated NPV for Fortum corresponded to MSEK and the generated benefits for the public corresponded to approximately MSEK. No changes from Scenario 1 were made to the costs of air pollution and the WTP, which is why the NPV of the public for Scenario 4 has approximately the same result. A small but insignificant variation can be detected, which is due to the Monte Carlo analysis that causes the parameters to vary slightly between different simulations. Fortum s NPV originates from the costs of OPEX, CAPEX and the production loss. Compared to Scenario 1, only the CAPEX parameter was changed in Scenario 4. The resulting NPV of CAPEX was MSEK, comprising the investment with a depreciation over 40 years for the construction and planning costs and two depreciation periods of 20 years each for the diverter and log boom investment Scenario 5: Funded as a one-time investment with own capital Scenario 5 is similar to Scenario 4, where it was assumed that the investment cost would be funded by Fortum s own capital. However, in Scenario 5, which was created for comparison purposes, it was assumed to be a onetime investment at year 1 and a reinvestment for the replacement of the diverter and the log boom at year 21. In Figure 14, the empirical probability distribution of the NPV for Scenario 5 is presented. Figure 14. The empirical probability distribution of the NPV for Scenario 5. The x -axis shows the simulated NPV in ksek and the y -axis represents the allocation density, N= The mean value of the simulated NPV for Scenario 5 corresponded to approximately MSEK. The minimum and maximum values of the 95 % confidence interval of the mean NPV were MSEK and MSEK, respectively. As can be seen in the figure, the NPV values ranges from about MSEK to MSEK. From the graph, it can be seen that the mode is somewhere around 162 MSEK, with an allocation density of about 4.1 %. Hence, the mode value is 18 % lower than the mean NPV. This shows that the outliers of high NPV values affects the mean NPV to become higher than the mode. 74
95 The acceptability curve in Figure 15 presents the probability of a project profitability for Scenario 5. Figure 15. Acceptability curve showing the probability of a positive result for Scenario 5. The x -axis represents the simulated NPV in ksek and the y -axis represents the chance of profitability. As there are no negative NPV values on the x-axis, the acceptability curve shows that there is a 100 % possibility of a positive result for Scenario 5. Based on the two graphs presented in Figure 14 and 15 together with the mean NPV of , Scenario 5 has a positive socio-economic result. In Scenario 5, the mean simulated NPV for Fortum corresponded to MSEK and compared to Scenario 1, only the CAPEX parameter was changed. The resulting NPV of the CAPEX was MSEK. If comparing Scenario 4 and 5, the only difference was that the former had a depreciation over 40 years and the latter a one-time investment year 1 and year 21. The NPV of the CAPEX in Scenario 5 can be compared to the NPV of the CAPEX in Scenario 4, which was MSEK. Hence, the difference in the mean NPV of the CAPEX between the two scenarios is MSEK, which is due to the depreciation. AS CAPEX was the only parameter that was altered, the difference in the mean total NPV of the two scenarios is consequently the same Scenario 6: Increase of the standstill cost during construction by 40 % In Scenario 6, it was assumed that the standstill cost during the construction time increases with 40 % due to the omission of the assumption that Fortum will be able to operate at least one of the generators during the majority of the construction time. The empirical probability distribution of the NPV for Scenario 6 is shown in Figure
96 Figure 16. The empirical probability distribution of the NPV for Scenario 4. The x -axis shows the simulated NPV in ksek and the y -axis represents the allocation density in fractions of N= As can be seen in Figure 16, the span ranges from about 57 MSEK to 370 MSEK. The final result indicated on a positive mean NPV of MSEK and the minimum and maximum values of the 95 % confidence interval of the mean NPV were MSEK and MSEK. As in previous scenarios, it is not possible to determine an exact mode from the graph. However, it can be seen that it is somewhere around 165 MSEK, with an allocation density slightly above 4.1 %. Hence, the difference between the mode and mean value in Scenario 6 is relatively large as the mode value represents about 83 % of the mean value. Figure 17 presents the acceptability curve showing the probability of a project profitability for Scenario 6. Figure 17. Acceptability curve showing the probability of a positive result for Scenario 6. The x -axis represents the simulated NPV in ksek and the y -axis represents the chance of profitability. 76
97 The acceptability curve indicates that there is a 100 % chance of a positive socio-economic result, since all values on the x-axis are positive. The two graphs presented in Figure 16 and 17 together with the total mean NPV of all indicates that Scenario 6 has a positive socioeconomic result. No alterations were made to the input parameters affecting the NPV of the public. Fortum s NPV correspond to -163 MSEK, which means that the cost is slightly larger than in the original scenario. The parameter that is affected in this case is the CAPEX, due to the increased amortization and interest. However, the change is relatively small in comparison to the whole investment Scenario 7: 85 % of the cost covered by Vattenkraftens miljöfond In Scenario 7, it was assumed that the fund solution, Vatten kraftens miljö fond, would cover 85 % of the investment cost and the OPEX. Hence, the CAPEX as well as the OPEX for Fortum would be significantly reduced. Figure 18 presents the empirical probability distribution of the NPV for Scenario 7. Figure 18. The empirical probability distribution of the NPV for Scenario 7. The x -axis shows the simulated NPV in ksek and the y -axis represents the allocation density, N= The mean value of the simulated NPV for Scenario 7 corresponded to approximately MSEK. The minimum and maximum values of the 95 % confidence interval of the mean NPV were MSEK and MSEK, respectively. As can be seen in the figure, the NPV values ranges from about MSEK to MSEK. It is not possible to determine the mode from the graph with precision, but it can be seen that it is somewhere close to 302 MSEK, with an allocation density of approximately 4 %. Thus, the difference between the mode and mean value in Scenario 7 is about 11 %. Figure 19 presents the acceptability curve for Scenario 7, which shows the possibility of a project profitability. 77
98 Figure 19. Acceptability curve showing the probability of a positive result for Scenario 7. The x -axis represents the simulated NPV in ksek and the y -axis represents the chance of profitability. As there are no negative NPV values on the x-axis, the acceptability curve shows that there is a 100 % possibility of a positive result for Scenario 7. The two graphs presented in Figure 18 and 19 and the mean NPV of all shows that Scenario 7 has a positive socio-economic result. As presented in Table 5, the mean simulated NPV for Fortum corresponded to MSEK and the generated benefits for the public corresponded to approximately MSEK. The NPV of the OPEX and production loss over the project lifetime of 40 years had values of MSEK and MSEK, respectively. The NPV of the CAPEX is MSEK. The NPV values of the OPEX, production loss and CAPEX are significantly lower compared to all other scenarios, which is due to the fact that Fortum only has to cover 15 % of the original investment Scenario 8: WTP based on Värmland In Scenario 8, the mean WTP was limited to the population in Värmland county. The same amount WTP per household was used but the limitation resulted in a significantly lower total WTP. The empirical probability distribution of the NPV is presented in Figure
99 Figure 20. The empirical probability distribution of the NPV for Scenario 8. The x -axis shows the simulated NPV in ksek and the y -axis represents the allocation density in fractions of N= The obtained result performed for Scenario 8 indicated on a mean NPV of MSEK. The 95 % confidence interval of the mean NPV ranges from MSEK to MSEK. In the empirical probability distribution graph for Scenario 8, the distribution has an unsymmetrical shape, which entails enhanced difficulties in deciding the mode value. However, the span of NPV values is much smaller than in previous scenarios, ranging from about MSEK to MSEK. The mode value is somewhere around -151 MSEK, with an allocation density of approximately 4.4 %. Thus, as opposed to previous scenarios, the difference between the mode and mean value in Scenario 8 is small, with a divergence of less than 1 %. The acceptability curve presented in Figure 21 shows the probability of a positive result. 79
100 Figure 21. Acceptability curve showing the probability of a positive result for Scenario 8. The x -axis represents the simulated NPV in ksek and the y -axis represents the chance of profitability. As can be seen in the graph, the x-axis solely consists of negative values and therefore indicates a 100 % chance of a negative socio-economic result. Thus, the result of Scenario 8 indicates on a certain negative result. The production company s NPV is the same as in scenario 1, since changes were only made to parameters affecting the public. The WTP represents the full profit gained by the public, thus the large reduction of the WTP significantly abates the public s profitability. The NPV of public corresponds to MSEK in this scenario, which can be compared to MSEK in the original scenario Scenario 9: Doubled production loss In scenario 9, the parameters from the original scenario, Scenario 1, was used with the alteration of a doubled production loss. Due to the increased production loss, the costs of emissions also increased. Figure 22 presents the empirical probability distribution of the NPV for Scenario 9. 80
101 Figure 22. The empirical probability distribution of the NPV for Scenario 9. The x -axis shows the simulated NPV in ksek and the y -axis represents the allocation density in fractions of N= The mean value of the simulated NPV for Scenario 9 corresponded to approximately MSEK. The minimum and maximum values of the 95 % confidence interval of the mean NPV were MSEK and MSEK, respectively. As can be seen in the graph, the NPV values ranges from MSEK to MSEK. It can be seen that the mode is somewhere around 155 MSEK, with an allocation density of almost 4 %. Thus, the mode value is approximately 19 % lower than the mean NPV. Figure 23 presents the probability of a project profitability of Scenario 9. Figure 23. Acceptability cu rve showing the probability of a positive result for Scenario 9. The x -axis represents the simulated NPV in ksek and the y -axis represents the chance of profitability. 81
102 There are no negative NPV values on the x-axis, which means that the acceptability curve shows that there is a 100 % possibility of a positive result for Scenario 9. In this scenario, the mean simulated NPV for Fortum corresponded to MSEK and the generated benefits for the public corresponded to approximately MSEK. The NPV of the OPEX was the same as in Scenario 1, as this parameter was not affected by the changes in this scenario. The NPV of the production loss was MSEK. The NPV of the CAPEX was MSEK. The two graphs presented in Figures 22 and 23 and the mean NPV of all shows that despite the doubled production loss in comparison to Scenario 1, Scenario 9 still has a considerably positive socio-economic result Scenario 10: Lognormal distribution of the WTP Scenario 10 consist of the same input data as in Scenario 1 with the difference of the probability distribution of the WTP. In this scenario, a lognormal probability distribution is used. The distribution of the NPV is presented in Figure 24 and the span ranges from about MSEK to MSEK. However, the curve reaches an allocation density close to zero already at an NPV of about MSEK. As can be seen in the figure, the shape of the probability curve is different than the shapes in Scenarios 1-9, which is due to the different WTP probability distribution. Figure 24. The empirical probability distribution of the NPV for Scenario 9. The x -axis shows the simulated NPV in ksek and the y -axis represents the allocation density in fractions of N= The simulation of Scenario 10 indicated a mean NPV of MSEK. The 95 % confidence interval stretches between MSEK and MSEK. The mode value cannot be extracted from the graph with full precision but can be estimated to be somewhere around 165 MSEK, with an allocation density of about 8.3 %. Hence, the mode NPV is about 28 MSEK, or 14 %, smaller than the mean NPV. 82
103 The acceptability curve for scenario 10 is presented in Figure 25. Figure 25. Acceptability curve showing the probability of a positive result for Scenario 10. The x -axis represents the simulated NPV in ksek and the y -axis represents the chance of profitability. As can be seen in the figure, the NPV values represented on the x-axis has both low negative values and high positive values. The graph shows that the probability of socio-economic profitability is almost 100 %. The NPV for Fortum was not affected by the change in the choice of WTP distribution. However, the NPV for the public correspond to MSEK, which is about 5 % lower than in the original analysis. The simulation of Scenario 10 indicates a positive value with a close to 100 % chance of being socio-economic profitable Scenario 11: WTP based on Värmland and 85 % of the cost covered by Vattenkraftens miljöfond Scenario 11 is a combination of Scenario 7 and Scenario 8, where a fund solution, Vatten kraftens miljö fond, is assumed to cover 85 % of the investment cost and OPEX and the WTP is calculated for Värmland instead of for the whole country of Sweden. Thus, the WTP inputs are significantly lower compared to Scenario 1. The mean value of the simulated NPV for Scenario 11 correspond to approximately MSEK. The minimum and maximum values of the 95 % confidence interval of the mean NPV were MSEK and MSEK, respectively. In Figure 26, the empirical probability distribution of the NPV for Scenario 11 is presented. 83
104 Figure 26. The empirical probability distribution of the NPV for Scenario 11. The x -axis shows the simulated NPV in ksek and the y -axis represents the allocation density in fractions of N= The NPV values ranges from MSEK to MSEK. It can be seen that the mode is somewhere around MSEK, with an allocation density of about 4.5 %. Thus, the mode value is close to the mean value of MSEK with only a 6 % lower value. Figure 27 presents the probability of a project profitability for Scenario 11. Figure 27. Acceptability curve showing the prob ability of a positive result for Scenario 11. The x -axis represents the simulated NPV in ksek and the y -axis represents the chance of profitability. As can be seen in the Figure, there are solely negative NPV values on the x-axis, which means that the acceptability curve shows that there is a 0 % likelihood of a positive result for Scenario
105 In this scenario, the mean simulated NPV for Fortum corresponded to MSEK and the generated benefits for the public correspond to approximately MSEK. Just as in Scenario 7, where the fund also covered 85 % of the costs but the WTP was calculated for the whole country of Sweden, the NPV of the OPEX and production loss over the project lifetime of 40 years corresponded to MSEK and MSEK, respectively. The NPV of the CAPEX was MSEK. The difference between Scenario 11 and Scenario 9 lies within the WTP and the generated benefits for the public. The two graphs presented in Figures 26 and 27 and the mean NPV of all shows that Scenario 11 has a negative socio-economic result Scenario 12: Decrease of the discount rate In Scenario 12, the discount rate was decreased to 2 %. The empirical probability distribution of the simulated NPV can be seen in Figure 28. The span ranges from MSEK to MSEK. Figure 28. The empirical probability distribution of the NPV for Scenario 12. The x -axis shows the simulated NPV in ksek and the y -axis represents the allocation density in fractions of N= This result in a mean NPV of MSEK with a 95 % confidence interval between MSEK and MSEK. The total mean NPV corresponds to about a 13 % decrease of the total NPV in comparison to the original scenario. The mode value cannot be determined with full precision from the graph but is somewhere around 142 MSEK. Thus, the mode NPV is about 20 % lower than the mean NPV. The acceptability curve for Scenario 12 is presented in Figure
106 Figure 29. Acceptability curve showing the probability of a positive result for Scenario 12. The x -axis represents the simulated NPV in ksek and the y -axis represents the chance of profitability. The acceptability curve shows that the probability of a positive result is 100 % for scenario 12, since the x-axis solely has positive NPV values. The change of the discount rate has an impact on all the parameters in the calculation of the NPV. In this scenario, Fortum s NPV was calculated to MSEK and the public s NPV MSEK. The new values, in comparison to Scenario 1, was for the NPV of the CAPEX, MSEK for the NPV of the OPEX and MSEK for the NPV of the production loss. The result shows that Scenario 12 has a 100 % chance of socio-economic profitability. However, investigating the chance of profitability was not the purpose of this Scenario, but rather illuminating the significance of the discount rate Scenario 13: Increase of the discount rate Scenario 13 originates from the original scenario with the change of an increase of the discount rate to 4 %. The probability distribution of possible NPVs can be seen in Figure 30 and its span is stretching between MSEK and MSEK. 86
107 Figure 30. The empirical probability distribution of the NPV for Scenario 13. The x -axis shows the simulated NPV in ksek and the y -axis represents the allocation density in fractions of N= The simulated analysis provided a total NPV of MSEK, which is almost a 10 % increase compared to the total NPV in the original scenario. The corresponding 95 % confidence interval of the mean NPV ranged between MSEK and MSEK. The mode NPV has a value somewhere slightly above 187 MSEK, which is about 17 % lower than the mean NPV. The acceptability curve for Scenario 13 is presented in Figure 31 and indicates a 100 % chance of a positive socio-economic result. Figure 31. Acceptability curve showing the probability of a positive result for Scenario 13. The x -axis represents the simulated NPV in ksek and the y -axis represents the chance of profitability. Scenario 13 resulted in an NPV value of MSEK for the public and MSEK for Fortum. All parameters are affected by a change in the discount rate and thus, the new value for 87
108 the NPV of the CAPEX was MSEK, while the NPV of the OPEX and the production loss during the project lifetime was MSEK and MSEK, respectively. The result shows that Scenario 13 has a 100 % chance of socio-economic profitability. However, just as in Scenario 12, the purpose of the creation of the scenario was not to investigate the chance of profitability, but rather illuminating the significance of the discount rate. The WTP limit of socio-economic profitability In order to find the limit where the WTP causes the NPV to become zero, the original scenario was used and the WTP parameter was set to zero. The resulting mean NPV was calculated to SEK. The number of Swedish households is , which was derived in section By using the number of Swedish households together with the mean NPV of SEK, it was found that the WTP that results in an NPV of zero is 35 SEK per household, this amount applies if all Swedish households are willing to pay for a trap-and-transport implementation in Klarälven. The same calculation was performed for Värmland, where the number of households is which was derived in section The result showed that in order to reach a project NPV of zero, the WTP in Värmland must be 1260 SEK per household. These results show that in order for the Edsforsen project to become socio-economically feasible and depending on whether or not the WTP is calculated for the whole country of Sweden or solely for Värmland, the WTP must be higher than 35 SEK per household and 1261 SEK per household, respectively. Valuation of the fish As a complementary result, a further evaluation of the smolt survival was performed. The aim was to acquire a more specific value on how many smolts that will be produced within the project lifetime of 40 years and find the lowest cost per fish that would still make the project socio-economically profitable, i.e. when the NPV is larger than zero. The socio-economic result indicated that the total cost of the project, calculated as an NPV over the project lifetime, would correspond to about -161 MSEK if a downstream trap-and-transport solution would be implemented in Edsforsen. The total cost includes the CAPEX and OPEX as well as the cost of emissions and production loss. The main limiting factor of the smolt production is the natural restriction of how many smolts the habitat can bear. There is no precise data on the size of the available smolt production habitats in Klarälven, only guesses and assumption can be made. According to Vänerlaxens fria gång (Gustafsson et al., 2015), the habitats correspond to about 377 ha and the maximum smolt production to approximately 300 smolt per ha. This entails a maximum annual production of smolt in the area between Edsforsen and Höljes power plant. However, it is possible that the spawning and upbringing areas for the smolt are much lower due to calm water areas and large water depths. If the habitats would instead be assumed to correspond to 100 ha, the maximum smolt production would consequently correspond to smolt per year. As previously described in section , the trap efficiency is assumed to be 80 % and it is also assumed that the entailed downstream smolt survival would correspond to smolt per year during the first five years. It is assumed that this amount would be constant during the first five years until the first smolt after the trap implementation would grow up in the lake, return for spawning and for its offspring to grow up to smolt. If only 1 % of these smolt would 88
109 return, the upstream transportation would be smaller than during previous years. Therefore, if an assumption of 10 % would instead be made, the current downstream survival would correspond smolt, due to the current average returning rate of 690 kelts. That assumption seemed reasonable and was therefore used in the calculation. It is assumed that the salmonid needs to spend two years in the lake before it is ready for spawning. This assumption was based on the Baltic Salmon Fund (2018), which stated that the salmonid requires one to four years before they are ready for spawning. Using the assumed returning rate of 10 %, a total of spawning wild salmonids would be transported upstream on the third year. These salmonids would subsequently be able to produce about smolt. These smolts would thereafter migrate downstream after approximately three years (Gustafsson et al. 2015). If the habitat is as large as 377 ha, it would be possible to reach this amount of smolt. If not, the amount of smolts would probably be capped by the maximum habitat capacity. Both the case with 377 ha and the case with 100 ha were evaluated and all the calculations can be found in Appendix D. When a habitat of 377 ha is considered, it is assumed that the maximum smolt production would be reached after eleven years, due to the time it takes to stabilize the growth of the population and for the lifecycle to be completed. The total amount of smolts that survives the downstream passage would correspond to about 3.19 million smolts during a time period of 40 years. When a habitat of 100 ha is considered, the smolt production would reach the maximum production capacity already after five years. Hence, during a 40 year period, the total smolt production would be 0.95 million. If these numbers are compared to the current values, different survival rates need to be considered due to the high uncertainty regarding the downstream survival. The first one that was considered was a 16 % survival rate. If this survival rate would be the same over a 40 year period it would entail a production of smolt. If a current survival rate of 30 % is used instead, the corresponding amount would be smolt. If a further increased survival rate of 60 % is used, which could be possible according to Vänerlaxens fria gång (Gustafsson et al., 2015), the production would reach smolt over a period of 40 years. The different survival rates in combination with the two sizes of habitats entails a total of six different combinations, which each provide different marginal costs per survived smolt. The limit for when the project becomes socio-economically profitable is when the total NPV becomes larger than zero. This limit was calculated for all six alternatives and represents the lowest cost per fish that still makes the project socio-economically profitable. The result is presented in Table 6. See Appendix D for the full description of the calculations. Table 6. Result of t he calculation of the cost per smolt for different habitat sizes and smolt survivals. Alternative Habitat [ha] Current smolt survival [%] Marginal c ost/smolt [SEK]
110 Alternative 1, with a habitat of 377 ha and a current smolt survival of 16 % entails the largest increase in smolt survival, hence it provided the lowest marginal cost per smolt at approximately 50 SEK per smolt. The alternative that entailed the largest marginal cost per smolt was number 6, with a habitat of 100 ha and a current survival rate of 60 %, which yielded a cost of 580 SEK per smolt. These two alternatives are the most extreme ones out of the six but provides an estimated interval of the value of one smolt transported from Edsforsen downstream Klarälven. As the result of the calculation shows, the value depends on the limiting factors of smolt survival and size on upbringing habitats. 90
111 9 Discussion This chapter comprises the discussion of the obtained results from the CBA of the downstream trap-and-transport solution in Edsforsen and the result from the valuation of the fish. The chapter also includes an evaluation of the methodology used in the analysis as well as of the CBA tool and CBA methodology. It also discusses the impact of HMWB and the fund solution, Vatten kraftens miljö fond. Evaluation of CBA result It is likely that Klarälven will be subject to high prioritization in Nappen, which means that Fortum, the sole owner of the hydropower plants downstream Edsforsen, will have to act to improve the surrounding environment to ensure that they can continue their power production. The original scenario, Scenario 1, resulted in an NPV of approximately 204 MSEK with a 100 % chance of socio-economic profitability. In this scenario, it was assumed that Fortum chooses to lend money to cover the investment cost. This could be the scenario either if Fortum lacks liquidity or if they have liquidity but want to explore the option of potentially receiving a higher annual return than the annual cost of interest for the borrowed money, by choosing to invest the money elsewhere. However, if a part of the cost would be funded by Fortum s own capital, the interest cost would have been reduced and the final mean NPV would have been even higher. The NPV would then approach the results in Scenarios 4 or 5. These scenarios were created with the purpose of investigating the importance of the type of funding. In Scenario 4, it was assumed that Fortum would cover the investment with own money, depreciated over 40 years. Scenario 5 is almost identical to Scenario 4, except that in the former, the cost is considered a one-time investment at year 1 and year 21. The scenarios were created for comparison purposes, to enlighten the difference in the present value when using a depreciation and discounting. Compared to Scenario 1, Scenario 4 resulted in an increase of about 21.6 % of the total mean NPV of the project. The mean NPV of Scenario 5 solely constituted about 97 % of the mean NPV in Scenario 1. Hence, the difference between Scenario 4 and 5 was large, where the former resulted in an increased NPV and the latter in a reduced NPV. The total mean NPV for Fortum was approximately -113 MSEK in Scenario 4 and -163 MSEK in Scenario 5, which clearly shows the impact of the discounting. In reality, the payment needs to take place year 1 and year 21 and the depreciation is simply an accounting adjustment, where the investment cost is spread out over the project lifetime and not considered a full payment at year 1. In Scenario 2, it was assumed that Fortum would cover the investment cost using own capital and that an opportunity cost would appear due to the potential of investing the money elsewhere and receive an annual revenue. Despite the alterations from Scenario 1, the scenario still provided a positive NPV of about 43 MSEK. However, it was a reduction by almost 79 % in comparison to Scenario 1. Hence, if accounting for an opportunity cost with a compound interest rate of 4 %, the incentive to implement the project reduces significantly. Scenario 3 is very similar to Scenario 2, with the difference that the opportunity cost is lower due to the exclusion of the compound interest. Despite the inclusion of an opportunity cost, the total mean NPV of Scenario 3 was still very high and about three times higher than the mean NPV of Scenario 2. Whether or not to account for an opportunity cost in this specific project is debatable. From one perspective, it can seem logical as the money could be invested elsewhere and thus, entail an annual revenue. From another perspective, the trap-and-transport solution in Edsforsen is not a project that Fortum would do for economic profit, but because they would be forced to do it. If so, the alternative would be to shut down the plants in Klarälven, which would result in a very 91
112 high loss of revenue for Fortum. It is reasonable to assume that the money that would be invested in the trap-and-transport project would either way be allocated for environmental nonprofit measures, which would consequently eliminate the opportunity cost. In Scenario 6, the impact of an increased standstill cost of 40 % during the construction was evaluated. The result showed that a prolonged standstill time would lower the mean NPV, but not to a great extent. The difference was relatively small, with a mean NPV of about 198 MSEK instead of 204 MSEK, as in Scenario 1. Thus, the production loss constitutes a comparably small fraction of the total project cost and is not a crucial parameter for the project feasibility. In Scenario 7, the inclusion of Vatten kraftens miljö fond was investigated. Using the same inputs for the WTP and the environmental cost of emissions, the remaining costs were inserted as 15 % of their original values from Scenario 1. The resulting mean NPV was substantially higher than in Scenario 1, with an increase of about 66.5 % and a value of roughly 339 MSEK. As the result showed, the socio-economic benefit of the Edsforsen project was tremendously improved. However, it is reasonable to assume that the funding from Vattenkraftens miljöfond still must be considered a cost that should be included in the socio-economic analysis as the cost of the project is of the same size even if it is decreased for Fortum. This since the money invested in the project by the fund could have been placed elsewhere and hence, contributed to other environmental benefits. From the perspective of Fortum, an 85 % reduction of the investment cost would highly increase the incentive to implement the project and if a financial analysis is to be performed, the impact of Vattenkraftens miljöfond should be included. However, the purpose of performing a CBA is not to conduct a financial analysis, but to evaluate the socio-economic profitability and prioritize between different project proposals and through that, find the most beneficial environmental improvements. Thus, to get a full socio-economic perspective of the result, the entire cost of the project should be included in the CBA and the contribution from the fund should not be considered in the calculation. In Scenario 8, the WTP input values were considerably reduced. The resulting mean NPV was close to -151 MSEK, which is a reduction by almost 355 MSEK compared to the mean NPV of 204 MSEK in Scenario 1. This demonstrated the impact of the WTP in the trap-and-transport project in Edsforsen and illuminates the importance of the precision in the estimation of this parameter. In Scenario 9, the production loss was doubled for all 40 years, which also doubled the cost of emissions during the same time period. It is assumed that the replacement power for the production loss will be generated from Danish coal. The usage of this energy source is based on availability, small transportation distances and cost. The energy system in Sweden utilizes its renewable energy resources to their maximum and there is currently no possibility of using compensatory renewable energy. However, the lifetime of the project stretches over 40 years and it is highly likely that the energy system will change during this time period. In the analysis, it is assumed that compensatory coal will be used for all 40 years, but it is possible that a surplus of other renewable sources will work as replacement power in later years to come. On the other hand, there is also a possibility that the electricity demand will increase due to development, which would entail a continued necessity of replacement coal for the hydropower production loss. The future is uncertain and so are the predictions, which entail uncertainties in the environmental cost of future replacement power. However, in the CBA performed in this project, the production loss and cost of emissions had a comparably low impact on the final result. The doubling of the two resulted in a reduction in the mean NPV by about 6 % compared to Scenario 92
113 1. The cost mainly arises due to Fortum s reduced income from production, whereas the increase in the cost of emissions was fairly insignificant. In the original scenario, the WTP was inserted as a triangular asymmetric distribution, with an interval and a best guess. The triangular distribution was chosen as it is suitable for situations where the user has an idea of the interval and the skewness of the parameter, which was the case for the WTP used in the CBA performed for this report. The triangular distribution is similar to the normal distribution but is an appropriate choice of distribution if the knowledge of the statistical data is limited or inadequate. The normal and lognormal distribution is common when describing social and environmental studies, as they often have a high precision in these types of statistics. In the CBA performed for this report, the choice of WTP was based on a study performed for Vindelälven and the data provided in the report was limited. However, if a project-specific survey is performed, all data will be available and other distributions such as the normal distribution can be used instead. In Scenario 10, a lognormal distribution for the WTP parameter was tested for comparison purposes, as opposed to the asymmetric triangular distribution used in the other scenarios. The tool required the user to insert a best guess and a value that he or she estimated as the 97.5 percentile. The values inserted were the same as the interval used in the asymmetric triangular distribution, which consequently entailed uncertainties due to the lack of knowledge about the real distribution. However, the mean NPV was decreased by approximately 5 %, which showed that there was not a significant difference between these distributions in this specific CBA. However, the choice of distribution is in general important for the final result, in particular for parameters that have a high impact on the result. It is important that there is sufficient data for the choice of distribution and the latter must be chosen according to the availability of the former. In this CBA, only two distributions were used, an asymmetric triangular distribution for the WTP and a uniform distribution for the cost of emissions. As the WTP parameter had a much more significant impact on the result than the cost of emissions, the empirical distribution of the final NPV in this CBA was highly affected by the asymmetric triangular WTP distribution. In other CBAs, there might be more parameters described by probability distributions, which enhances the importance of choosing them with precision. Scenario 11 combined Scenarios 7 and 8 with investment funding from Vattenkraftens miljöfond and a reduced WTP. Despite the tremendous decrease of the CAPEX and OPEX, the CBA still resulted in a negative mean NPV of about -15 MSEK. Thus, the analysis showed that the project still is not socio-economic profitable due to the reduction in WTP. Again, this demonstrates the impact of the WTP parameter and the importance of using trustworthy data for the analysis. In Scenarios 12 and 13, the discount rate was changed. Both a decrease and an increase were tested, while the rest of the input parameters were kept the same. The result revealed how crucial the discount rate is for the analysis and what a large impact it has on the result. The difference between the mean NPV in Scenario 12, where the discount rate corresponded to 2 %, and in Scenario 13, where it corresponded to 4 %, was approximately 46 MSEK during the lifetime of the project. This is a significant difference since the rest of the parameters are identical in the two scenarios. To obtain a more precise result from a CBA, it is important to use a discount rate that mirrors the reality to the furthest extent. The tool allowed for a varying discount rate over the project lifetime and with more knowledge, it would be possible and preferable to adjust the discount rate for each year. 93
114 In some situations, when a sample has extreme outliers, the median value can provide a more legitimate and valid image of reality than the mean value. A large difference between the mean and median value indicates that the sample has such outliers. The median value can be used in case of suspicion of errors in the mean value but is only representative if the outliers are symmetrical around the real value. In our scenarios, there is a possibility that the mean NPV overestimates the benefits of the project. As no median values are provided in the result report and as it is impossible to the determine or estimate the median value from the empirical probability distribution graphs, the presence and influence of outliers cannot be investigated. When analysing the mean NPV values of all the scenarios, presented Table 5 in section 8.1, it is obvious the most important parameter is the WTP. Looking at the two scenarios where the WTP was calculated only for the county of Värmland, Scenario 7 and Scenario 11, the resulting final NPV was negative in both scenarios. In Scenario 11, the costs of the project is to a large extent funded by Vattenkraftens miljöfond, which logically significantly reduces the amount that Fortum has to pay. If this would be the case, Fortum s incentive to implement the trap-and-transport solution in Edsforsen would increase substantially. However, in Scenario 11, the final NPV is negative with a value of approximately -15 MSEK, which shows that the project is not socioeconomically profitable even if Vattenkraftens miljöfond covers 85 % of the cost, since the WTP is too low. As it is prohibited to catch wild salmonid in Vänern, the TEV of the population preservation and improvement is solely a non-user value. More specifically, an existence value. From an objective standpoint, it seems logical that people in Värmland would have a significantly higher WTP compared to the rest of Sweden. Although the improvement of the wild salmonid habitat solely is an existence value for the public, due to the fishing prohibition, it is a project that will result in an environmental improvement in the ambient area for the population living in Värmland. It seems unlikely that people in the northern or southern part of Sweden would be willing to pay a large amount of money for a project that they most likely will never see the result of, but they might be willing to pay a small amount to improve the wild salmonid population in Klarälven simply because they can see the value of preserving it. If the population was strengthened and catching wild salmonids would become allowed in Vänern, it is likely that the public would find the project more valuable. The project would then implicate both user, non-user and opportunity values and probably result in a higher perceived TEV. People living in other areas in Sweden might also find it valuable that others can utilize the service of fishing, which would be a non-user altruistic value. It is difficult to determine which scenario that is most likely. Whether or not the investment will be covered by Fortum or by a loan is of fairly high importance for the total project cost and consequently the socio-economic result. The opportunity cost has an even higher influence, especially if a compound interest is considered. However, for the purpose of investigating the socio-economic profitability of the Edsforsen project, it seems reasonable to exclude the opportunity cost and assume that the investment money would either way be allocated for environmental measures. If so, Scenario 2 and 3 are irrelevant for the conclusion of the CBA. The result of Scenario 1 shows a large socio-economic benefit and the WTP is the parameter that influences the result the most. The WTPs used in the CBA are based on a survey performed in another part of Sweden for another project. Hence, the WTP is not project-specific for Edsforsen, which would have been preferable. When the WTP was calculated solely for Värmland in Scenario 8, the final mean NPV was negative. 94
115 The result that obtained from the simulation performed by the tool is a mean NPV, hence a discount rate is needed as it is a part of the calculation. When an economic analysis is performed, other possible economic methods could have been used. One example is the Internal Rate of Return (IRR) method, briefly described in section 5.1.6, which is a commonly used method. In this method, the NPV value is set to zero and the IRR formula provides a corresponding discount rate. This kind of evaluation is suited for financial analyses, where an indication of the expected return is needed. The method compares the return from a project with the relative opportunity costs. Since the profits from the trap-and-transport project in Edsforsen solely originates from environmental non-monetary values, is it difficult to obtain a discount rate and from that evaluate whether the project is profitable or not. Another possible investment calculation would be the Benefit-Cost Ratio (BCR), where the costs and benefits are evaluated separately and after which the ratio between the two is calculated. If the corresponding ratio is larger than one, the result is considered profitable. All these three methods are similar to each other, but the one that provides a perspicuous view in the context of this project, where a socio-economic analysis is to be performed, is the NPV method. Evaluation of the value of the fish The evaluation of the cost per fish was developed from Scenario 1, where the total cost of 161 MSEK was considered, which included the overall cost for Fortum and the cost for the public due to emissions from the compensatory power production. The calculated cost varied between around 50 and 580 SEK, which is a relatively large span. The cause of the large span originates from large uncertainties in both the current downstream survival rate and the limitation of the upbringing habitats. There is a limited amount of studies that have been performed within this topic and their findings also consist of uncertainties, which entail difficulties when analysing the increase in smolt survival and the valuation of each individual fish. The calculation of the increase of the smolt survival was primarily based on the two parameters, habitats and current survival rate. Two different sizes of habitats were considered, 100 ha and 377 ha. The three different current survival rates that were considered in the evaluation was 16 %, 30 % and 60 %. This resulted in a total of six different combinations, thus six different results were obtained. The survival rate of 16 % is the most commonly used value in the report. However, this value is based on one study, which consequently entails uncertainties. The survival rate is highly sensitive to the spill and some years are dryer than others, which affects the yearly survival rate. With a small amount of spill, it is more likely that the fish will pass through the turbines instead of alternate spillways. Since the result of 16 % is solely based on one study, which was performed during a time period with a low amount of spill, it could lack cogency and reliability. Also, the measurements were made by tagging the fish with acoustic transmitters and when the fish passed certain locations, the receivers picked up the signal. It is uncertain how smolt are affected by the transmitter insertion. It is possible that the smolts are highly affected, which could potentially cause partial disability. If so, it can be assumed that disabled smolt runs higher risk of becoming a predator prey than a fully functional smolt, which would cause an uncertainty in the result from the study. The calculation of the amount of smolt is based on averages of spawning fish, mean weight of salmonids, survival rates and mean roe production per salmonid weight unit. Some of these parameters can vary from year to year due to external factors such as waterway flow. Also, in rare occasions, no wild salmonids are transported upstream for spawning due to diseases in the population trapped in Forshaga. These types of deviations can entail disturbances of the population growth. These aspects were not considered in the calculations. 95
116 The spawning returning rate of the farmed smolt is approximately 1 %. As it is prohibited to catch wild salmonids in Vänern, this value cannot be directly applied to the wild salmonids and it is likely that they will return to Klarälven to a larger extent. If the 690 returning salmonids would only correspond to a returning rate of 1 %, it means that smolt would survive the downstream passage. In turn, if this number would correspond to 16 % of the total production in the river, the current smolt production would be around smolts, which is much higher than the theoretical smolt production of around that was presented in section , thus an amount of smolts seem unlikely. Furthermore, an implementation of the trap-and-transport facility with a survival rate of 80 % indicated a total of some smolts surviving the passage through the power plants, as presented in section If using the same assumption of 1 % for the wild salmonids later returning for spawning, the corresponding number would only be 225 salmonids. Thus, compared to the number of 690 returning salmonids, the trap-and-transport facility would cause a decrease of returning salmonids, which is incorrect. This argues against the downstream survival rate of 16 % and a wild salmonid returning rate of 1 % and it can be assumed that these numbers are lower than the real rates. Based upon this, another number for the returning rate of the wild salmonids was chosen. It was set to 10 %, which was only an assumption. This kind of assumption was considered reasonable in this project but should preferably be made by an expert within the topic. Further evaluations and population models are required to receive a more certain result of the population growth, which could consequently be used to calculate the value per survived smolt. The main factor limiting the population growth of the wild salmonid is the limitation of how the amount of smolt that the upbringing habitats can produce and house. An average of 300 smolt per hectare was used in the analysis. If the total spawning area would correspond to about 377 ha, the maximum smolt production would correspond to smolt. However, if the habitat would correspond to about 100 ha, which could be possible due to calm water areas and depth limitations, the maximal production would only reach smolt. Neither one of these two maximal smolt productions exceeds the annual number of farmed smolts in Vänern. It would therefore not be possible to end the farming of salmonids, which means that there is a low probability that the prohibition against catching wild salmonids will be removed in the future. These calculations indicates an increase of the natural stock, which enhance the diversity, but it would not be possible to strengthen the stock enough to be able to stop fish farming in Klarälven. This further entails that actors such as anglers and local business will not be largely affected by the Edsforsen project, as it will not result in more fishing opportunities. All uncertainties within the calculations entail doubts regarding the reliability of the interval of the cost per smolt. Thus, the result obtained from the fish valuation should be considered more of a guideline than a precise result. Evaluation of methodology This section discusses the methodology used when finding the values for the non-market benefits and the trap efficiency Valuing non-market benefits When the valuation of non-market goods was performed, it was decided that a Stated Preference Method (SPM) should be used instead of a Revealed Preference Method (RPM), both described in section The reason behind this decision was the that the SPM uses a hypothetical scenario, 96
117 where the public can state their preferences through a survey, while the RPM is a market based method, where the valuation is based on people s decisions and behaviour on the market. The proposed trap-and-transport project can be seen as a hypothetical scenario with a general increase of the fish stock. This since it in this project is impossible to predict an exact increase of the smolt survival with the implementation and thus, an exact market value is impossible to assess. When a WTP is obtained from a survey, it is important to collect answers from different groups and individuals, with different age and income levels living in different areas, to obtain a result that reflects the average citizen. The larger the number of collected answers, the better the accuracy of the result. The WTP used in this project was developed from a project in Vindelälven, performed in 2004, which investigated the WTP for an increase of migrating fish in the river. In total, people randomly selected in Sweden received a questionnaire and people answered it, which corresponds to a responding rate of 66 %. These results were compiled and translated into today s values and then used to reflect the WTP for the project in Edsforsen. Among the respondents, a total of 41 % stated that they were not willing to pay for an increase of migrating fish in Vindelälven and their WTP was correspondingly set to zero. Moreover, anglers also received the original questionnaires and their WTP was significantly higher due to their interest in the topic. Their answers were excluded from the mean WTP to avoid errors due to extreme outliers. The main benefit of the Vindelälven survey is that it investigates a project with a purpose similar to the one in Edsforsen. Furthermore, the survey is based on classical and interval open-ended (CIOE) questions, which means that the respondents can chose to state their answers either as a specific value or as an interval. The latter option is intended for people that are not entirely certain of their WTP, which makes it difficult for them to state a specific value. With an openended formatted questionnaire, formulations that could potentially lead the respondent to certain answers can be avoided and the answer consequently becomes more accurate and objective. The answers to the questionnaire provide both a point estimation and intervals with upper and lower values, which both are useful in the analysis. Additionally, an interval answer includes less uncertainty than a point answer, since a respondent usually is more certain of an answer if it can be stated as an interval. The received mean values of the answers from Vindelälven were translated to the values used in Edsforsen, but it is likely that a more accurate answer could have been the median value, due to the high responding rate of people who stated that they were not willing to pay anything for an increase of the fish stock in Vindelälven. The uncertainties that came with the analysis in Vindelälven were consequently brought over to the case in Edsforsen. The largest uncertainty of the survey is that it did not state whether the WTP was per individual or per household, which consequently caused an ambiguity and a large margin of error. Another uncertainty with the WTP is that it is a summation of answers from different survey questions with different smolt increases. Yet, the performed study in Vindelälven states that the summation stands for a 33 % increase of the stock. This assumption was not translated into the Edsforsen case, instead it was assumed that the WTP regards a general increase of the stock in Klarälven. There are also errors that can emerge due to the conversion of the 2004 values to 2018 values. Firstly, the values are based on the mean net income in Sweden. It is possible that this amount does not accurately represent a regular citizen due to large income differences. A median value of the net income could potentially have provided a more trustworthy value for the analysis. The 97
118 public s interest in environmental measures might also have changed since the surveys were carried out. People might be more aware of environmental issues today than they were before and might potentially be willing to pay more now than before in relation to their income. But it could also be the other way around. The restrictions of catching wild salmon and trout in Vänern could potentially cause people to be less willing to pay, as the Edsforsen project solely enhances the wild salmonid population. The chosen WTPs from the result in Vindelälven was weighted between the northern and southern population to create an average for the entire Swedish population. However, the differences between the answers from the WTP survey in Vindelälven indicates that the population living closer to the location in question is willing to pay more than the population located far away. Hence, it could have been more accurate to assume that the people close to Vänern would be willing to pay more than the rest of the country. Based on this, Scenario 8 was developed, where it was assumed that only the people close to Vänern and Klarälven would be interested in paying for an increase of the fish stock. In this scenario, it was also assumed that the rest of the country had a WTP of zero. However, the questionnaire was sent out to randomly selected people in Sweden and the mean NPV value for people far from the location of implementation still indicated that they were willing to pay more than zero. A better solution could potentially have been a compromise between these two assumptions, assuming that the people living close to Klarälven would be willing to pay a bit more than the average WTP value for the whole country and that the people living further away would pay less than the average but not as little as zero. The optimal solution would have been to create a new survey for the specific trap-and-transport solution in Edsforsen, which could be handed out both to people living close to Klarälven and to people in the rest of the country. However, this was not possible within the scope of this thesis due to time constraints. If this would have been possible, the WTP would have been more accurate and reliable. With all the survey answers, it would have been possible to know more about the standard deviation and the mean and median values of the sample, which would have provided better data and a possibility of using another type of probability distribution Validity of the trap efficiency In the CBA performed in this report, the efficiency of the proposed trap in Edsforsen was set to 80 %, which was based on the estimation made by Greenberg et al. (2018) of a trap efficiency between 76 % and 100 %. The interval assumed that the majority of the fish will swim towards the turbine intake where it is led towards the floodgate and the trap. The path the fish chooses is assumed to be correlated to the amount of spill. Thus, a larger amount of spill entails a higher amount of fish that chooses the spillways instead of the trap and the trap efficiency is consequently highly dependent on the amount of spill. Edsforsen s turbine intake has a capacity of 195 m 3 /s and according to average daily data for the period between provided by Fortum, the maximum turbine capacity is normally exceeded between April 30 and June 11, entailing high spill. Smolt mainly migrate during the spring and hence, it can be assumed they will migrate during the time period when there is a large amount of spill. During the days with high flow, the trap efficiency varies, which entails an uncertainty of the average trap efficiency. Salmonids that migrate during other seasons than spring are more likely to be caught in the trap than the ones that migrate during spring, due to less spill. Thus, the trap is more efficient for certain salmonid types, such as the kelt which migrates during the fall. Also, for salmonids that chooses the path through the spillways instead of the turbine, i.e. the trap, smolts have a larger 98
119 chance of surviving the downstream passage through the seven remaining power plants than the kelts. Hence, since the kelt has a lower potential of surviving the passage through the turbines in comparison to the smolt, it is convenient that there is less spill when the kelt is migrating. Average flow rates in May vary between 213 m 3 /s and 271 m 3 /s, see section 2.4.1, and with a turbine discharge capacity of 195 m 3 /s, the spill would on average vary between 8.5 % and 28 %. With a directly correlated trap effectiveness it would correspond to an efficiency of between 72 and 91.5 %. These numbers can be compared with the trap efficiency of between 76 and 100 % stated by Greenberg et al. (2018). However, during extreme years, the highest discharge rates during spring and summer reached as high as 950 m 3 /s. In these situations, about 80 % of the water goes through the spillways and the trap would therefore only reach an efficiency of approximately 20 %. During the rest of the year, the average water discharge rate does not normally exceed the total discharge capacity of the turbines. Hence, salmonids migrating during that time will be caught by the trap to a larger extent than salmonids migrating during the most intensive flow period. These calculations justifies the assumption of an average trap efficiency of 80 %. Evaluation of CBA The two different socio-economic assessment methods that were discussed in this project was the MCA and CBA, where the latter was the one used for the analysis of a possible implementation of the downstream trap-and-transport solution at Edsforsen power plant CBA tool The main purpose of the CBA tool is to conduct a socio-economic analysis, but it also offers the possibility of performing a financial analysis. The tool compiles input data and calculates an NPV that indicates whether the project in question is socio-economically profitable or not. The user must provide all required data for the tool and the tool performs the calculations. The user-friendliness can be said to be relative to the user and his or her knowledge. The webpage where the tool can be accessed provides several tool descriptions and help files, which are highly useful for the user. However, it might take some time to get used to the tool and its functions. The tool requires a lot of specific data before it is possible to perform calculations and when using the tool for the CBA in this report, the majority of the time was spent on collecting data instead of using the tool. Generally, the main issue with performing a socio-economic CBA is to put monetary values on environmental benefits. If an effect cannot be monetary valuated, it is possible for the user to do a so-called non-monetary valuation and insert whether it is a large or a small cost or benefit. If any of the parameters is described as a probability distribution, the tool performs a simulation. If not, it simply performs a calculation of the NPV. When all the parameters are identified and inserted into the tool, the calculation or simulation is performed. The tool creates a report for the user with all necessary input data as well as the calculated NPV. The chosen magnitudes for the non-monetary evaluation is solely attached as a page in the report and is not included in any calculations. If non-monetary consequences are described, the readers of the report must by themselves evaluate the importance of these parameters in comparison to the calculated NPV. Hence, if several consequences cannot be expressed in monetary values, the purpose of performing a CBA is somewhat depleted. On the other hand, incentives such as VISS measures and whether or not the project is a prerequisite to attain the 99
120 EQS of a water body or a favourable conservation status for a Natura 2000 area are also simply listed in the result report. Hence, the reader is required to take them into account as well. Before performing a CBA, the analyst must predict whether or not the consequences that cannot be expressed in monetary values has such a large impact on the result that the calculated NPV will be misleading. If so, the CBA might be unnecessary and lead to confusion. When performing a CBA, the analyst needs to identify consequences, costs and other potential parameters that might be affected by an implementation of the project. It is a step that is relatively difficult and requires an extensive analysis. One of the main benefits with the tool is the framework that it provides, as it guides the user through the steps of a CBA. The tool includes an example list of common consequences from environmental measures and if the user chooses to utilize this, he or she can simply insert how much each parameter is affected. An example list of potential affected actors is also included, which facilitates and simplifies the analysis progress. Another benefit with the tool is that it comes with an extensive list of help texts, which consist of both general information, descriptions and examples that highly increases the user-friendliness of the tool. Furthermore, there are also additional available Excel help files that aims to ease the preparatory calculations of input data. Although these help files can be helpful, it can be just as easy for the users to perform the calculations on their own. Another example of these help files is the one used for calculation of production loss. The required form of input data for this file was a fixed annual value, while in reality, the power curtailment due to spill fluctuates. In this project, the amount of spill as well as the gross head varies due to periodic changes in the water levels. Thus, the help file served no purpose in the CBA performed in this project. If the data is inserted as intervals or point values instead of probability distributions and if the user possesses knowledge about how to calculate an NPV of a project, the tool is not really necessary. If so, it might take longer time to get familiar with the tool instead of actually performing the calculations. Worth mentioning is that it mostly depends on how much input data the analysis requires. If the project is complex with several affected actors and consequences, the tool will simplify the process by sorting data and calculating a result with specific data for each actor. The tool is helpful and useful if at least one of the input parameters has a value described by a probability distribution, since it performs a Monte Carlo analysis and provides a distribution of the simulated result. If some of the values are inserted as probability distributions rather than point values, the CBA tool performs a simulation with a Monte Carlo analysis to obtain a result. The Monte Carlo method use random values from the input data and combines and summarizes them accordingly the NPV calculations to provide a result in form of an interval with a probability distribution. The accuracy of this kind of method mainly depends on the number of performed iterations. The more iterations, the better the accuracy. In the CBA performed in this report, the simulation was tested with a different number of iterations. Even with a small number of iterations, a relatively distinct shape of the distribution could be seen. However, to get an enhanced result, the number of iterations was chosen to for all simulations. The Monte Carlo method is useful for this kind of statistical evaluations, where different parameters need to be randomly combined. Worth mentioning is that an analyst with relatively good Excel knowledge could without any tremendous effort perform a Monte Carlo analysis outside of the program. However, the tool removes the need of a time consuming creation of an excel program and provides a framework 100
121 with guidelines for how to perform a CBA. In this context, the tool is convenient and simplifies the analysis. If desired, the input data can be described as probability distributions, choosing between uniform, triangular, asymmetric triangular or lognormal distribution. Triangular distribution is the one most similar to normal distribution and can be used as a substitute in the tool. In the project, asymmetric triangular distribution was the probability function that was used for the WTP. In order to choose the type of distribution, the CBA executor must possess or acquire knowledge within statistics, such as statistical requirements and expressions. Generally, it can be said that the tool could be relevant and helpful when a CBA should be performed. The largest obstacle experienced during this project was to define monetary values on the environmental benefits. This is the general problem when conducting a CBA and always needs to be dealt with. Therefore, it is to recommend that the users either has extensive knowledge in both economics and ecology or that the data for the analysis is collected in collaboration with experts within the respective fields. As previously mentioned, the tool is accompanied by a number of help texts, which can ease the analysis of the environmental costs and benefits and elucidate the investigations that needs to be performed in order to find data for the CBA. One of the help files that were used in the CBA performed in this project was the database consisting of relevant primary studies. The studies were used to estimate the WTP of the environmental benefits of the project. The database is still limited and would need to be further developed. In the time of writing, the database includes ten studies, mainly from Sweden but also from Austria, Denmark and Ireland. Although the currency issue occurs when using foreign studies, the result can be translated by using a PPP, as mentioned in section , or alternatively, by using the help file provided by Energiforsk. In this project, the database became helpful as it provided a study of the project in Vindelälven, which had similar expected effects as the ones expected from the Edsforsen trap-and-transport solution. However, the data from the study was limited and the background of the result had to be evaluated before it could be used in the Edsforsen project. The database serves as a list of collection of studies in this project. As the number of studies is limited, an extension of the database could be considerably helpful for the users of the tool. When a CBA is to be performed in a project with a low budget or with time constraints, it might not be possible for the analysts to perform project-specific surveys and the usage of the database thus becomes highly beneficial. When all data is inserted in the tool and the simulation has been performed, it is possible to create a report with the obtained result. In order to see the result, this is a necessary step, as many of the calculation answers cannot be accessed straight from the Excel program. Often, several simulations must be performed and sometimes also with different numbers of iterations. When a simulation is performed, the Excel program presents two graphs: the distribution of the result and the acceptability curve. However, no mean or median value are shown in the graphs, which are necessary to obtain an overview of the analysis. The two graphs are not included in the report, which solely provides the mean value of the total NPV. Hence, in order to obtain a perspicuous and informative result, it is necessary to look at both the created report and the graphs presented in the tool as the total result is not combined anywhere. This is a slight drawback of the tool. It would have been preferable if it was possible to access all of the calculation answers directly from the Excel sheet instead of having to create a pdf file each time a simulation is made. Also, if more than one scenario is created and simulated, the tool has issues with presenting data after the program has been saved and shut down. When the user reopens the program again, the tool allows access to the empirical distribution graph as well as the 101
122 profitability curve for one of the scenarios but does not allow for the user to switch between them. Hence, the user cannot access the graphs for all scenarios without performing a new simulation, which consequently provides a slightly different result due to the Monte Carlo analysis. The new simulations entail the need of creating a new report with the new result. It is possible that this is a malfunction that will be adjusted in future versions of the program, but in the version used in this project, cba -verktyg -v41_tom_ , it caused large issues. The lack of median NPV values in the result report eliminates the possibility of investigating the influence of outliers in the data sample. However, the importance of comparing the mean value to the median value is heavily reduced by the large amount of iterations. The median can sometimes provide a more realistic image of reality than the mean value, but it usually only applies to small samples. In the performed CBAs, the number of iterations was set to , which provides a relatively large sample of data. However, if the tool would have provided a median NPV value, it would have been a valuable complementary result that could have been used as a comparison. Another issue with the version of the tool used in this project, cba -verktyg -v41_tom_ , is that it does not allow for the creation of more than two scenarios without crashing, if the scenarios are copied and based on the original scenario. A theoretical advantage with the tool is that it is supposed to allow the user to create an original scenario, which can be copied to investigate changes in certain parameters. This is a very important feature of the tool, as it makes it possible to perform sensitivity analyses in a simple way by simply making small adjustment to a copy of the original scenario. However, although several attempts were made, the tool did not allow for more than one copy of the original scenario. If more scenarios were created, the tool compiled the data from the second and third scenario into one, which, as anticipated, provided a deceptive result. During some attempts, the system also crashed. Similar to the issues with displaying the graphs mentioned in the previous section, the tool s inability to create more than one additional scenario based on the original scenario might be a defect that will be adjusted in future versions. It would be an essential and crucial update, as the creation of several scenarios is important for the ability to perform sensitivity analyses. In the CBA performed in this project, seven different programs had to be created since the tool only allowed for two scenarios in the same program. This gave rise to some confusion when compiling the data, as several different reports had to be created, which reduced the transparency of the result. Also, the tool has a slow reaction time when switching between different steps, especially when a large amount of data is inserted. Another issue is the error that occurs if data is accidentally inserted in two ways, for instance by two different distributions. Although the user is allowed to choose which one to use by marking the distribution of their choice, the tool does not accept for data to be inserted in the distribution not chosen. If that is the case and a simulation is performed, the program crashes and does not allow for the user to be in charge or go back to the main menu. Hence, the user must restart the program and start over. When the system crashes, an error message appears, but it does not troubleshoot the error to guide the user to it. Thus, if the double input was a mistake, it can become very time consuming for the user to find where he or she has inserted data in the wrong place. The cause of the double insertion might be a simple mistake made by the user, forgetting to remove previously used data, but it might also be that the user is new to the program and wants to try different distributions as a sensitivity analysis, without having to create a new scenario. As 102
123 creating a new project alternative by copying the original scenario takes some time, it would be highly beneficial if inserted data could be kept and that the user could simply choose which one to use. Or, alternatively, the error message appearing when the system crashes during the simulation should show where the error is and guide the user to the parameter input in question. Overall, the tool provides a framework with guidelines on how to perform a CBA and simplifies the process for the user. However, the performance of the cba -verktyg -v41_tom_ version of the tool is not yet fully satisfactory, due to the mentioned malfunctions. As the tool is still under development, it is highly likely that many of these faults will be corrected for and that the performance of the tool will improve significantly. It is of high importance for the purpose of using the tool, as it otherwise becomes somewhat time consuming and inefficient. This since the calculation of the NPV and the Monte-Carlo analysis can be performed in a regular Excel program by using its built-in formulas and functions. It requires time and a certain amount of knowledge within economics and the Excel software, but not to a great extent. However, the main purpose of the tool is not to perform complicated mathematical formulas but rather to guide the analyst through the CBA process. A well-functioning version of the tool would likely be advantageous to use when a CBA is to be performed, but if the malfunctions are not corrected, the tool might slow down and complicate the CBA process instead of simplifying it. Thus, a correction of the malfunctions is of high importance CBA as a socio-economic method The project was performed using a cost-benefit analysis, which is one of several socio-economic assessment methods. A CBA does not only concern parameters that can be measured in economic terms, the whole idea is to provide an overview of all aspects including environmental effects and the impacts on the human health. The CBA is a well-developed and globally established method that is continually developing. The method is used in all different kinds of projects and sectors where values can be expressed in monetary values. The method takes both gained benefits and costs into account, where all factors are addressed over the entire project lifetime. Thus, an objective result will be obtained. A completed CBA will provide the decision maker with an explicit result, since all values are evaluated and expressed in the same unit. As the parameters are expressed in the same unit, the method provides the opportunity of finding the optimal scale of a project, which is when the benefits are maximized. When the result is obtained, it can be determined whether the entire project should be implemented or if only a smaller part of the project, where the benefits are maximized, should be implemented instead. Furthermore, a CBA analysis can identify the distribution of the benefits and costs between all actors and social groups and address the winners and losers of a specific project. In this project, when the Edsforsen project is evaluated, it is Fortum that will be subject to the major part of the costs. The other, comparably small cost, affects the society, caused by the emissions from the compensatory power production. The winner that would receive the benefits of a project implementation would be the public, due to their valuation of a strengthened wild salmonid habitat. If catching wild salmonids in Vänern would be allowed, even more actors would gain profit from the project. The actors that would receive a benefit of the project in such a scenario would for instance be the anglers and the municipality, due to increased tourism. However, fishing wild salmonids is currently not allowed and thus, the public is the sole winner if the project is implemented. In this project, it is impossible to find an optimal scale other than the 103
124 original scale, as it is one large implementation that would not be possible to divide into smaller parts. The CBA requires a conversion of all consequences into monetary values. These translations are performed by the user, which might lead to subjectivity. The main concern regarding this conversion is how to put monetary values on the environmental and the human health consequences. In some cases, it is impossible to put a monetary value on one of these parameters and if the CBA is performed without the parameter that lacks a monetary value, the obtained result will not be perspicuous. Some people expresses criticism against CBA based upon the claim that it is not possible to put a price on benefits from environmental measures and that a comparison between two completely different parameters cannot be performed with precision. However, in this project, where the cost is measured in a monetary unit, which in itself is an anthropogenic figment, it seems logical to measure the environmental benefits according to an anthropogenic perspective as well. An anthropogenic value will not correspond to the potential intrinsic value of the flora and fauna. However, an intrinsic value cannot be measured by a human and hence, cannot be included in these types of evaluations without subjectivity and bias, as they are performed by a human. Thus, if a socio-economic analysis is to be performed, the consequences somehow needs to be made comparable and the anthropogenic perspective can then be considered a relatively good option. This perspective is not optimal, but due to the lack of other comprehensive and perspicuous alternatives, the valuation from using either an SPM or an RPM at least provides an estimation of a value. It can be said that if anyone is willing to pay for a measure, it does have a value, even if it is solely anthropogenic. One way to measure the environmental aspects is by using a WTP, which has been used in the CBA performed in this project. Critique regarding this approach is that it is only based on the individual's valuation of a consequence. The WTP will differ between different classes, age, income and interests, which can cause minorities to be affected negatively even if an overall result would indicate a profitability. A discount rate is needed when data for future costs must be converted into a present value. The choice of rate requires thorough evaluations and estimations, which consequently entails uncertainties. This is a large drawback with a CBA as a method. The discount rate is based on assumptions and there is no established methodology on how to obtain a reliable and valid discount rate. The discount rate is also highly sensitive parameter for the analysis and small changes can cause a large difference in the result. This is because it affects all the inserted data during the calculation of the NPV. The significance of this parameter can be verified by the obtained result from Scenarios 12 and 13, which showed a total difference of 46 MSEK when using a constant rate of 2 % versus 4 %. It shows that the discount rate is crucial for the analysis and needs to be carefully selected. Although the tool allowed for the discount rate to be inserted as either a fixed or a varying value, a constant discount rate of 3 % was chosen for the original scenario, Scenario 1, which was considered reasonable as it was based on literature and Swedish guidelines. Overall, the choice of discount rate is subjective and since it highly affects the result, the user can deliberately affect the result by making a small alteration of the rate. Due to this, the overall result can be manipulated to suit the desire of the analyst. Generally, it can be said that CBA is a transparent method that provides an easily interpreted result that is useful for the decision maker. However, it requires broad knowledge for the collection of data for the inputs. Hence, for a large project, expertise within several areas is usually required. 104
125 There is no socio-economic method without imperfections and a CBA can often be combined with other methods, as a complement. A possible complementary analysis could preferably be a multi-criteria analysis (MCA), which has a different approach than a CBA. As opposed to a CBA, an MCA takes both monetary and non-monetary values into account and ranks each the importance of each parameter and weigh them against each other. The benefits with an MCA is that it uses parameters from several different sectors in the analysis, which entails a qualitative result. The drawback with performing an MCA is that it is up to the user to decide which of the parameters that are the most essential ones. Consequently, the obtained result will be based on the users valuations and preferences. Thus, a subjective result will be obtained. In comparison to a CBA, in which the discount rate is the most subjective parameter, all parameters become subjective in an MCA. Another drawback with an MCA is that if the analysis is complex, with several parameters at the same time, it does not compile it and provide a comprehensible overview. The usage of MCA also entails a risk of double counting when many parameters are involved in the analysis. An MCA will provide a perception of the result and can be interpreted as a complement to the final decision, while a CBA will provide one clear result, which can serve as a foundation of a decision. Generally, it can be said that a CBA is preferable when it is possible to put monetary values on the input parameters or when the project is large and complex, which was the case in this project as several uncertain input parameters were required. Also, the usage of CBA can be significantly useful when comparing between different project alternatives with the same parameter basis. When using CBA in assessments of environmental projects within hydropower, some input parameters can have high uncertainties, such as the discount rate or the WTP. If the parameters of the different project proposals are based upon the same analytical foundation, their corresponding uncertainties can be reduced or even eliminated when compared. This means that although there might be uncertainties in the specific NPV resulting from the CBA, it provides a comparison possibility with other project alternatives. Nonetheless, it is preferable to complement the analysis with an MCA to justify the outcome. The fund solution Vattenkraftens miljöfond When Vatten kraftens miljöfond is established and Nappen is fully developed, the incentives and economic abilities of the hydropower companies to implement environmental measures to improve the ecological status in different waterways will be significantly improved. The application for funding will be possible after the fund is established, and the idea is that the fund should cover 85 % of the project costs. The cost of the Edsforsen trap-and-transport project is high and it is reasonable to assume that the benefit of the project must be substantial in order for the fund to provide financial support. However, there is a public interest for this project, as no large-scale downstream trap-and-transport solution has been implemented before, and this provides incentives for funding. Also, implementing the trap-and-transport project in Edsforsen instead of constructing fishways around all eight power plants between the spawning area and Vänern would be highly economically beneficial. Also, as the Edsforsen trap efficiency will most likely be considerably higher than the accumulated efficiency of the eight fishways, it is reasonable to assume that the smolt and kelt survival will also be significantly higher with the trap-and-transport solution. Thus, Vattenkraftens miljöfond should have a greater incentive to finance the Edsforsen project instead of several fishways along Klarälven. 105
126 HMWB Only certain parts of Klarälven are classified as Heavily Modified Water Bodies (HMWB). Klarälven ns Acksjöälven is classified as a Natural Water Body (NWB), with the same environmental requirements as an unregulated river. As mentioned in , only a few of the regulated waterways in Sweden are classified as HMWB. This constitutes an issue for the operation of hydropower plants, as it becomes difficult to achieve an EQS of good ecological potential. The trap-and-transport project in Edsforsen would significantly improve the connectivity in the river, but it would still not be enough to fulfil the EQS goal. In order for a river to be classified as HMWB, the water body should have no possibility of reaching a good ecological status, due to large physical adjustments and significant modifications of the original characteristics. It also needs to fulfil the four criteria described in As so few of the regulated waterways in Sweden fulfil all the criteria in Sweden, several waterways does not reach a good ecological status. A possible alteration to the requirements of an HMWB could be that a couple of the four criteria must be fulfilled, instead of all of them. This since hydropower is a fundamental pillar in the Swedish energy system with an essential regulating ability. The grid balancing capability of hydropower will likely be of even higher importance in the future, when there will be an even higher amount of fluctuating wind and solar power in the energy system. The discussion of the HMWB classification and whether or not Klarälven and other regulated rivers should be designated as HMWB is not within the scope of this thesis. However, it can be concluded that if the whole river of Klarälven was to be classified as a HMWB, a project such as the trap-and-transport solution in Edsforsen could potentially help the river reaching the EQS of a good ecological potential. Worth mentioning is that a change in the classification would not result in an environmental improvement and the ecological requirements for hydropower operators would be reduced. However, it can be debated whether the ecological status of the river is of higher importance than the GHG neutral power production and regulating capacity of hydropower. If hydropower plants were to be decommissioned due to unsatisfactory ecological statuses, the reduced electricity production would have to be substituted by another energy source. In the energy system of today, this would likely not be GHG neutral electricity. 106
127 10 Conclusion The result of the original scenario shows a large socio-economic benefit, although Fortum will be subject to a large financial loss. For the socio-economic analysis, the impact of Vatten kraftens miljö fond should not be considered, as it is simply a re-allocation of money and not a reduction of the project cost. However, in a financial analysis of Fortum s expenditures, Vattenkraftens miljöfond is highly relevant and should be included. The WTP is by far the parameter with the highest influence on the result. In this CBA, the WTP is a very uncertain parameter, as it is based on a survey performed in another part of Sweden, for another project. It would have been preferable if a project-specific survey would have been performed. When the WTP was calculated for Värmland instead of the whole country of Sweden, the socio-economic result was negative. Hence, the result showed that the project is not socio-economically profitable in that case. Which WTP that should be used is debatable, but as the original survey from Vindelälven provided an average value for the entire country, it seems reasonable to assume that it is more representative for the Edsforsen project than if only Värmland is considered. It is likely that the population in Värmland would be willing to pay more for the project, but that the rest of the population in Sweden would still be willing to pay a small amount. Hence, if the average value for Sweden from the Vindelälven study is solely applied on Värmland, it most likely results in a high underestimation of the WTP. In order for the socio-economic result to be positive, the benefits needs to exceed the cost, thus the WTP for all households in Sweden needs to be at least 35 SEK. To receive a more precise result on how much the salmon and trout stocks in Klarälven would increase by this project, more accurate numbers for the returning rate, the habitat size and the current smolt survival would be required. Due to the large uncertainties in these parameters, both the increase in smolt survival and the marginal cost per smolt consist of high uncertainties. Further evaluations of the habitats and survival rates would have to be carried out through population models and investigations. Even if it is not possible to put an exact monetary value on the fish in this specific project due to all the uncertainties, it can be concluded that the wild salmonid stock in Klarälven would increase with an implementation of the downstream trap-and-transport solution. Nonetheless, as the size limitation of the habitats would cap the smolt production, the population growth would not be enough to phase out the compensatory fish farming. In situations when a socio-economic analysis is required, and it is possible to express consequences in monetary values, the method of CBA is appropriate. It is also suitable in evaluations of large projects, where many sectors and actors are affected, as it provides a comprehensible overview of the costs and benefits. However, it is advisable to complement the result of the CBA with an MCA or another socio-economic method, to justify the outcome. The main issue with using a CBA for environmental measures is that in order to get an explicit and comprehensible result, all parameters must be expressed in monetary values. The criticism towards CBA based upon the anthropogenic viewpoint is reasonable, but as an intrinsic value of flora and fauna cannot be determined without human subjectivity and bias, the perspective seems to be a reasonably simple solution that provides acceptable and comparable results. The anthropogenic perspective may not provide the exact value of flora and fauna or of a service, but after all, that value is impossible to find without subjectivity. Therefore, it can be concluded that the usage of CBA provides a comprehensive, comparable and perspicuous result, which can 107
128 easily be interpreted. It should be emphasized that the usage of CBA is particularly beneficial when comparing between different project alternatives, as it provides comparability through its quantitative result. If the different alternatives have the same parameter foundation with minor alterations, the uncertainties within the common parameters are eliminated. Thus, the usage of CBA in prioritization processes of different environmental measures will likely be highly useful and advisable as it will provide a comprehensible comparability opportunity. The CBA tool provides a framework with guidelines on how to perform a CBA, which can simplify the evaluation and calculation process significantly for the user. However, the performance of the version used in this project, cba -verktyg -v41_tom_ , did not provide full satisfaction due to a number of malfunctions. As the tool is still under development, most of these faults will presumably be adjusted and fixed, which would significantly increase the usability and applicability. If the errors are not corrected, the purpose of using the tool is heavily reduced, as the calculations can be performed in a regular Excel program, using its builtin functions and formulas. This requires a certain level of experience in using Excel, but not to a great extent. However, it does require time. Learning to use the tool also requires a certain amount of time, but while reading the help texts provided with the tool, the user also learns about CBA as a method and about how the input data can be collected. If the user is not already well familiar with how a CBA for environmental measures is performed, this would either way be a necessary step. With or without the tool, the process of collecting data for the inputs is a time consuming and crucial part that needs to be performed with caution. In large and complex projects, it will require the involvement of several experts within different fields. If there is no data available from similar projects that have been previously performed, it will likely be a costly and time consuming process. It can be concluded that if the malfunctions of the tool are corrected, it would be suitable for authorities and hydroelectric companies to use it when prioritizing between different project proposals to find the most beneficial environmental improvements in future permit processes. Through the framework and the help texts that accompanies the tool, it can provide guidance that will simplify and accelerate the process of the CBA. If the usage of the tool can accelerate the process and provide the result to the decision-maker more quickly, the total cost of the evaluation can be reduced. This since in this context, time is money. 108
129 11 Recommendations and future work The optimal solution to evaluate the socio-economic benefit in this specific project would be to conduct a project-specific survey where the Swedish citizens could state how much they would be willing to pay for a significant increase of the wild salmonid population in Klarälven. In this thesis, this was not possible due to time constraints and resource limitations. A survey would significantly enhance the precision of the WTP input, which would provide are more reliable and accurate result of the CBA. Therefore, a project-specific survey of the Edsforsen trap-andtransport solution is recommended. A further recommendation is that additional population models and evaluations should be performed to obtain more specific data regarding the habitat size and current smolt survival, in order to allow for a more accurate calculation of the increase in smolt survival. Scientific studies of the habitat size and salmonid population require a certain expertise, wherefore it could not be included within the scope of this thesis. A more precise estimation of the smolt increase would consequently entail the possibility to determine a more exact monetary value of each smolt. The potential smolt increase would also be an important prerequisite for a reliable project-specific WTP survey. The cba -verktyg -v41_tom_ version of the CBA tool has a number of malfunctions and it is recommended that these are adjusted and corrected to make the tool convenient and userfriendly. 109
130 Bibliography Aarre Maehlum, M., The History of Hydroelectric Power. [online] Available at: [Accessed ]. Baltic Salmon Fund, Baltic Salmon Biology [online]. Available at: [Accessed ]. Beltao, S Progress in the study and management of river ice jams. Cold Regions Science and Technology 51: Available at: [Accessed ]. Berga, The Role of Hydropower in Climate Change Mitigation and Adaptation: A Review. [online] Available at: [Accessed ]. Beria, P., Maltese, I. & Mariotti, I., Multicriteria versus Cost Benefit Analysis: a comparative perspective in the assessment of sustainable mobility [e-journal] 4(3), pp Available at: [Accessed ]. Boulton, A. J., Hyporheic rehabilitation in rivers: restoring vertical connectivity. [pdf] Freshwater Biology 52: Available at: [Accessed ]. Bäckstrand, A., Biologisk återställning i Rolfsåns vattensystem: Lax. [online] Länsstyrelsen i Västra Götalands län. Available at: < [Accessed ]. Cada, G.F Shaken, not stirred: The recipe for a fish -friendly turbine. Resource Relation. [pdf] Conference: Waterpower 1997, Atlanta, Georgia. 10 p. Available at: [Accessed ]. Calles, O., Nyberg, L. & L. Greenberg Temporal and spatial variation in quality of hyporheic water in one unregulated and two regulated boreal r ivers. [pdf] River Research and Applications 23: Available at: [Accessed ]. Corporate Finance Institute, Internal Rate of Return (IRR) - A Guide for Financial Analysts. [online] Available at: [Accessed ]. Coutant, C.C. & R.R. Whitney Fish behavior in relation to passage through hydropower turbines: a review. [pdf] Transactions of the American Fisheries Society 129: Available at: [Accessed ]. 110
131 Department for Communities and Local Government, Multi -cr iteria analysis: a manual [pdf] London: Department for Communities and Local government, Crown copyright 2009, Available at: [Accessed ]. EcoSenseLE, [software] Available at: [Accessed ]. Energiforsk, Samhällsekonomisk lönsamhetsbedömning av miljöåtgärder i v attendrag (Rapport 2017:428). Stockholm: Energiforsk. Available at: [Accessed ]. Energikunskap, Vattenkraft. [online] Available at: [Accessed ]. Energimyndigheten, 2017, Elproduktionen var stabil och bjöd på få överraskningar. Available at: [Accessed ]. Eur-lex, Good -quality wate r in Europe (EU Water Directive). [online] Available at: [Accessed ]. European commission, n.d. WISE: Information om genomförandet av ramdirektivet för vatten. [online] Available at: %20SV.pdf [Accessed ]. European commission, Natura [online] Available at: [Accessed ]. ExternE, Models and Tools. [online] Models and Tools ExternE - External Costs of Energy. Available at: [Accessed ]. Fortum, 2017a. Trap - and transport även för nedströmsvandrande laxfisk i Klarälven föreslås i ett nyligen avslutat flerårigt for skningsprojekt. [online] Available at: [Accessed ]. Fortum, 2017b. Fortum och berörda fiskevårdsområdesföreningar i Österälven - Siljan har kommit överens. [press release] 12 June Available at: [Accessed ]. 111
132 Fortum, Vår Energiproduktion. [online] Available at: [Accessed ]. FRAM-KLIV, Exemplifiering Mörrumsån. [pdf] Available at: [Accessed ]. Företagarna, Tjäna tusentals kronor. [online] Available at: [Accessed ]. Greenberg, L., Nyqvist, D., Bergman, E. and Calles, O., Förbättrad nedströmspassage för vild laxfisk i Klarälven. Karlstad: Karlstads universitet. Gustafsson, P., Hedenskog, M. & Qvenild, T. (red.), Vänerlaxens fria gång: två länder, en älv. Karlstad: Länsstyrelsen Hanley, N. & Barbier, E.B., Pricing Nature: Cost -Benefit Analysis and Environmental Policy. Cheltenham: Edward Elgar, pp Havs- och Vattenmyndigheten (HaV), Strategi för åtgärder inom vattenkraft Available at: kontakt/publikationer/publikationer/ strategi-for-atgarder-inomvattenkraften.html [Accessed ].. [online] Havs- och vattenmyndigheten (HaV), 2016a. Vägledning för kraftigt modif ierat vatten - fastställande av kraftigt modifierat vatten i vattenförekomster med vattenkraft [pdf] Havs- och vattenmyndigheten. Available at: gledning-for-kraftigt-modifierat-vatten.pdf [Accessed ]. Havs- och vattenmyndigheten (HaV), 2016b. Bästa möjliga teknik? [online] ( ) Available at: [Accessed ]. Havs- och vattenmyndigheten (HaV), Varför är inte alla vattenförekomster med ett vattenkraftverk ett KMV? [online] Available at: lagar/vagledningar/vattenforvaltning/om-vattenforvaltning/kraftigt-modifierade-vatten/faqkraftigt-modifierade-vatten-kmv/ varfor-ar-inte-alla-vattenforekomster-medvattenkraftverk-ett-kmv.html [Accessed ]. Humborg C., Pastuszak, M., Aigars, J., Siegmund, H., Mörth, C.-M. & V. Ittekkot., Decreased silica land -sea fluxes through damming in the Baltic Sea catchment: significance of particle trapping and hydrological alterations. [online] Biogeochemistry 77: Available at: 5a96eda30fe [Accessed ]. 112
133 Håkansson, C., A new valuation question: analysis of an insights from interval open-ended data in contingent valuation. Environ Resource Econ (2008), [pdf] 39( ). Available at [Accessed ]. Håkansson, C., Costs and benefits of improving wild salmon passage in a regulated river. Journal of Environmental Planning and Management (2009),[e-journal] 52( ). Available at: [Accessed ]. Johansson, P.O., Cost -benefit analysis of environmental change. Cambridge: Cambridge University Press, pp Koch, F.H., Hydropower - the politics of water and energy: Introduction and overview. Energy Policy, [online] 30(14), pp Available at: [Accessed ]. Kriström, B. & Bergman, M. B., Samhällsekonomiska analyser av miljöprojekt: en vägledning. Stockholm: Naturvårdsverket. Available at: [Accessed ]. Lindholm, K., 2017a. Vattenkraft. [online] Available at: [Accessed ]. Lindholm, K., 2017b. Vattenkraftsproduktion. [online] Available at: [Accessed ]. Länsstyrelsen Värmland, Bevarandeplan för Natura området Klarälven, övre delen. Available at: natur/skyddad-natur/natura2000/bevarandeplaner/bevarandeplan-se Klaralvenovredelen.pdf [Accessed ]. Löfstedt, D., Konfliktrisk mellan Natura 2000 och vattenkraften. Second Opinion Available at: [Accessed ]., [online] Mateo J.R.S.C.,2012. The Renewable Energy Industry and the Need for a Multi-Criteria Analysis. Multi Criteria Analysis in the Renewable Energy Industry. Green Energy and Technology. [e-book] London: Springer. Available at: [Accessed ]. Miljöbalk (1998:808) Svensk författningssamling 1998:808. [online] Stockholm: Miljö- och Energidepartementet. Available at: [Accessed ]. 113
134 Nath, B. (red.), Environmental management in practice. Vol. 3, Managing the ecosystem. [New ed.] London: Routledge Naturvårdsverket, Sammanställd information om Ekosystemtjänster. [online] Available at: %C3%A4rdsarbetet/Milj%C3%B6ekonomi/ekosystem-tjanster.pdf [Accessed ]. Naturvårdsverket, Ekologisk kompensation. [online] Available at: [Accessed ]. Nilsson, C., Jansson, R. and Zinko, U., Long-Term Responses of River-Margin Vegetation to Water-Level Regulation. Science, [online] 276(5313), pp Available at: < [Accessed ]. Norconsult, Utredning fiskavledning Edsforsens kraftverk, Klarälven: Tekniska förutsättningar och konsekvensbed ömning av 4 olika utförandealternativ. Norconsult Norconsult, Fortsatt utredning av fiskavledning vid Edsforsens kraftverk: Tekniska förutsättningar och konsekvensbedömning av 2 nya utförande alternativ. Norconsult Norrgård, J.R., Greenberg, L.A., Piccolo, J.J., Schmitz, M. and Bergman, E., Multiplicative loss of landlocked Atlantic Salmon Salmo salar L. smolts during downstream migration through multiple dams. River Research and Applications, [online] 29(10), pp Abstract only. Available at: [Accessed ]. Ny Teknik, Hälsofarlig kolkraft kostar danskar livet. Available at: #conversion [Accessed ]. Näslund, I., Kling, J. and Bergengren, J., Vattenkraftens påverkan på akvatiska ekosystem en litteratursammanställning. Göteborg: Havs- och vattenmyndigheten. (Havs- och vattenmyndighetens rapport 2013:10). Available at: ort-hav vattenkraftens-paverkan.pdf [Accessed ]. OECD, Cost -Benefit Analysis and the Environmen t: Recent Developments. Paris: OECD Publishing. Piccolo, J.J., Norrgård, J.R., Greenberg, L.A., Schmitz, M. and Bergman, E., Conservation of endemic landlocked salmonids in regulated rivers: a case -study from lake V änern, Sweden. Fish and Fisheries. [online] 13(4), pp Abstract only. Available at: [Accessed ]. Petts, G.E., Impounded Rivers. Chichester, UK. John Wiley & Sons Ltd Publishers. 114
135 Poff, N.L., Allan, J.D., Bain, M.B., Karr, J.R., Prestegaard, K.L., Richter, B.D., Sparks, R.E. and Stromberg, J.C., The Natural Flow Regime - A paradigm for river conservation and restoration. BioScience, [online] 47(11). Available at: < adigm.pdf> [Accessed 26 Feb. 2018]. Regeringen, 2016, Ramöverenskommelse mellan Socialdemokraterna, Moderaterna, Miljöpartiet de gröna, Centerpartiet och Kristdemokraterna. [pdf] Available at: gioverenskommelse pdf ) [Accessed ]. Regeringskansliet, Helhetssyn och moderna miljövillkor för vattenkraften - första steget i genomfö randet av energiöverenskommelse gällande vattenkraftens miljöpåverkan. [online] Available at: [Accessed ]. Regionfakta, Befolkningsstruktur [online] Available at: [Accessed ]. Roosen J., Cost -Benefit Analysis. In: Klu ppelberg, C., Straub, D. & Welpe, I.M. (eds), Risk - a multidisciplinary introduction, Cham: Springer, pp Available at: [Accessed ]. Rosén, L., Kostnads -nyttoanalys som verktyg för prioritering av efterbehandlingsinsatser: metodutveckling och exempel på tillämpning. [pdf] Stockholm: Naturvårdsverket. Available at: [Accessed ]. SIKA, Den samhällsekonomiska kalkylen - En introduktion för den nyfikne. Stockholm: Statens institut för kommunikationsanalys. Available at: samhallsekonomiska%20analyser/den%20samh%c3%a4llsekonomiska%20kalkylen.pdf [Accessed ]. Statistiska centralbyrån (SCB), 2018a. Befolkningsstatistik [online] Available at: [Accessed ]. Statistiska centralbyrån (SCB), 2018b. Befolkning efter ålder och kön. År [online] Available at: BE BE0101 BE0101A/Befolkni ngr1860/?rxid=f45f90b ba25-9b43e6c6e299 [Accessed ]. Statistiska centralbyrån (SCB), 2018c. Folkmängd per distrikt, landskap, landsdel eller riket efter kön. År [online] Available at: BE BE0101 BE0101A/Folkma ngddistrikt/?rxid=f45f90b ba25-9b43e6c6e299 [Accessed ]. 115
136 Statistiska centralbyrån (SCB), 2018d. Prisomräknaren [online] Available at: [Accessed ]. Statistiska centralbyrån (SCB), 2018e. Nettoinkomst, medelinkomst för boende i Sverige hela året, tkr efter region, kön, ålder och år [online] Available at: HE HE0110 HE0110A/NetInk0 2/table/tableViewLayout1/?rxid=43d2c393-fc5c-45d2-86e1-63aa73b18564 [Accessed ]. Svenskt vattenbruk, Kompensationsodling. [online] Available at: sationsodling.4.103f7b5a14cf721162be32b3.html [Accessed ]. Sveriges Riksbank, Inflationsmålet. [online] ( ) Available at: [Accessed ]. Sweco, Vattenregleringsteknik för en mer ekologiskt anpassad vattenreglering. [pdf] Havsoch vattenmyndigheten. Available at: pport-sweco-miljoanpassad-vattenregleringsteknik.pdf [Accessed ]. Söderqvist, T., Diskontering i samhällsekonomiska analyser av klimatåtgärder [pdf] Naturvårdsverket. Available at: [Accessed ]. Trafikverket, Samhällsekonomiska principer och kalkylvärden för transportsektorn: ASEK 6.0. [pdf] Available at: enerella_principer_o_varden_a52.pdf [Accessed ]. Trussart, S., Messier, D., Roquet, V. and Aki, S., Hydropower projects: a review of most effective mitigation measures. Fuel and Energy Abstracts, [online] 30(14), pp Available at: [Accessed ]. U.S. Department of Energy, Types of hydropower Plants, [online] Available at: [Accessed ]. Vattenkraft.info, Klarälven. [online] Available at: [Accessed ]. Vattenkraftens miljöfond, Vattenkraftens miljöfond [online] Available at: [Accessed ]. Vatteninformationssystem Sverige (VISS), Klarälven ns Acksjöälven. [online] Available at: < [Accessed ]. 116
137 Williams, Andrew, Run -of -the -River Hydropower Goes With The Flow. [online] Renewable Energy World. Available at: 1/hydropower/run-of-the-river-hydropower-goes-with-the-flow.html [Accessed ]. Wisconsin Valley Improvement Company (WVIC), How Hydropower Works. [online] Available at: [Accessed: ]. 117

138 Appendix A Scenario 1-2 i
139 ii
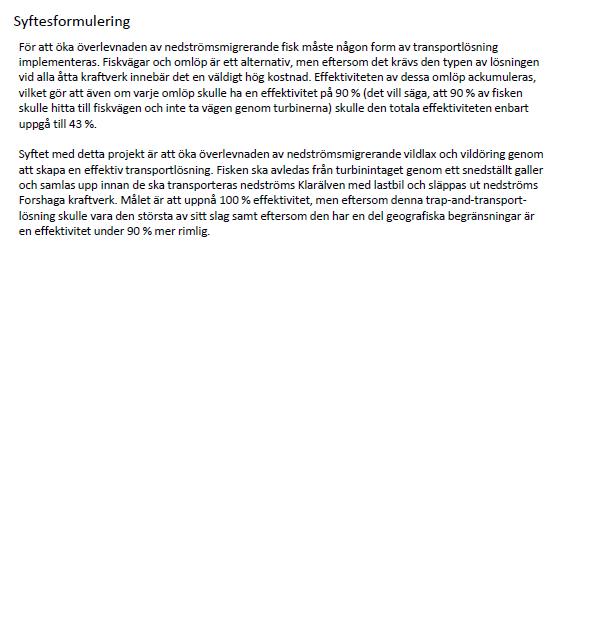
140 iii
141 iv
142 v
143 vi
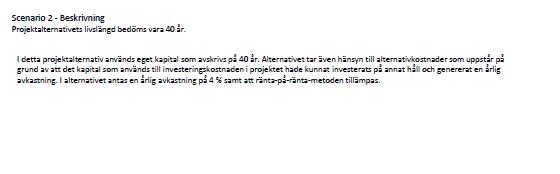
144 vii
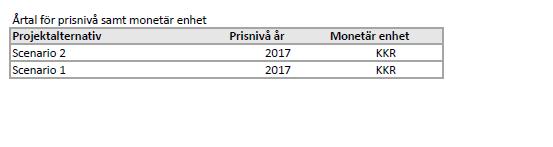
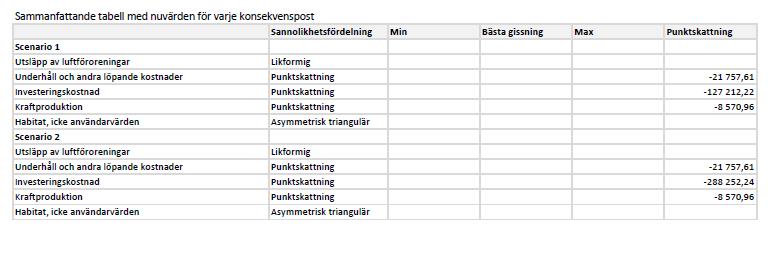
145 viii
146 ix
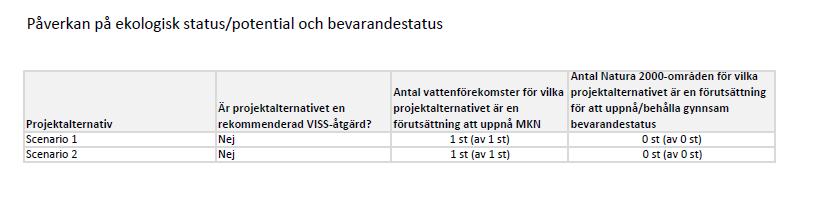
147 x
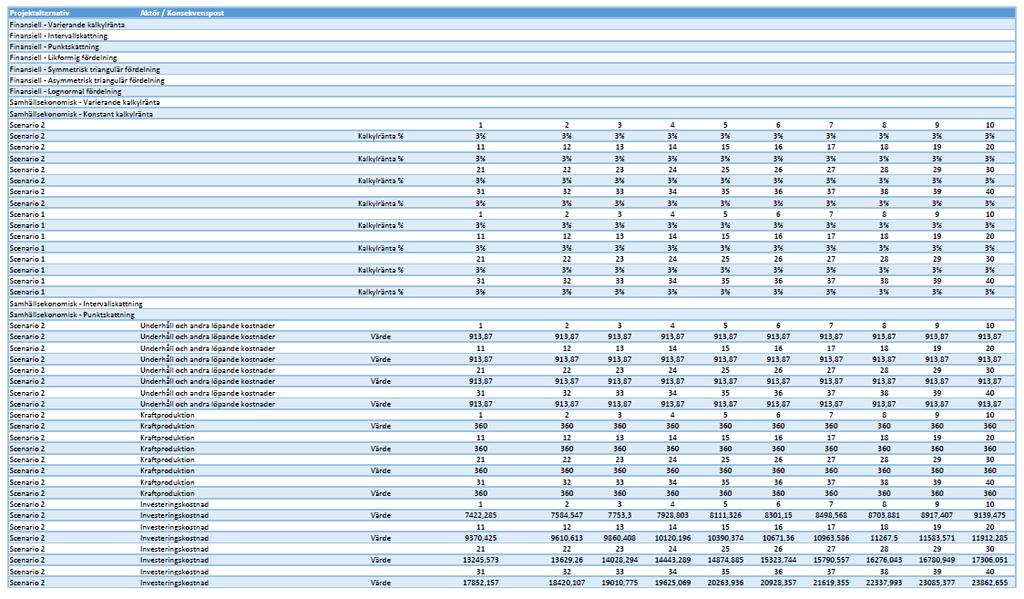
148 xi
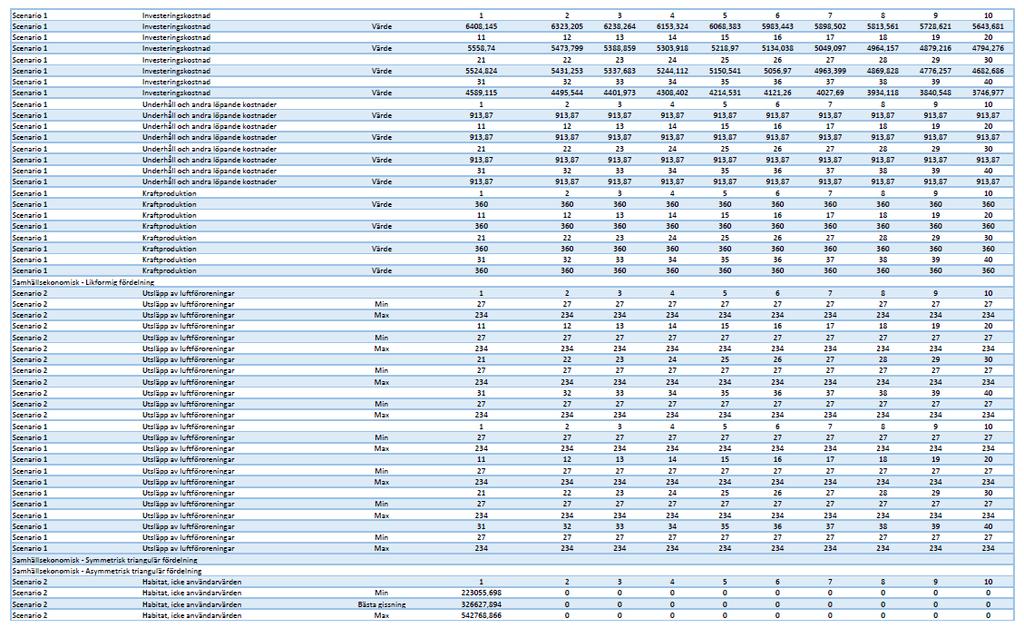
149 xii
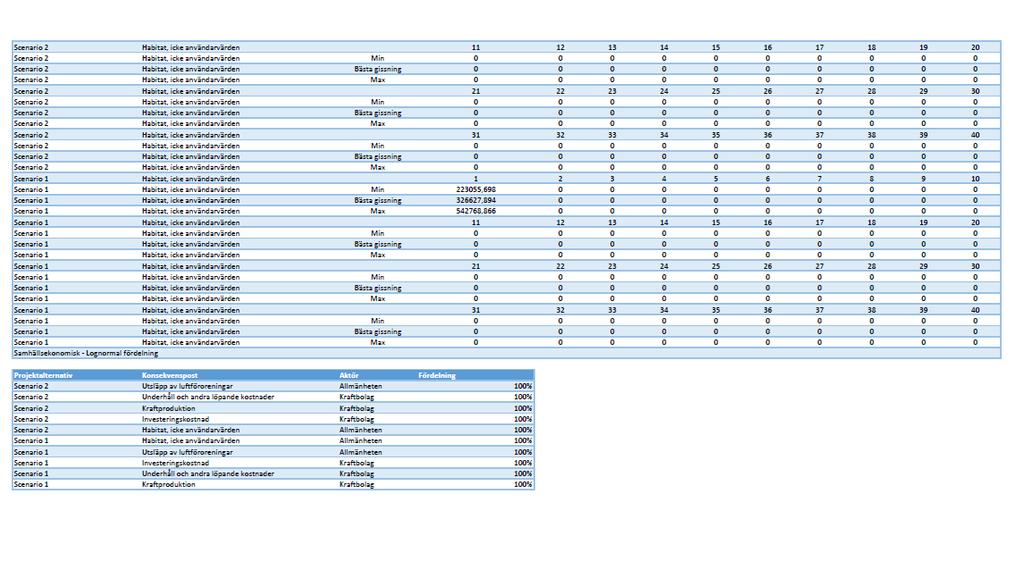
150 xiii
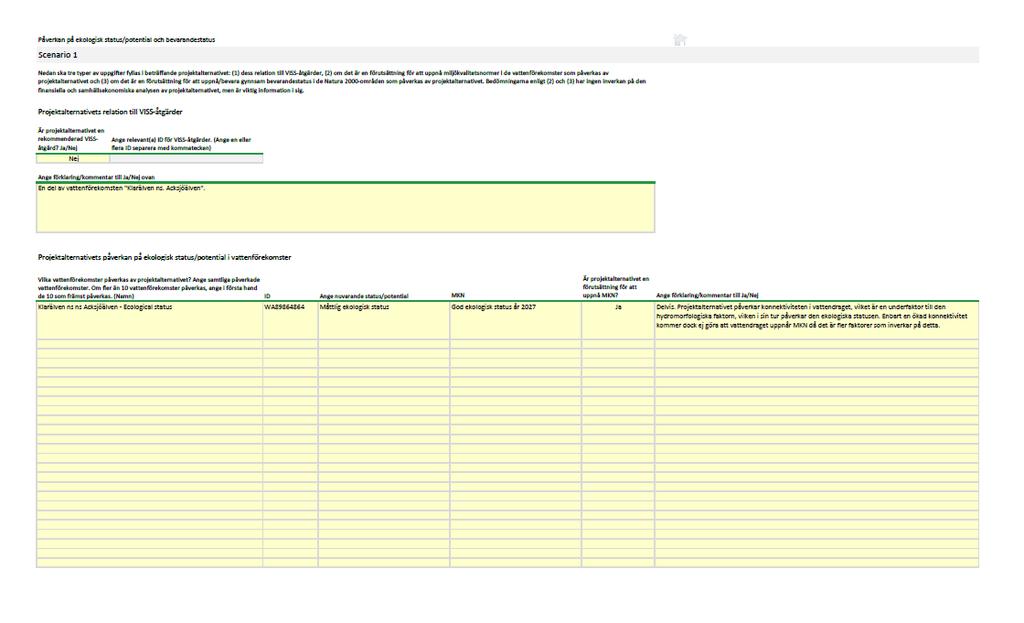
151 xiv

152 xv

153 xvi

154 xvii

155 Appendix B Scenario 3-13 xviii
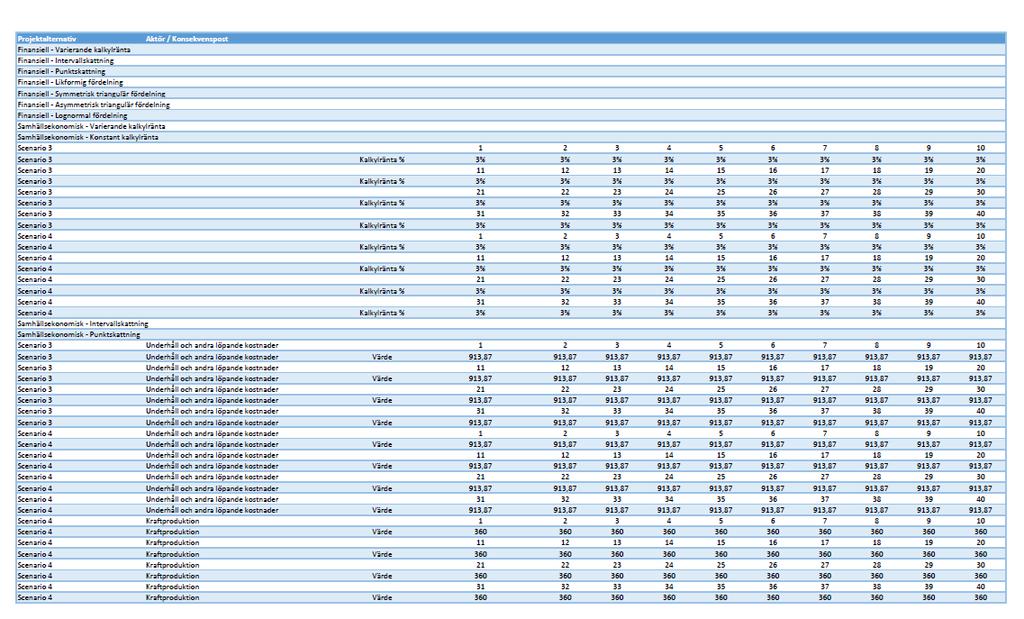
156 xix
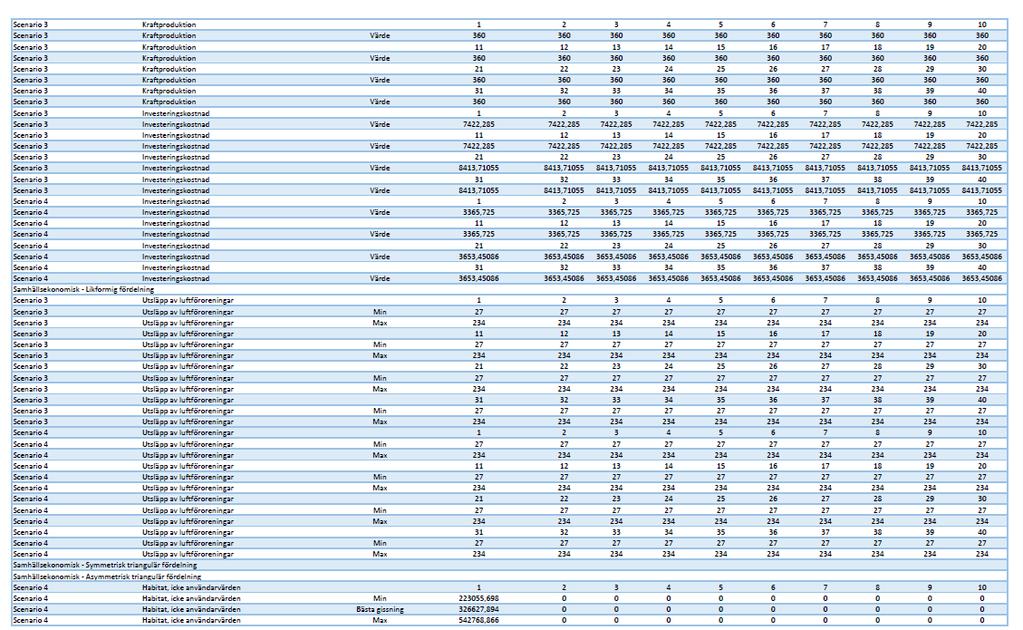
157 xx
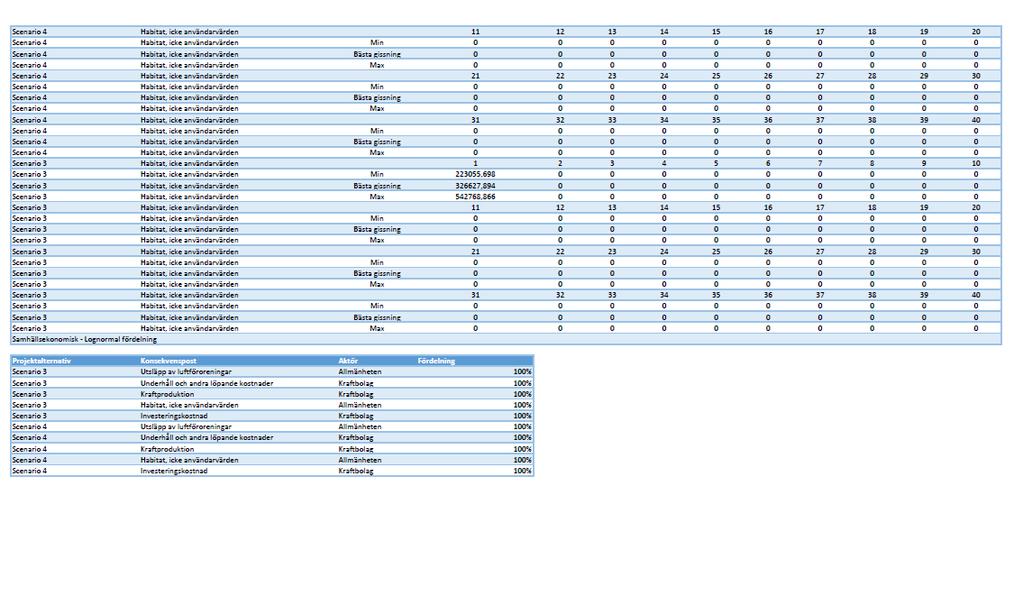
158 xxi
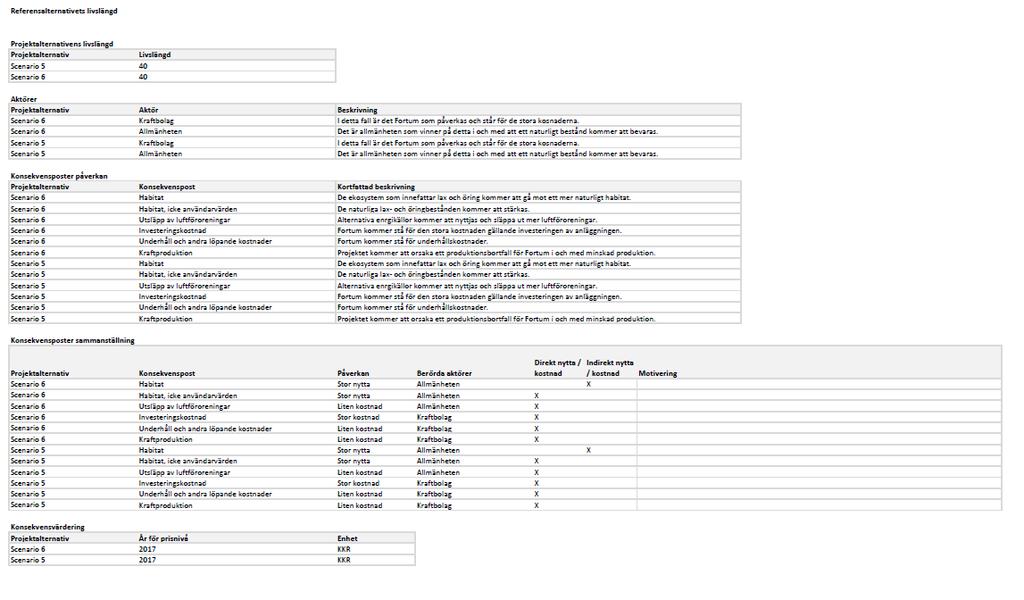
159 xxii
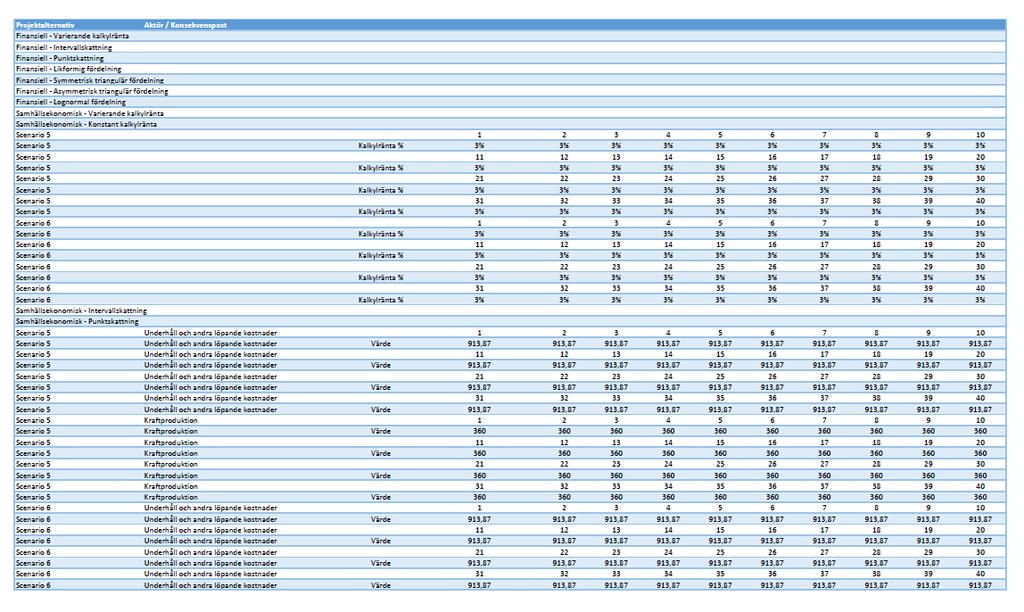
160 xxiii
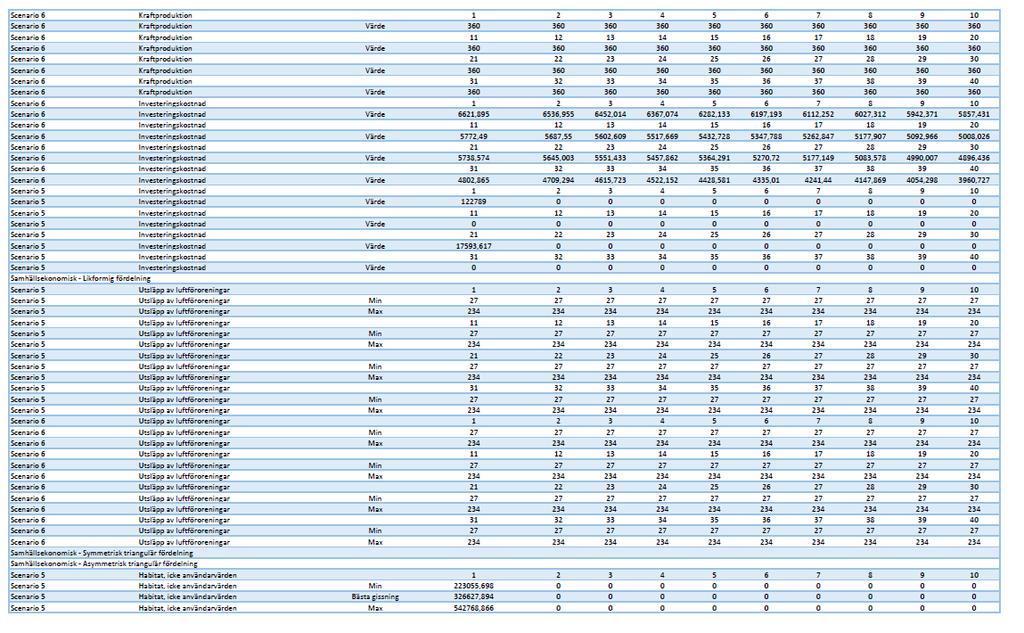
161 xxiv
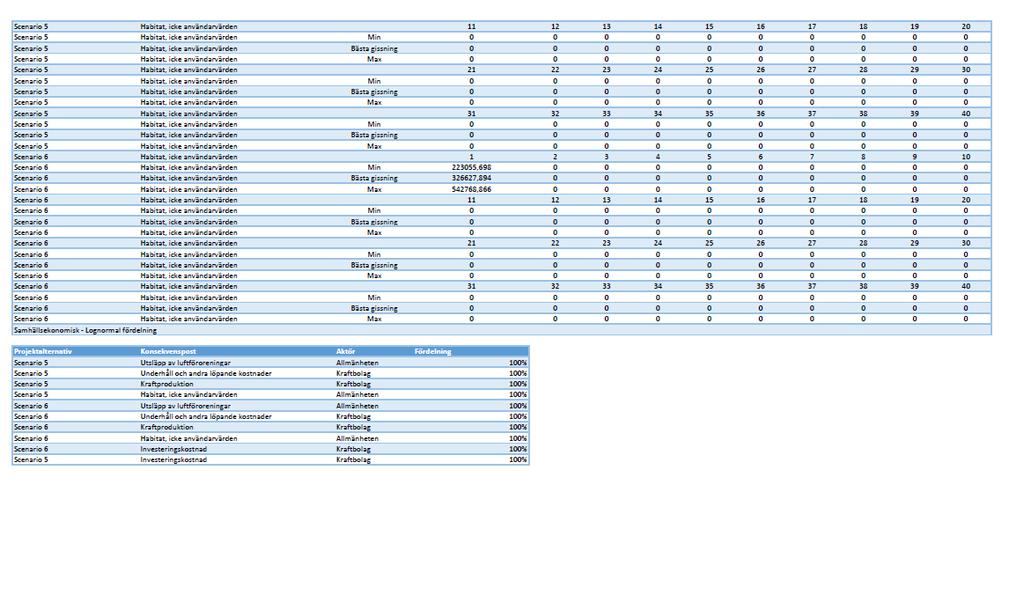
162 xxv
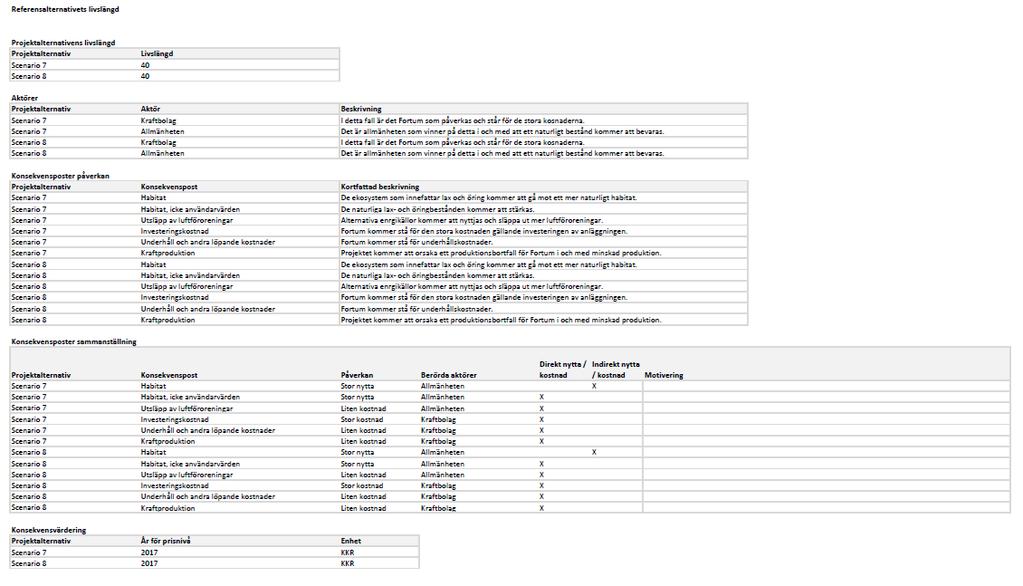
163 xxvi
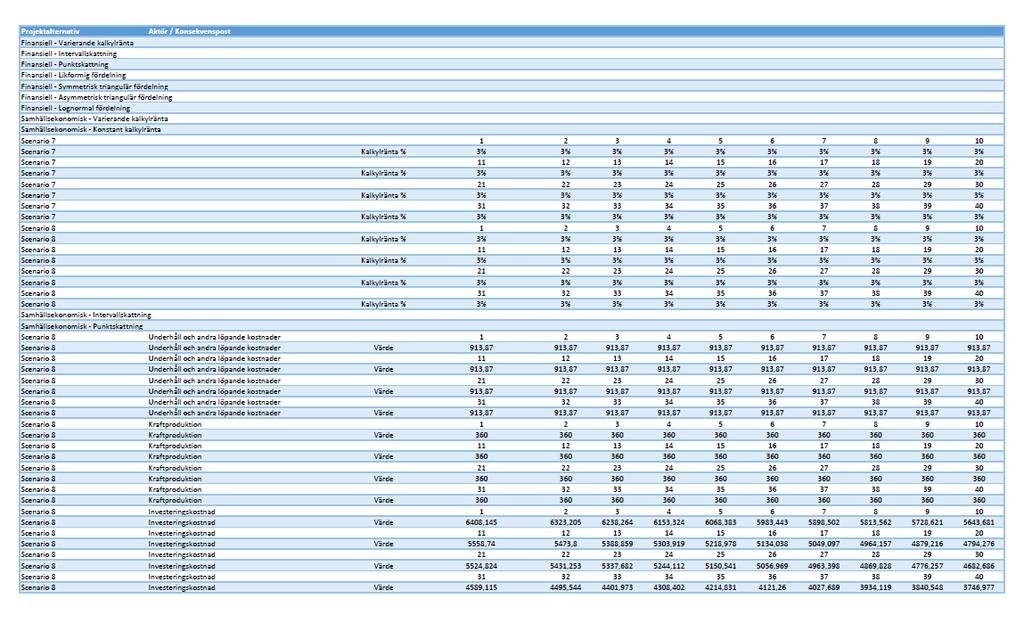
164 xxvii
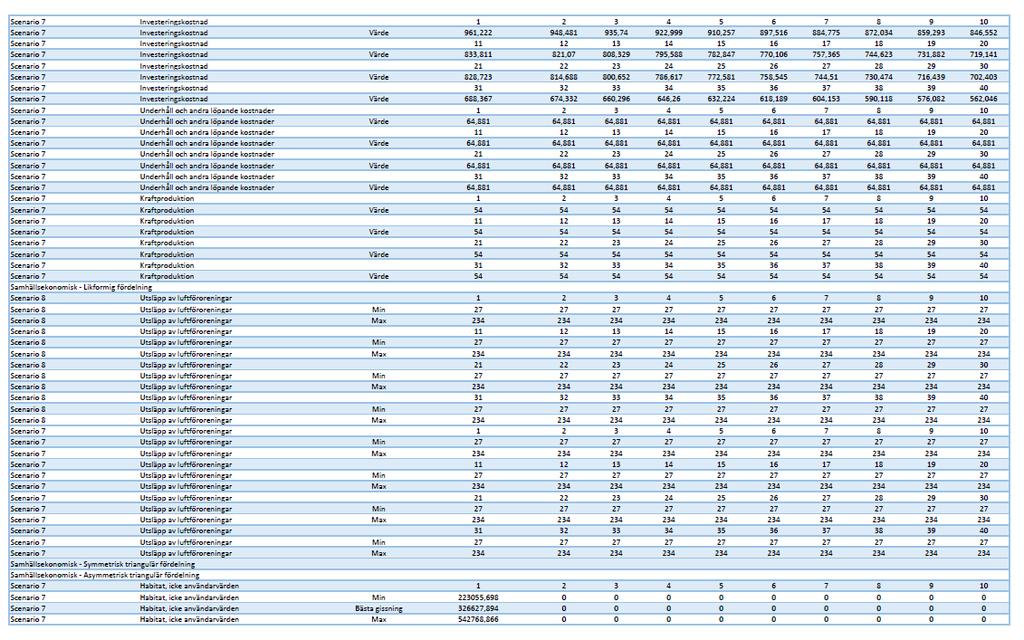
165 xxviii
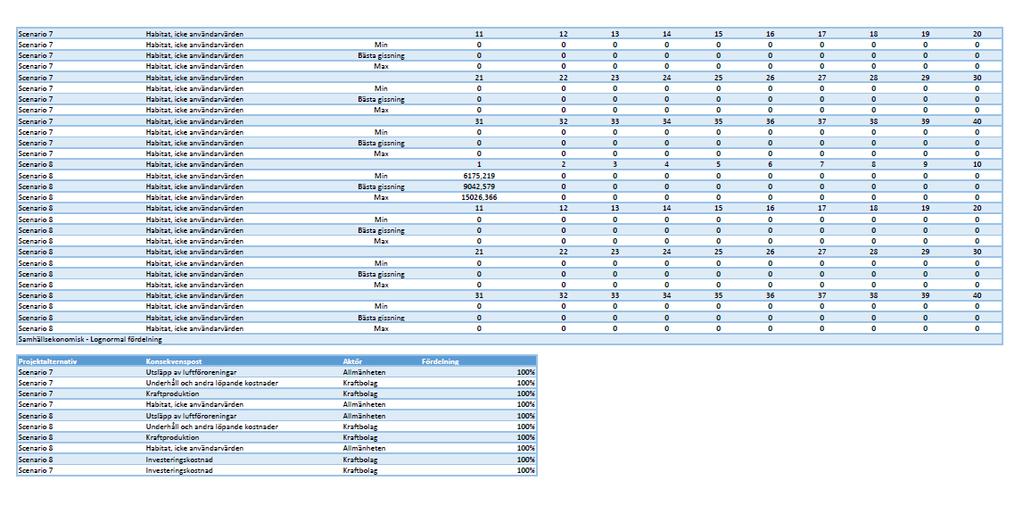
166 xxix
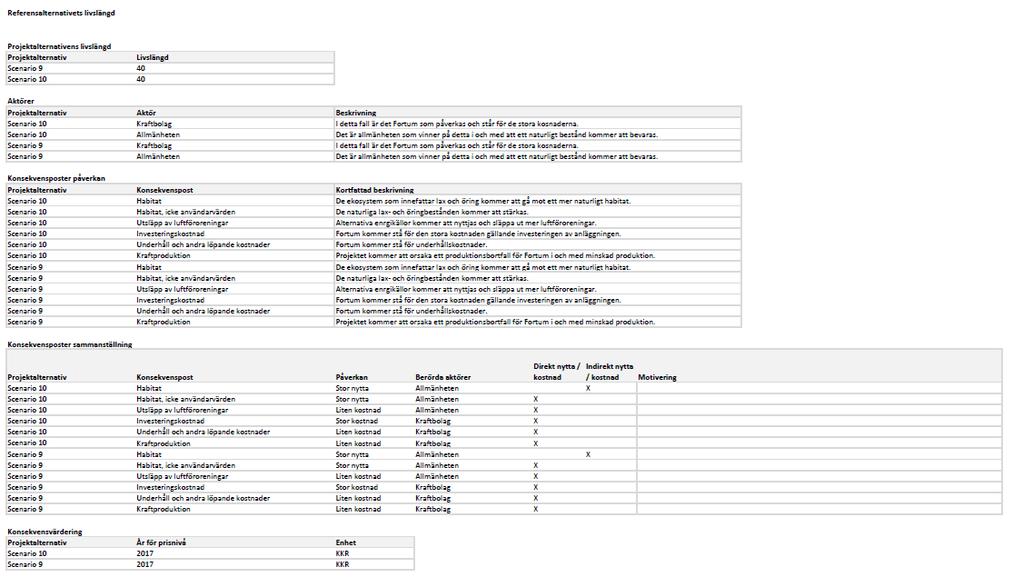
167 xxx
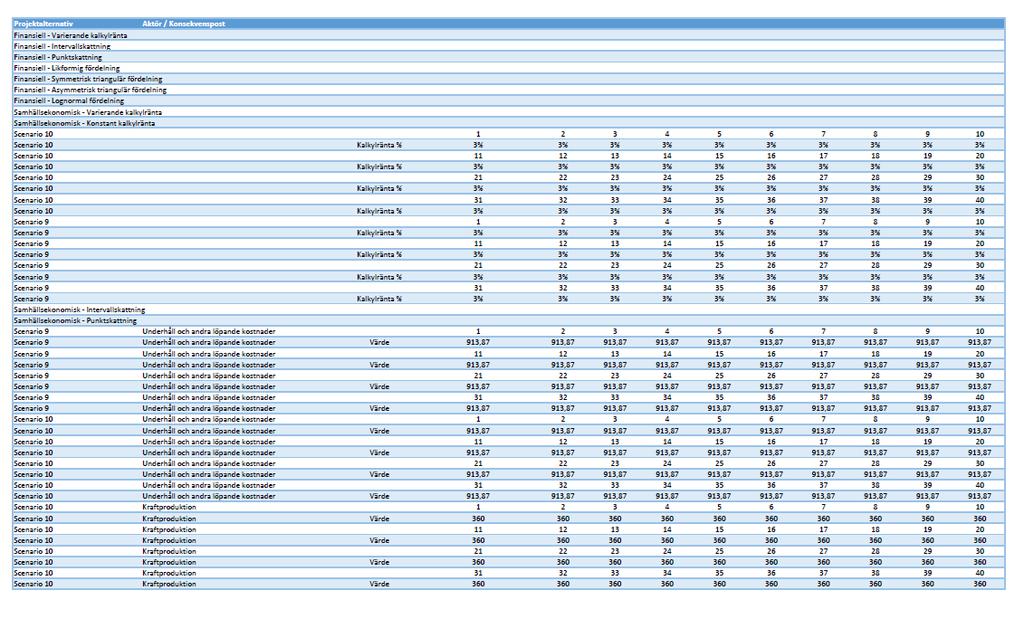
168 xxxi
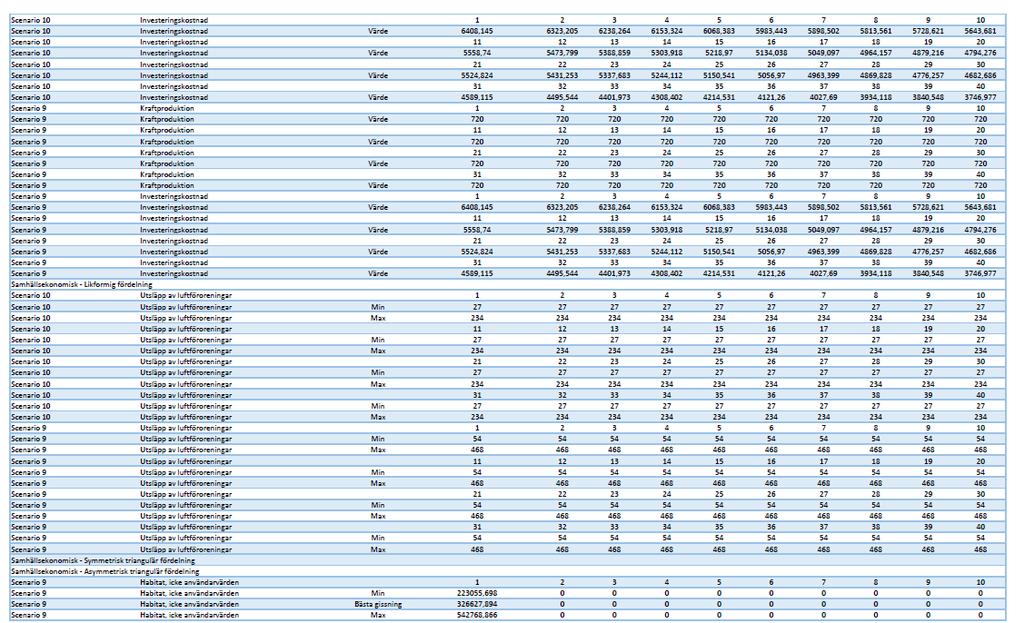
169 xxxii
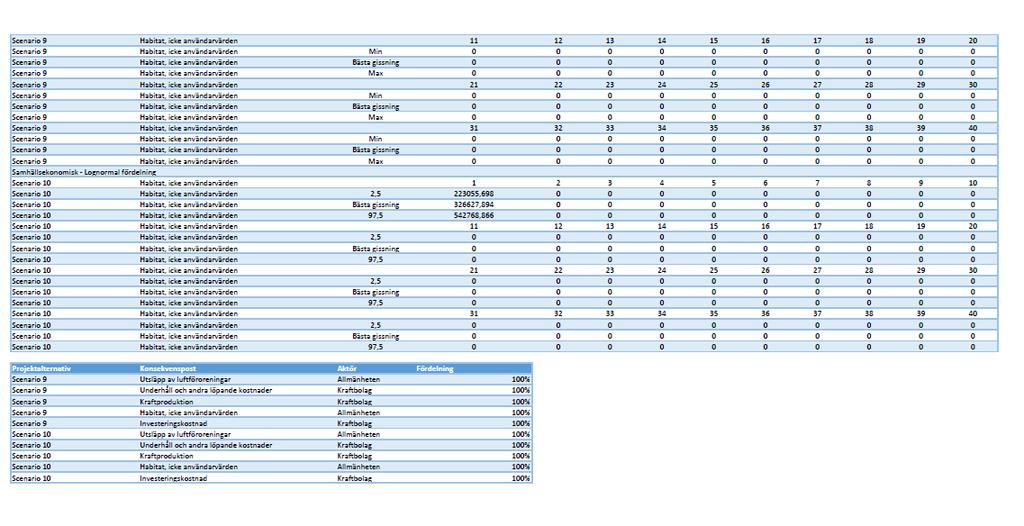
170 xxxiii
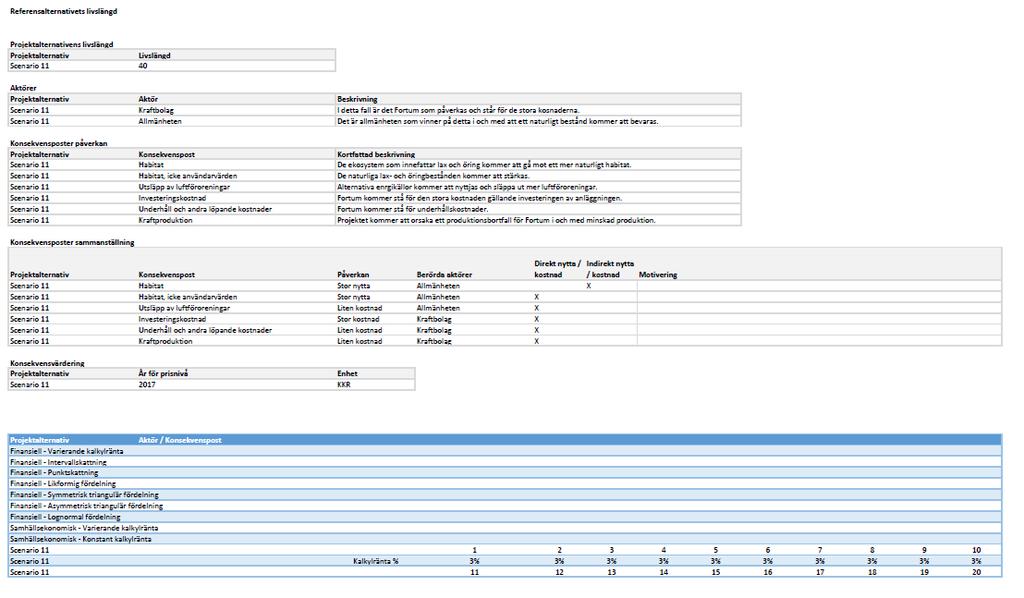
171 xxxiv
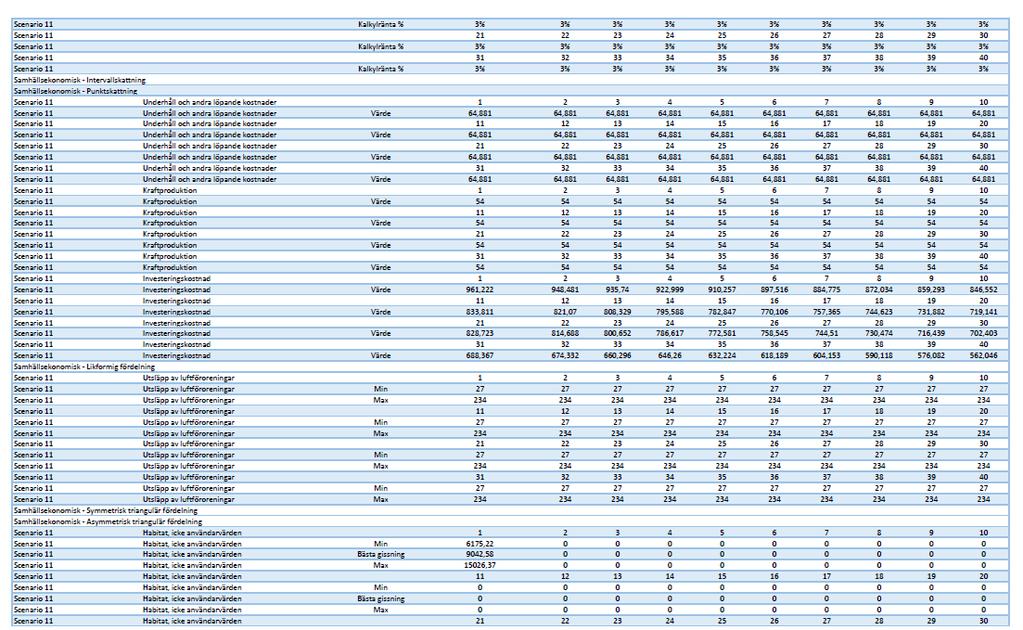
172 xxxv
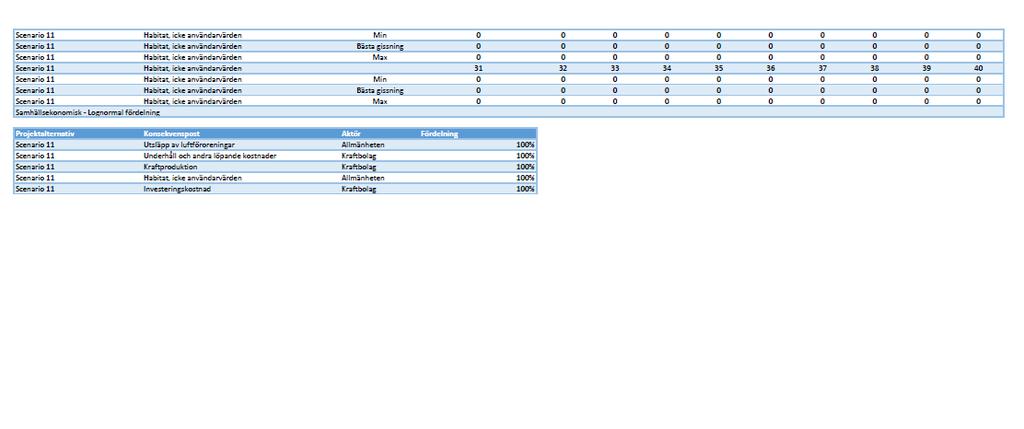
173 xxxvi
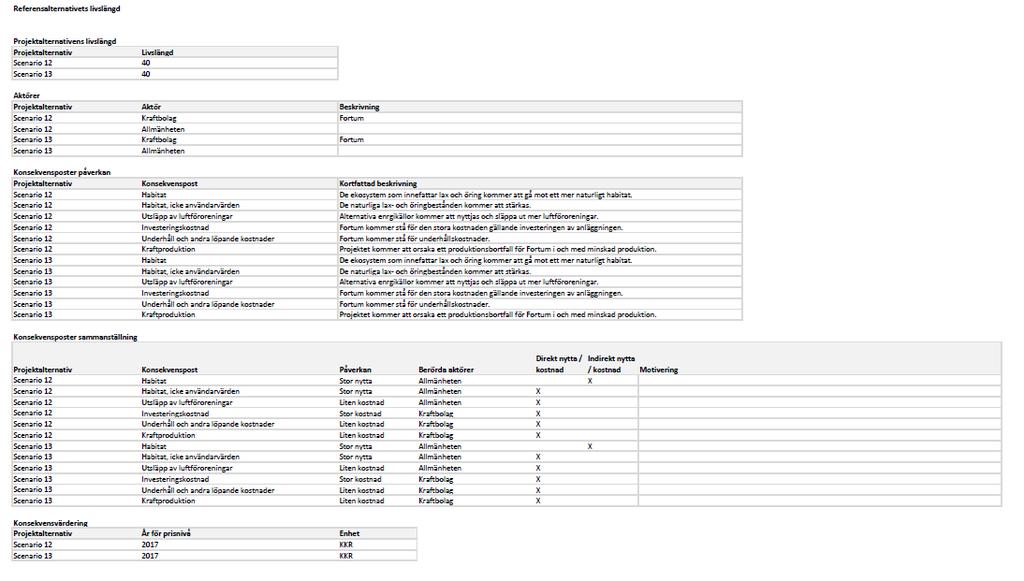
174 xxxvii
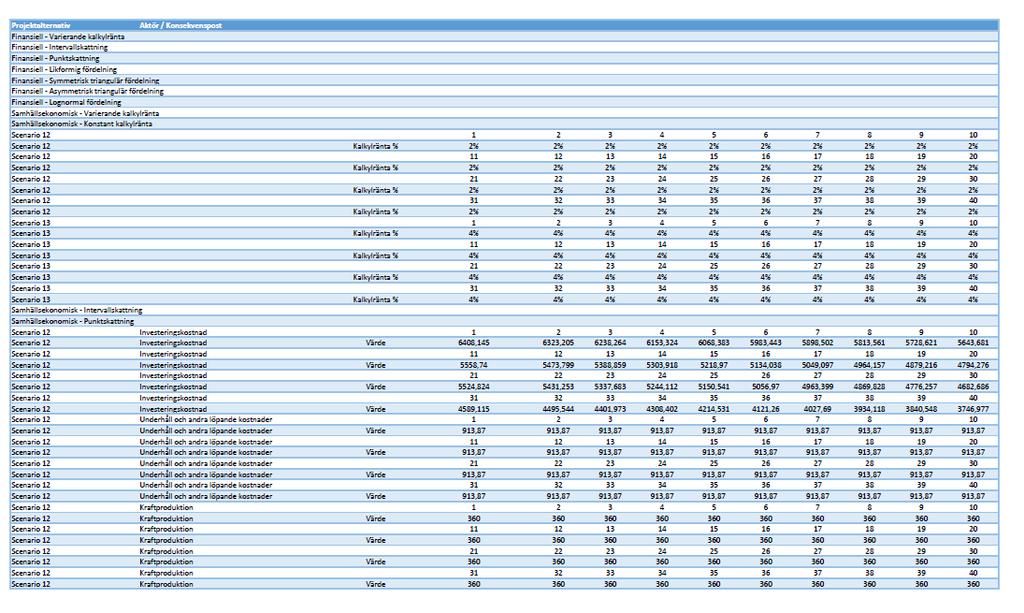
175 xxxviii
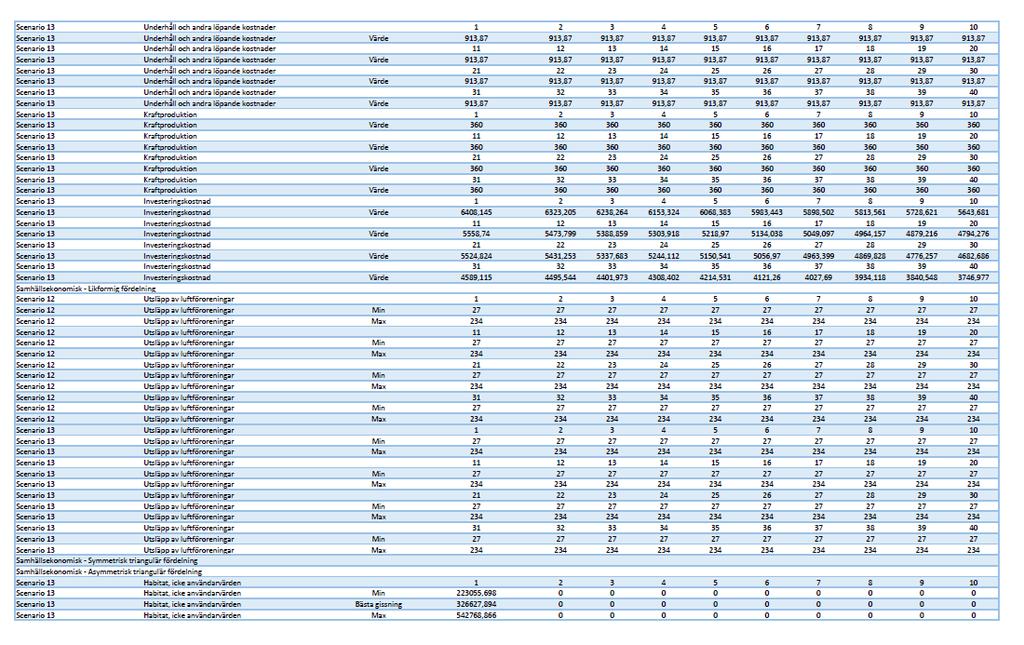
176 xxxix
177 xl

178 Appendix C Excel input data for scenario 1,2,3,6 and 7 Scenario 1 xli
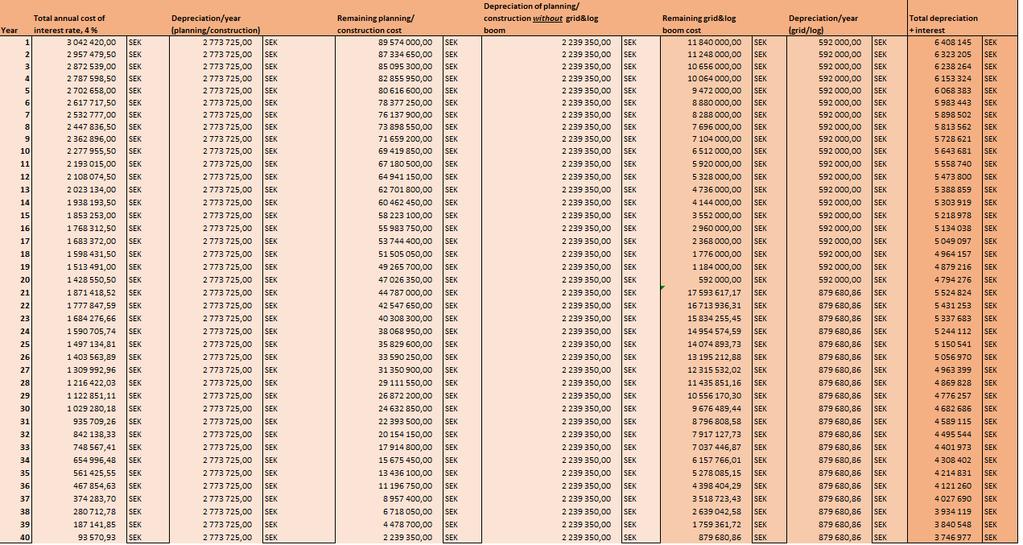
179 xlii

180 Scenario 2 xliii
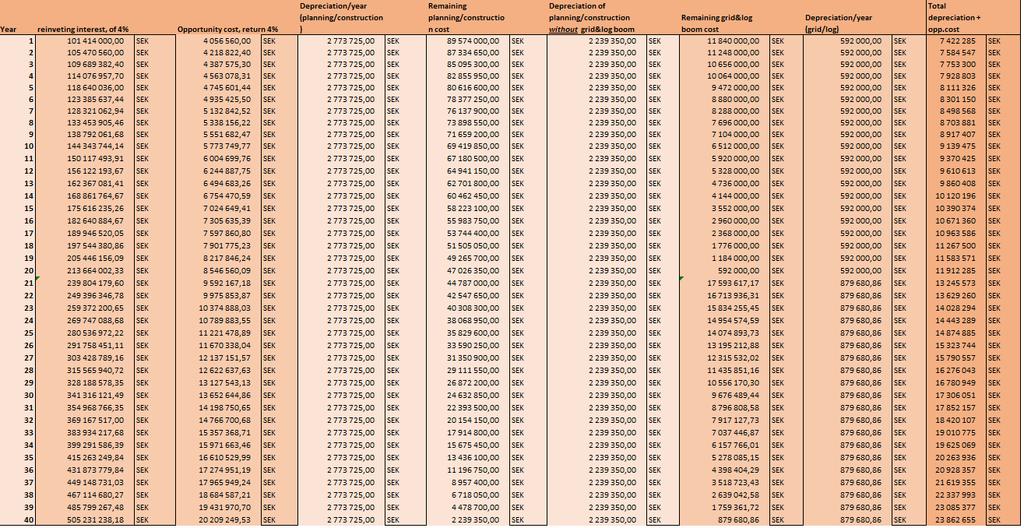
181 xliv
182 Scenario 3 xlv
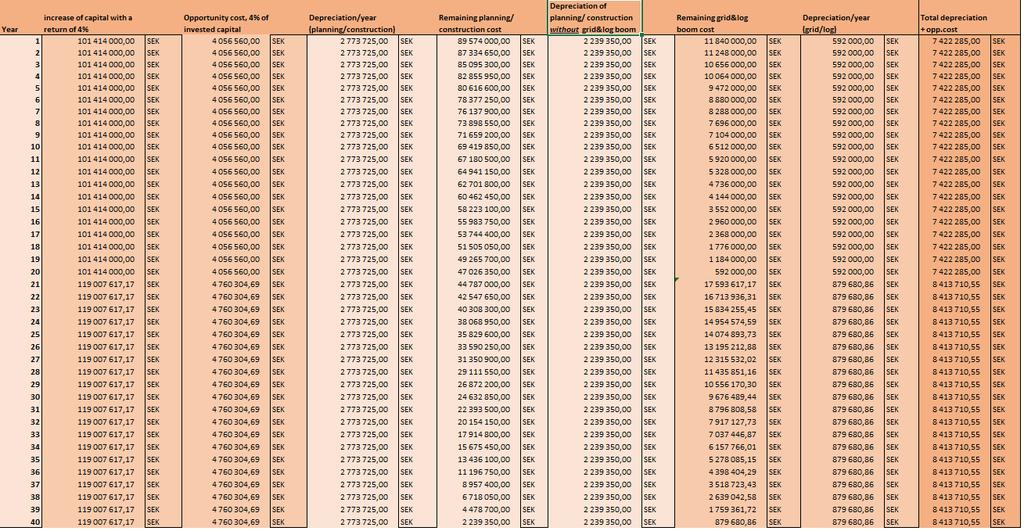
183 xlvi

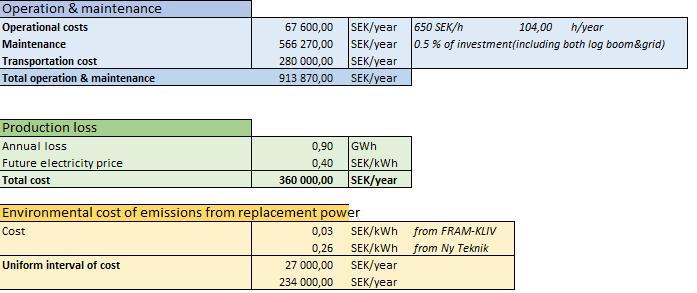
184 Scenario 4 xlvii
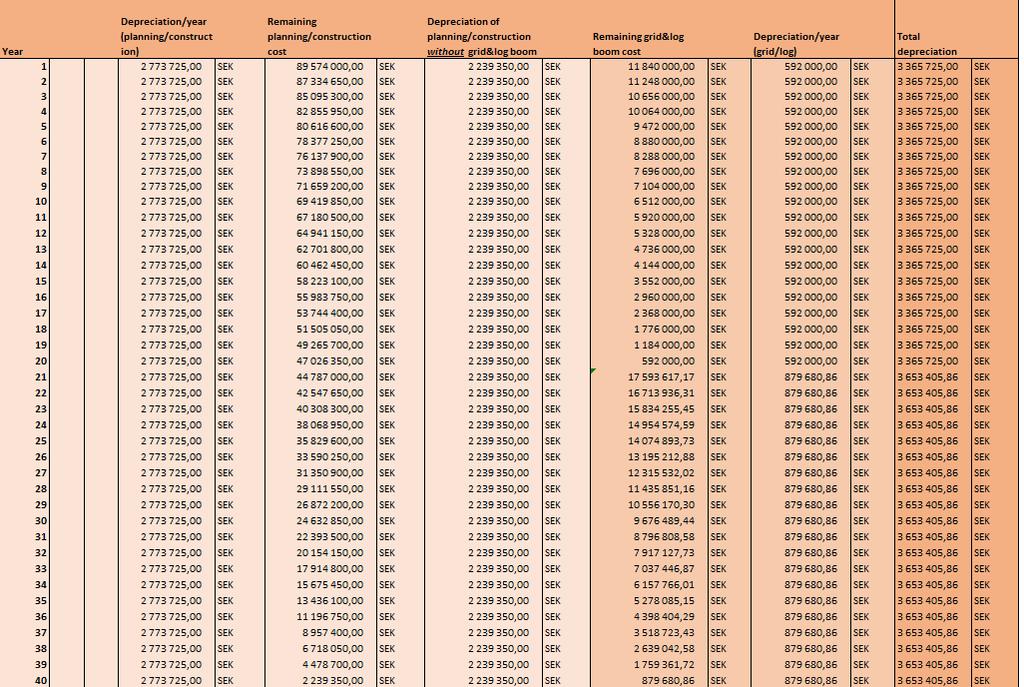
185 xlviii

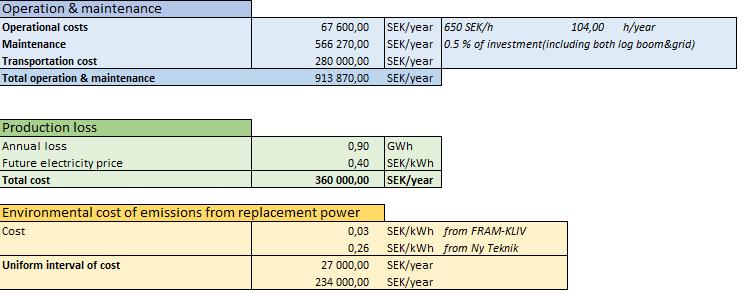
186 Scenario 6 xlix
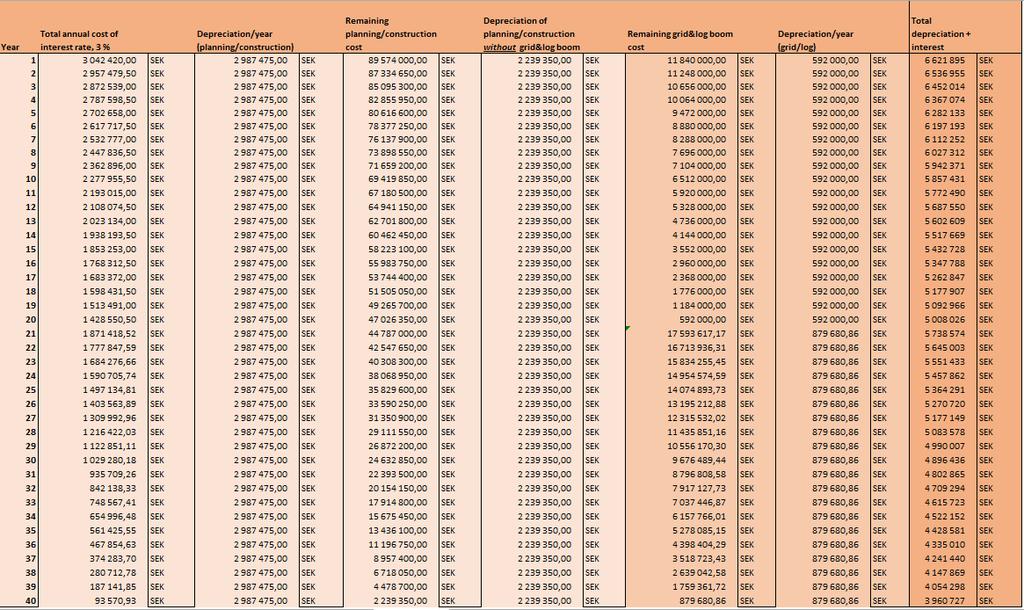
187 l

188 Scenario 7 li
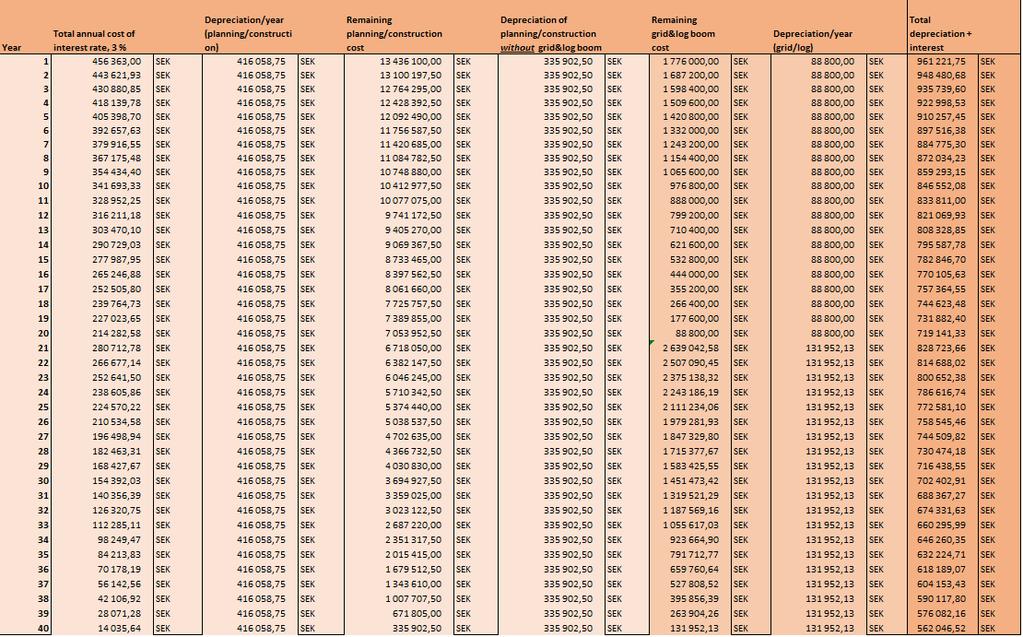
189 lii
The Algerian Law of Association. Hotel Rivoli Casablanca October 22-23, 2009
 The Algerian Law of Association Hotel Rivoli Casablanca October 22-23, 2009 Introduction WHY the Associations? NGO s are indispensable to the very survival of societal progress Local, National or International
Stiftelsen Allmänna Barnhuset KARLSTADS UNIVERSITET
 Stiftelsen Allmänna Barnhuset KARLSTADS UNIVERSITET National Swedish parental studies using the same methodology have been performed in 1980, 2000, 2006 and 2011 (current study). In 1980 and 2000 the studies
Klimatpåverkan och de stora osäkerheterna - I Pathways bör CO2-reduktion/mål hanteras inom ett osäkerhetsintervall
 Klimatpåverkan och de stora osäkerheterna - I Pathways bör CO2-reduktion/mål hanteras inom ett osäkerhetsintervall Vi måste förstå att: Vårt klimat är ett mycket komplext system Många (av människan påverkade)
Vattenkraften har en centrala roll i kraftsystemet
 Elforsk 14 juni 2013 Vattenkraften har en centrala roll i kraftsystemet Vattenkraft används för att reglera ut förbrukningsvariationer. 1-7 januari 2011. Reglering med vattenkraft är billig vilket ger
The Municipality of Ystad
 The Municipality of Ystad Coastal management in a local perspective TLC The Living Coast - Project seminar 26-28 nov Mona Ohlsson Project manager Climate and Environment The Municipality of Ystad Area:
Grass to biogas turns arable land to carbon sink LOVISA BJÖRNSSON
 Grass to biogas turns arable land to carbon sink LOVISA BJÖRNSSON Project funding and reporting, Thomas Prade & Mikael Lantz (2016) Grass for biogas - Arable land as carbon sink. Report 2016:280. Energiforsk,
Syns du, finns du? Examensarbete 15 hp kandidatnivå Medie- och kommunikationsvetenskap
 Examensarbete 15 hp kandidatnivå Medie- och kommunikationsvetenskap Syns du, finns du? - En studie över användningen av SEO, PPC och sociala medier som strategiska kommunikationsverktyg i svenska företag
Water management in Sweden
 Water management in Sweden Niclas Bäckman, Principal Scientist and Coordinator Environmental monitoring and Analysis, County Administrative Board of Östergötland Different levels of water management in
Botnia-Atlantica Information Meeting
 Botnia-Atlantica 2014-2020 Information Meeting Norway: Nordland Sweden: Västerbotten Västernorrland Nordanstigs kommun Finland: Mellersta Österbotten Österbotten Södra Österbotten Monitoring Committee
Swedish adaptation of ISO TC 211 Quality principles. Erik Stenborg
 Swedish adaptation of ISO TC 211 Quality principles The subject How to use international standards Linguistic differences Cultural differences Historical differences Conditions ISO 19100 series will become
Thesis work at McNeil AB Evaluation/remediation of psychosocial risks and hazards.
 Evaluation/remediation of psychosocial risks and hazards. Help us to create the path forward for managing psychosocial risks in the work environment by looking into different tools/support/thesis and benchmarking
Signatursida följer/signature page follows
 Styrelsens i Flexenclosure AB (publ) redogörelse enligt 13 kap. 6 och 14 kap. 8 aktiebolagslagen över förslaget till beslut om ökning av aktiekapitalet genom emission av aktier och emission av teckningsoptioner
CHANGE WITH THE BRAIN IN MIND. Frukostseminarium 11 oktober 2018
 CHANGE WITH THE BRAIN IN MIND Frukostseminarium 11 oktober 2018 EGNA FÖRÄNDRINGAR ü Fundera på ett par förändringar du drivit eller varit del av ü De som gått bra och det som gått dåligt. Vi pratar om
Examensarbete Introduk)on - Slutsatser Anne Håkansson annehak@kth.se Studierektor Examensarbeten ICT-skolan, KTH
on - Slutsatser Anne Håkansson annehak@kth.se Studierektor Examensarbeten ICT-skolan, KTH") Examensarbete Introduk)on - Slutsatser Anne Håkansson annehak@kth.se Studierektor Examensarbeten ICT-skolan, KTH 2016 Anne Håkansson All rights reserved. Svårt Harmonisera -> Introduktion, delar: Fråga/
Examensarbete Introduk)on - Slutsatser Anne Håkansson annehak@kth.se Studierektor Examensarbeten ICT-skolan, KTH 2016 Anne Håkansson All rights reserved. Svårt Harmonisera -> Introduktion, delar: Fråga/
Swedish framework for qualification www.seqf.se
 Swedish framework for qualification www.seqf.se Swedish engineering companies Qualification project leader Proposal - a model to include the qualifications outside of the public education system to the
Indikatorer för utvecklingen av de Europeiska energisystemen
 Indikatorer för utvecklingen av de Europeiska energisystemen Filip Johnsson NEPP:s vinterkonferens 2018 Stockholm, 2018 Division of Energy Technology Department of Space, Earth and Environment Chalmers
The road to Recovery in a difficult Environment
 Presentation 2010-09-30 The road to Recovery in a difficult Environment - a presentation at the Workability International Conference Social Enterprises Leading Recovery in Local and Global Markets in Dublin
Information technology Open Document Format for Office Applications (OpenDocument) v1.0 (ISO/IEC 26300:2006, IDT) SWEDISH STANDARDS INSTITUTE
 v1.0 (ISO/IEC 26300:2006, IDT) SWEDISH STANDARDS INSTITUTE") SVENSK STANDARD SS-ISO/IEC 26300:2008 Fastställd/Approved: 2008-06-17 Publicerad/Published: 2008-08-04 Utgåva/Edition: 1 Språk/Language: engelska/english ICS: 35.240.30 Information technology Open Document
SVENSK STANDARD SS-ISO/IEC 26300:2008 Fastställd/Approved: 2008-06-17 Publicerad/Published: 2008-08-04 Utgåva/Edition: 1 Språk/Language: engelska/english ICS: 35.240.30 Information technology Open Document
FORSKNINGSKOMMUNIKATION OCH PUBLICERINGS- MÖNSTER INOM UTBILDNINGSVETENSKAP
 FORSKNINGSKOMMUNIKATION OCH PUBLICERINGS- MÖNSTER INOM UTBILDNINGSVETENSKAP En studie av svensk utbildningsvetenskaplig forskning vid tre lärosäten VETENSKAPSRÅDETS RAPPORTSERIE 10:2010 Forskningskommunikation
COPENHAGEN Environmentally Committed Accountants
 THERE ARE SO MANY REASONS FOR WORKING WITH THE ENVIRONMENT! It s obviously important that all industries do what they can to contribute to environmental efforts. The MER project provides us with a unique
Kundfokus Kunden och kundens behov är centrala i alla våra projekt
 D-Miljö AB bidrar till en renare miljö genom projekt där vi hjälper våra kunder att undersöka och sanera förorenad mark och förorenat grundvatten. Vi bistår dig som kund från projektets start till dess
Protected areas in Sweden - a Barents perspective
 Protected areas in Sweden - a Barents perspective Olle Höjer Swedish Environmental Protection Agency Naturvårdsverket Swedish Environmental Protection Agency 2013-04-03 1 The fundamental framework for
Isolda Purchase - EDI
 Isolda Purchase - EDI Document v 1.0 1 Table of Contents Table of Contents... 2 1 Introduction... 3 1.1 What is EDI?... 4 1.2 Sending and receiving documents... 4 1.3 File format... 4 1.3.1 XML (language
Senaste trenderna inom redovisning, rapportering och bolagsstyrning Lars-Olle Larsson, Swedfund International AB
 1 Senaste trenderna inom redovisning, rapportering och bolagsstyrning Lars-Olle Larsson, Swedfund International AB 2 PwC undersökning av börsföretag & statligt ägda företag Årlig undersökning av års- &
Swedish International Biodiversity Programme Sida/SLU
 Swedish International Biodiversity Programme Sida/SLU SwedBios Målsättning: Bidra till fattigdomsbekämpning och förbättrade levnadsförhållanden genom en rättvis, hållbar och produktiv förvaltning av biologiska
Alla Tiders Kalmar län, Create the good society in Kalmar county Contributions from the Heritage Sector and the Time Travel method
 Alla Tiders Kalmar län, Create the good society in Kalmar county Contributions from the Heritage Sector and the Time Travel method Goal Bring back the experiences from the international work of Kalmar
A metadata registry for Japanese construction field
 A metadata registry for Japanese construction field LCDM Forum, Japan October 25 th -27 th - 2006 TAKEYA, Isobe LCDM Forum Secretariat Document No. GEC-2005-002 LCDM Forum, Japan LCDM Forum, Japan Non-profit
The Swedish National Patient Overview (NPO)
") The Swedish National Patient Overview (NPO) Background and status 2009 Tieto Corporation Christer Bergh Manager of Healthcare Sweden Tieto, Healthcare & Welfare christer.bergh@tieto.com Agenda Background
The Swedish National Patient Overview (NPO) Background and status 2009 Tieto Corporation Christer Bergh Manager of Healthcare Sweden Tieto, Healthcare & Welfare christer.bergh@tieto.com Agenda Background
Installation Instructions
 Installation Instructions (Cat. No. 1794-IE8 Series B) This module mounts on a 1794 terminal base unit. 1. Rotate keyswitch (1) on terminal base unit (2) clockwise to position 3 as required for this type
Innovation in the health sector through public procurement and regulation
 Innovation in the health sector through public procurement and regulation MONA TRUELSEN & ARVID LØKEN 1 14/11/2013 Copyright Nordic Innovation 2011. All rights reserved. Nordic Innovation An institution
Swedish CEF Transport Secretariat. Connecting Europe Facility
 Swedish CEF Transport Secretariat Connecting Europe Facility CEF-secretariat Background and structure Precondition The Member State must approve all applications and follow-up reports(asr) The Member State
Beslut om bolaget skall gå i likvidation eller driva verksamheten vidare.
 ÅRSSTÄMMA REINHOLD POLSKA AB 7 MARS 2014 STYRELSENS FÖRSLAG TILL BESLUT I 17 Beslut om bolaget skall gå i likvidation eller driva verksamheten vidare. Styrelsen i bolaget har upprättat en kontrollbalansräkning
Measuring child participation in immunization registries: two national surveys, 2001
 Measuring child participation in immunization registries: two national surveys, 2001 Diana Bartlett Immunization Registry Support Branch National Immunization Program Objectives Describe the progress of
Arbetstillfällen 100 000.
 2 3 4 Arbetstillfällen 100 000. 5 6 7 Vissa anspråk ställs I de internationella direktiv och konventioner Sverige antingen är ålagt att följa eller frivilligt valt att följa. Här har jag listat några exempel
Goals for third cycle studies according to the Higher Education Ordinance of Sweden (Sw. "Högskoleförordningen")
") Goals for third cycle studies according to the Higher Education Ordinance of Sweden (Sw. "Högskoleförordningen") 1 1. Mål för doktorsexamen 1. Goals for doctoral exam Kunskap och förståelse visa brett
Goals for third cycle studies according to the Higher Education Ordinance of Sweden (Sw. "Högskoleförordningen") 1 1. Mål för doktorsexamen 1. Goals for doctoral exam Kunskap och förståelse visa brett
Regional Carbon Budgets
 Regional Carbon Budgets Rapid Pathways to Decarbonized Futures X-CAC Workshop 13 April 2018 web: www.cemus.uu.se Foto: Tina Rohdin Kevin Anderson Isak Stoddard Jesse Schrage Zennström Professor in Climate
Klicka här för att ändra format
 på 1 på Marianne Andrén General Manager marianne.andren@sandviken.se Sandbacka Park Högbovägen 45 SE 811 32 Sandviken Telephone: +46 26 24 21 33 Mobile: +46 70 230 67 41 www.isea.se 2 From the Off e project
Investeringsbedömning
 Investeringsbedömning 27/2 2013 Martin Abrahamson Doktorand UU Föreläsningen avhandlar Genomgång av Grundläggande begrepp och metoder NPV och jämförbara tekniker Payback Internränta/Internal Rate of Return
Materialplanering och styrning på grundnivå. 7,5 högskolepoäng
 Materialplanering och styrning på grundnivå Provmoment: Ladokkod: Tentamen ges för: Skriftlig tentamen TI6612 Af3-Ma, Al3, Log3,IBE3 7,5 högskolepoäng Namn: (Ifylles av student) Personnummer: (Ifylles
Collaborative Product Development:
 Collaborative Product Development: a Purchasing Strategy for Small Industrialized House-building Companies Opponent: Erik Sandberg, LiU Institutionen för ekonomisk och industriell utveckling Vad är egentligen
Kursplan. FÖ3032 Redovisning och styrning av internationellt verksamma företag. 15 högskolepoäng, Avancerad nivå 1
 Kursplan FÖ3032 Redovisning och styrning av internationellt verksamma företag 15 högskolepoäng, Avancerad nivå 1 Accounting and Control in Global Enterprises 15 Higher Education Credits *), Second Cycle
A study of the performance
 A study of the performance and utilization of the Swedish railway network Anders Lindfeldt Royal Institute of Technology 2011-02-03 Introduction The load on the railway network increases steadily, and
2014-05-15. Ulrika Bokeberg, Director Public Transport Authority, Region Västra Götaland, Sweden
 2014-05-15 Ulrika Bokeberg, Director Public Transport Authority, Region Västra Götaland, Sweden Västra Götaland Population: 1,6 million 49 municipalities Gothenburg M.A.: ~ 1 million Distance North-South:
Agreement EXTRA. Real wage increases, expanded part-time pensions and a low-wage effort in the unions joint agreement demands.
 Agreement EXTRA Real wage increases, expanded part-time pensions and a low-wage effort in the unions joint agreement demands. NOVEMBER 12016 United unions with combined strength in new wage negotiations
EBBA2 European Breeding Bird Atlas
 Methodology Sergi Herrando, Verena Keller, Petr Voříšek et al. objectives 1. To document breeding evidence for all bird species at a resolution of 50x50 km 2. To estimate abundance for all bird species
School of Management and Economics Reg. No. EHV 2008/220/514 COURSE SYLLABUS. Fundamentals of Business Administration: Management Accounting
 School of Management and Economics Reg. No. EHV 2008/220/514 COURSE SYLLABUS Fundamentals of Business Administration: Management Accounting Course Code FE3001 Date of decision 2008-06-16 Decision-making
Utvecklings- och tillväxtplan för ett hållbart Åland
 Utvecklings- och tillväxtplan för ett hållbart Åland 2015-2017 ------------------------------------------------ Development- and growth plan for a sustainable Åland 2015-2017 Ann Nedergård Hållbarhetsstrateg
A VIEW FROM A GAS SYSTEM OPERATOR. Hans Kreisel, Weum/Swedegas Gasdagarna, 16 May 2019
 A VIEW FROM A GAS SYSTEM OPERATOR Hans Kreisel, Weum/Swedegas Gasdagarna, 16 May 2019 Gas powers Sweden s energy transition. Creating a new energy company to the benefit of our customers and the society
Hållbar utveckling i kurser lå 16-17
 Hållbar utveckling i kurser lå 16-17 : Jag tillhör akademin / My position is in the School of Jag tillhör akademin / My position is in the School of Humaniora och medier / Humanities and Media Studies
Projektmodell med kunskapshantering anpassad för Svenska Mässan Koncernen
 Examensarbete Projektmodell med kunskapshantering anpassad för Svenska Mässan Koncernen Malin Carlström, Sandra Mårtensson 2010-05-21 Ämne: Informationslogistik Nivå: Kandidat Kurskod: 2IL00E Projektmodell
Beijer Electronics AB 2000, MA00336A, 2000-12
 Demonstration driver English Svenska Beijer Electronics AB 2000, MA00336A, 2000-12 Beijer Electronics AB reserves the right to change information in this manual without prior notice. All examples in this
Health café. Self help groups. Learning café. Focus on support to people with chronic diseases and their families
 Health café Resources Meeting places Live library Storytellers Self help groups Heart s house Volunteers Health coaches Learning café Recovery Health café project Focus on support to people with chronic
Läkemedelsverkets Farmakovigilansdag
 Swedish Medical Products Agency s Patient- and Consumer Advisory Board Brita Sjöström May 29, 2018 Patientrådet@mpa.se https://lakemedelsverket.se/patient-konsument-rad The vision of the Swedish Medical
Kursplan. NA3009 Ekonomi och ledarskap. 7,5 högskolepoäng, Avancerad nivå 1. Economics of Leadership
 Kursplan NA3009 Ekonomi och ledarskap 7,5 högskolepoäng, Avancerad nivå 1 Economics of Leadership 7.5 Higher Education Credits *), Second Cycle Level 1 Mål Studenterna skall efter genomgången kurs: kunna
Biblioteket.se. A library project, not a web project. Daniel Andersson. Biblioteket.se. New Communication Channels in Libraries Budapest Nov 19, 2007
 A library project, not a web project New Communication Channels in Libraries Budapest Nov 19, 2007 Daniel Andersson, daniel@biblioteket.se 1 Daniel Andersson Project manager and CDO at, Stockholm Public
Custom-made software solutions for increased transport quality and creation of cargo specific lashing protocols.
 Custom-made software solutions for increased transport quality and creation of cargo specific lashing protocols. ExcelLoad simulates the maximum forces that may appear during a transport no matter if the
Understanding Innovation as an Approach to Increasing Customer Value in the Context of the Public Sector
 Thesis for the degree of Licentiate of Philosophy, Östersund 2014 Understanding Innovation as an Approach to Increasing Customer Value in the Context of the Public Sector Klas Palm Supervisors: Håkan Wiklund
http://marvel.com/games/play/31/create_your_own_superhero http://www.heromachine.com/
 Name: Year 9 w. 4-7 The leading comic book publisher, Marvel Comics, is starting a new comic, which it hopes will become as popular as its classics Spiderman, Superman and The Incredible Hulk. Your job
Semantic and Physical Modeling and Simulation of Multi-Domain Energy Systems: Gas Turbines and Electrical Power Networks
 DEGREE PROJECT IN ELECTRICAL ENGINEERING, SECOND CYCLE, 30 CREDITS STOCKHOLM, SWEDEN 2017 Semantic and Physical Modeling and Simulation of Multi-Domain Energy Systems: Gas Turbines and Electrical Power
How will the Nordic industry be affected by early decommissioning of nuclear? Maria Sunér Fleming, Svenskt Näringsliv
 How will the Nordic industry be affected by early decommissioning of nuclear? Maria Sunér Fleming, Svenskt Näringsliv The industry is important for Sweden 2 85 % of the export is related to goods Jobs
Kursplan. NA1032 Makroekonomi, introduktion. 7,5 högskolepoäng, Grundnivå 1. Introductory Macroeconomics
 Kursplan NA1032 Makroekonomi, introduktion 7,5 högskolepoäng, Grundnivå 1 Introductory Macroeconomics 7.5 Higher Education Credits *), First Cycle Level 1 Mål Det övergripande målet med kursen är att studenterna
CEDEC Annual konferens 15-10-2015
 CEDEC Annual konferens 15-10-2015 The role of Swedish local DSO in creating flexibility in the energy value chain Elinorr Joint venture of 16 local grid operators according to the European public procurement
Item 6 - Resolution for preferential rights issue.
 Item 6 - Resolution for preferential rights issue. The board of directors in Tobii AB (publ), reg. no. 556613-9654, (the Company ) has on November 5, 2016, resolved to issue shares in the Company, subject
Projekt Laxförvaltning för framtiden & Älvspecifik laxförvaltning Salmon Management for the Future / River Specific Management
 Projekt Laxförvaltning för framtiden & Älvspecifik laxförvaltning Salmon Management for the Future / River Specific Management 48 of the Baltic Seas 82 wild salmon rivers are extirpated due to: Migration
Schenker Privpak AB Telefon VAT Nr. SE Schenker ABs ansvarsbestämmelser, identiska med Box 905 Faxnr Säte: Borås
 Schenker Privpak AB Interface documentation for web service packageservices.asmx 2012-09-01 Version: 1.0.0 Doc. no.: I04304b Sida 2 av 7 Revision history Datum Version Sign. Kommentar 2012-09-01 1.0.0
Resultat av den utökade första planeringsövningen inför RRC september 2005
 Resultat av den utökade första planeringsövningen inför RRC-06 23 september 2005 Resultat av utökad första planeringsövning - Tillägg av ytterligare administrativa deklarationer - Variant (av case 4) med
Surfaces for sports areas Determination of vertical deformation. Golvmaterial Sportbeläggningar Bestämning av vertikal deformation
 SVENSK STANDARD SS-EN 14809:2005/AC:2007 Fastställd/Approved: 2007-11-05 Publicerad/Published: 2007-12-03 Utgåva/Edition: 1 Språk/Language: engelska/english ICS: 97.220.10 Golvmaterial Sportbeläggningar
Analys och bedömning av företag och förvaltning. Omtentamen. Ladokkod: SAN023. Tentamen ges för: Namn: (Ifylles av student.
 Analys och bedömning av företag och förvaltning Omtentamen Ladokkod: SAN023 Tentamen ges för: Namn: (Ifylles av student Personnummer: (Ifylles av student) Tentamensdatum: Tid: 2014-02-17 Hjälpmedel: Lexikon
Om oss DET PERFEKTA KOMPLEMENTET THE PERFECT COMPLETION 04 EN BINZ ÄR PRECIS SÅ BRA SOM DU FÖRVÄNTAR DIG A BINZ IS JUST AS GOOD AS YOU THINK 05
 Om oss Vi på Binz är glada att du är intresserad av vårt support-system för begravningsbilar. Sedan mer än 75 år tillverkar vi specialfordon i Lorch för de flesta olika användningsändamål, och detta enligt
Är passivhus lämpliga i fjärrvärmeområden?
 Är passivhus lämpliga i fjärrvärmeområden? Leif Gustavsson Energiting Sydost 2011 5 maj 2011 Linnéuniversitetet, Växjö Världens primärenergianvändning 2007 ( 500 Exajoul) Olja 34% Kol 26% Gas 21% Totalt
SWESIAQ Swedish Chapter of International Society of Indoor Air Quality and Climate
 Swedish Chapter of International Society of Indoor Air Quality and Climate Aneta Wierzbicka Swedish Chapter of International Society of Indoor Air Quality and Climate Independent and non-profit Swedish
Varför ett nytt energisystem?
 Varför ett nytt energisystem? Bo Diczfalusy, Departementsråd F.d. Director of Sustainable Energy Technology and Policy, International Energy Agency, Paris Näringsdepartementet OECD/IEA 2012 ETP 2012 Choice
PowerCell Sweden AB. Ren och effektiv energi överallt där den behövs
 PowerCell Sweden AB Ren och effektiv energi överallt där den behövs Requirements of power electronics for fuel cells in electric vehicles Andreas Bodén (Rickard Nilsson) Förstudie: Kravställning på kraftelektronik
Olika uppfattningar om torv och
 Olika uppfattningar om torv och hållbar utveckling KSLAs och torvkongressens konferens om torv den 31 augusti 2011 Magnus Brandel, projektledare Svenska torvproducentföreningen Denna presentation diskuterar
KPMG Stockholm, 2 juni 2016
 KPMG Stockholm, 2 juni 2016 Inställningen till skatt förändras fundamentalt ses inte längre bara som en kostnad som behöver hanteras Förväntningarna på transparens kring skatt ökar Skatt framförallt rättviseaspekter
3 rd October 2017
 3 rd October 2017 Failures of Scaffold False work Failures Form work Bursting Trench Support Failure Hoarding Failures Can be expensive and result in fatalities and serious injuries Cardiff
Module 6: Integrals and applications
 Department of Mathematics SF65 Calculus Year 5/6 Module 6: Integrals and applications Sections 6. and 6.5 and Chapter 7 in Calculus by Adams and Essex. Three lectures, two tutorials and one seminar. Important
Viktig information för transmittrar med option /A1 Gold-Plated Diaphragm
 Viktig information för transmittrar med option /A1 Gold-Plated Diaphragm Guldplätering kan aldrig helt stoppa genomträngningen av vätgas, men den får processen att gå långsammare. En tjock guldplätering
Industrial Management Models with Emphasis on Construction Waste. Jan Stenis
 Department of Construction and Architecture Division of Construction Management Industrial Management Models with Emphasis on Construction Waste Jan Stenis Postal address P.O. Box 118, SE-221 00 LUND,
SOLAR LIGHT SOLUTION. Giving you the advantages of sunshine. Ningbo Green Light Energy Technology Co., Ltd.
 2017 SOLAR LIGHT SOLUTION Address:No.5,XingYeMiddleRoad,NingboFreeTradeZone,China Tel:+86-574-86812925 Fax:+86-574-86812905 Giving you the advantages of sunshine SalesServiceE-mail:sales@glenergy.cn Tech.ServiceE-mail:service@glenergy.cn
Kursplan. EN1088 Engelsk språkdidaktik. 7,5 högskolepoäng, Grundnivå 1. English Language Learning and Teaching
 Kursplan EN1088 Engelsk språkdidaktik 7,5 högskolepoäng, Grundnivå 1 English Language Learning and Teaching 7.5 Higher Education Credits *), First Cycle Level 1 Mål Efter genomgången kurs ska studenten
The cornerstone of Swedish disability policy is the principle that everyone is of equal value and has equal rights.
 Swedish disability policy -service and care for people with funcional impairments The cornerstone of Swedish disability policy is the principle that everyone is of equal value and has equal rights. The
Stad + Data = Makt. Kart/GIS-dag SamGIS Skåne 6 december 2017
 Smart@Helsingborg Stadsledningsförvaltningen Digitaliseringsavdelningen the World s most engaged citizens Stad + Data = Makt Kart/GIS-dag SamGIS Skåne 6 december 2017 Photo: Andreas Fernbrant Urbanisering
School of Management and Economics Reg. No. EHV 2008/245/514 COURSE SYLLABUS. Business and Market I. Business Administration.
 School of Management and Economics Reg. No. EHV 2008/245/514 COURSE SYLLABUS Business and Market I Course Code FE4001 Date of decision 2008-09-02 Decision-making Body Board: School of Management and Economics
Sofia Brockmark
 Sofia Brockmark 2014-10-24 1 SwAM SwAM is part of the Ministry of the Environment Provides supporting documentation about fishing issues for the Ministry for Rural Affairs Started operations July 1, 2011
.SE (Stiftelsen för Internetinfrastruktur) Presentation November 2009
 Presentation November 2009") .SE (Stiftelsen för Internetinfrastruktur) Presentation November 2009 About us.se (The Internet Infrastructure Foundation) is responsible for the.se top-level domain. Non-profit organisation founded in
.SE (Stiftelsen för Internetinfrastruktur) Presentation November 2009 About us.se (The Internet Infrastructure Foundation) is responsible for the.se top-level domain. Non-profit organisation founded in
BTS Group AB (publ) Annual General Meeting 2016 Stockholm, May 10, 2016
 Annual General Meeting 2016 Stockholm, May 10, 2016") BTS Group AB (publ) Annual General Meeting 2016 Stockholm, May 10, 2016 Copyright 2016 BTS Copyright 2016 BTS www.pwc.se Revisionen 2015 BTS Group AB (publ) årsstämma 10 maj 2016 Revisionens syfte och
BTS Group AB (publ) Annual General Meeting 2016 Stockholm, May 10, 2016 Copyright 2016 BTS Copyright 2016 BTS www.pwc.se Revisionen 2015 BTS Group AB (publ) årsstämma 10 maj 2016 Revisionens syfte och
SVENSK STANDARD SS :2010
 SVENSK STANDARD SS 8760009:2010 Fastställd/Approved: 2010-03-22 Publicerad/Published: 2010-04-27 Utgåva/Edition: 2 Språk/Language: svenska/swedish ICS: 11.140 Sjukvårdstextil Sortering av undertrikå vid
Methods to increase work-related activities within the curricula. S Nyberg and Pr U Edlund KTH SoTL 2017
 Methods to increase work-related activities within the curricula S Nyberg and Pr U Edlund KTH SoTL 2017 Aim of the project Increase Work-related Learning Inspire theachers Motivate students Understanding
EXPERT SURVEY OF THE NEWS MEDIA
 EXPERT SURVEY OF THE NEWS MEDIA THE SHORENSTEIN CENTER ON THE PRESS, POLITICS & PUBLIC POLICY JOHN F. KENNEDY SCHOOL OF GOVERNMENT, HARVARD UNIVERSITY, CAMBRIDGE, MA 0238 PIPPA_NORRIS@HARVARD.EDU. FAX:
NORDIC GRID DISTURBANCE STATISTICS 2012
 NORDIC GRID DISTURBANCE STATISTICS 2012 Utdrag ur rapport utarbetad av DISTAC-gruppen under RGN inom ENTSO-E Sture Holmström 2 Korta bakgrundsfakta > 1999-2000 utarbetades Riktlinjer för klassificering
District Application for Partnership
 ESC Region Texas Regional Collaboratives in Math and Science District Application for Partnership 2013-2014 Applying for (check all that apply) Math Science District Name: District Contacts Name E-mail
Tunga metaller / Heavy metals ICH Q3d & Farmakope. Rolf Arndt Cambrex Karlskoga
 Tunga metaller / Heavy metals ICH Q3d & Farmakope Rolf Arndt Cambrex Karlskoga Tunga metaller / Heavy metals Rolf Arndt -Quality Assurance Cambrex Karlskoga - Svenska Farmakopekommitten / Working Party
The Swedish system of Contract Archaeology
 The Swedish system of Contract Archaeology An analysis of current opinions Appendix 1 Poll questions Poll questions The poll questions are presented in Swedish and translated to English. The images on